Statistics

Scatter graphs and correlation

9 past-paper questions, easiest first. Try each one, then reveal the answer.

Foundation & Higher8 of 9 from Foundation papers

Revision guide by The Full Marks

Scatter graphs and correlation: what you need to know

Scatter graphs plot pairs of data to see if two things are linked. You describe the correlation, draw a line of best fit and use it to make estimates, while knowing when those estimates can't be trusted.

Key facts

  • Positive correlation: as one value goes up, the other goes up.
  • Negative correlation: as one value goes up, the other goes down.
  • No correlation: no clear pattern.
  • A line of best fit is one straight line through the middle of the points, with about as many above as below. Do not join the dots.
  • An outlier is a point that does not fit the pattern of the others. It is not just the biggest or smallest value.
  • Correlation does not prove causation: one thing is not necessarily causing the other.

Estimating with a line of best fit

  1. Draw a single straight line following the trend.
  2. Go up (or across) from the value you know to the line.
  3. Read across (or down) to the other axis.

Worked examples

Example 1 Foundation · grade 3

A scatter graph shows hours of revision and test scores for Year 11 students, with revision from 1 to 9 hours. The line of best fit passes through (2, 40) and (8, 70). (a) Describe the correlation. (b) Estimate the score for 5 hours of revision.

Show the solution

(a) Positive correlation: students who revised more tended to score higher.
(b) From 2 to 8 hours the score rises 30 marks, which is 5 marks per hour.
5 hours is 3 hours after 2, so 40 + 3 × 5 = 55 marks

Example 2 Foundation · grade 4

Using the same line, Callum says a student who revises for 14 hours will score 100 marks. Explain why this estimate is unreliable.

Show the solution

Following the line: 40+12×5=10040 + 12 \times 5 = 100
But 14 hours is outside the data (1 to 9 hours), so this is extrapolation: the trend may not continue.
The test may also have a maximum mark below 100.

Common mistakes

  • Joining the points dot to dot instead of drawing one straight line.
  • Describing the axes ('both numbers go up') instead of the pattern of the points. Say 'positive correlation' or explain the link in context, e.g. 'older babies tend to weigh more'.
  • Using a single nearby point to estimate instead of the line of best fit.

Exam tips

  • An outlier is a point far from the pattern; ignore it when drawing your line. One outlier does not change the overall correlation of the rest.
  • Estimates inside the range of the data (interpolation) are fairly reliable; outside it (extrapolation) they may not be. Say so in your answer.
  • When estimating, draw the line of best fit and your reading lines on the graph; the method mark is often for these.
  • If asked what is wrong with someone's scatter graph, look for a poor line of best fit and axis scales that are not evenly spaced.

Questions people ask

How do you draw a line of best fit?

Use a ruler to draw one straight line that follows the trend of the points, with roughly equal numbers of points on each side. It does not have to go through the origin.

Does correlation mean one thing causes the other?

No. Ice cream sales and sunburn both rise in summer, but one doesn't cause the other: hot weather causes both.

Exam questions: Scatter graphs and correlation (9, easiest first)

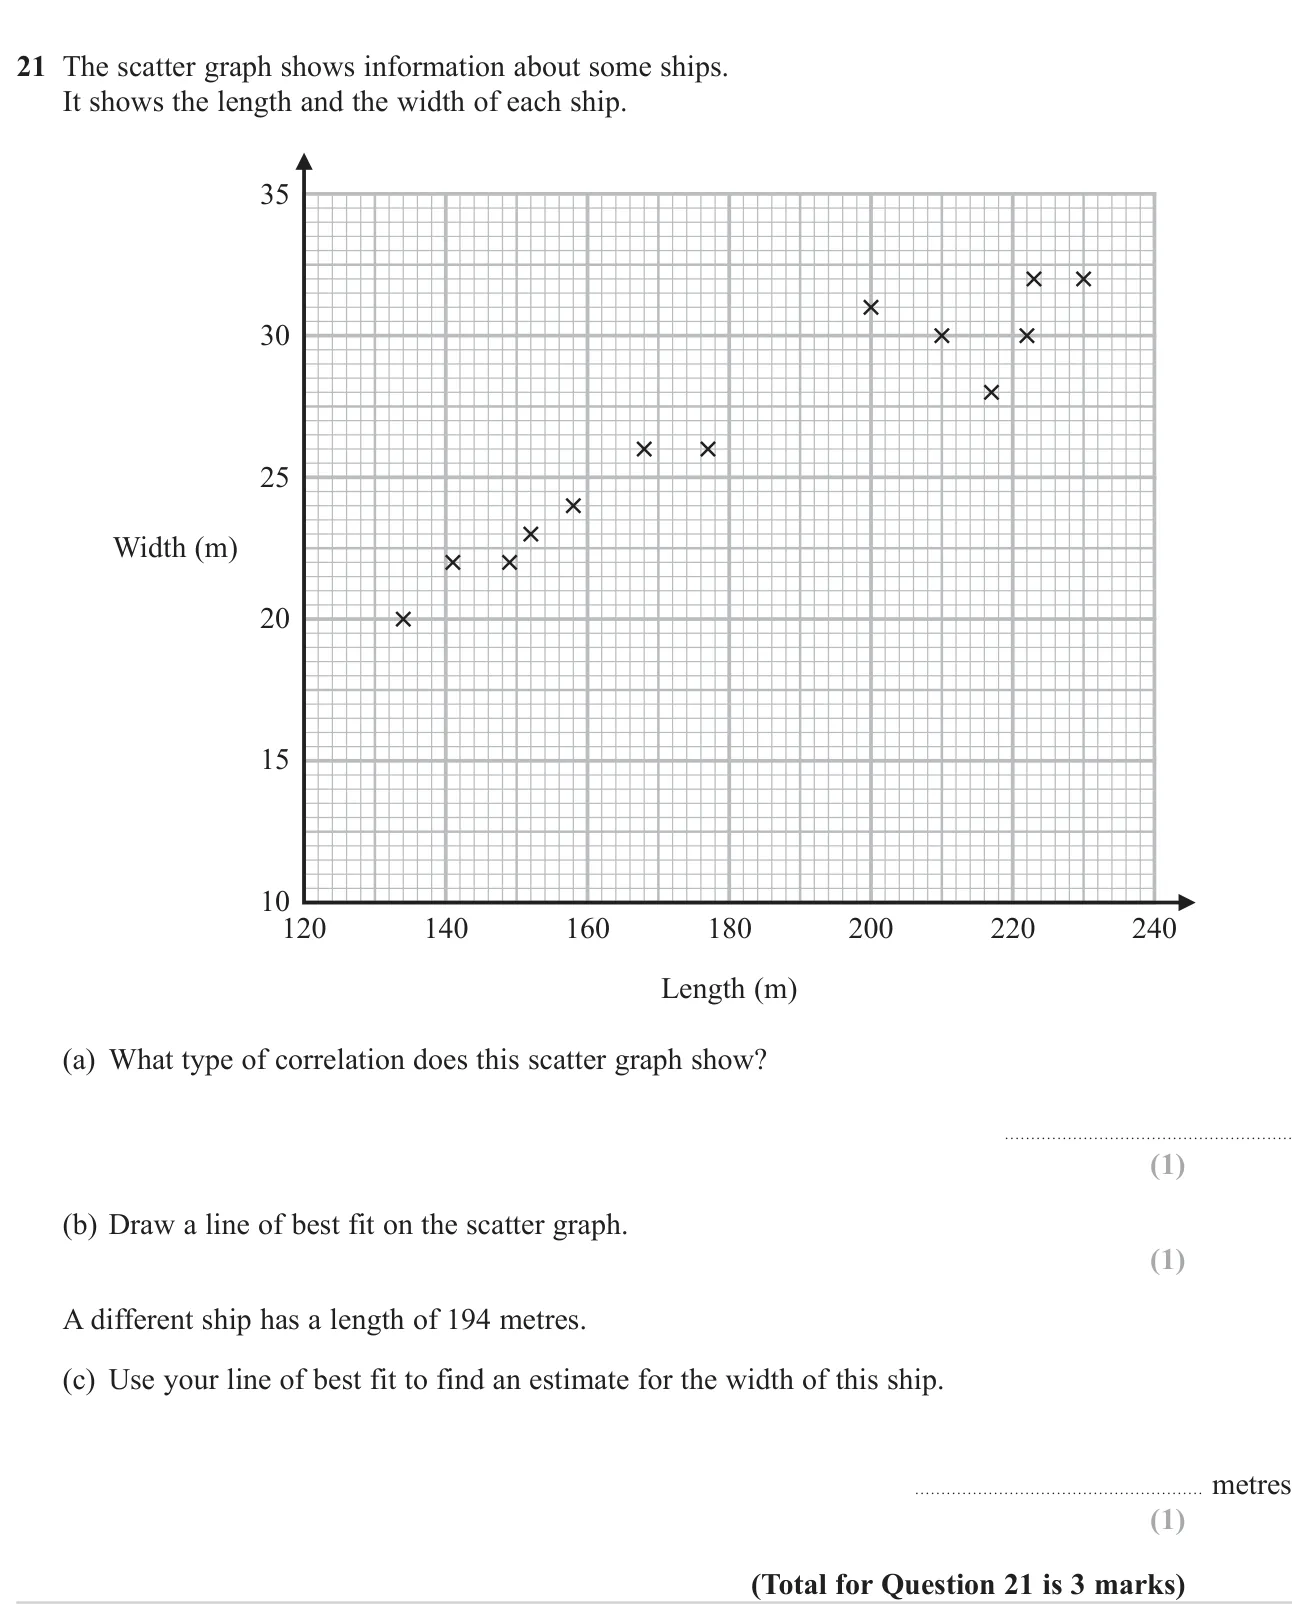
Scatter graphs and correlation3 marksGrade 3CalculatorOn both tiers
November 2024 · Paper 2 Foundation · Q21
Describe the correlation on a scatter graph, draw a line of best fit and use it to estimate a value.

© Pearson Education Ltd. November 2024 Paper 2 (Foundation, calculator), question 21.

Show answer
(a)Positive1 mark
(b)Line of best fit drawn1 mark
(c)About 28 m (26.5 to 29.5)1 mark

Worked solution Checked against the mark scheme

(a) Longer ships tend to be wider, so the correlation is positive.

(b) Draw one straight line through the middle of the crosses, with roughly as many points above as below.

(c) Go up from 194 m on the length axis to the line, then across: about 28 m.

Watch out: Joining the points dot to dot instead of drawing one straight line.
Scatter graphs and correlation4 marksGrade 3CalculatorOn both tiers
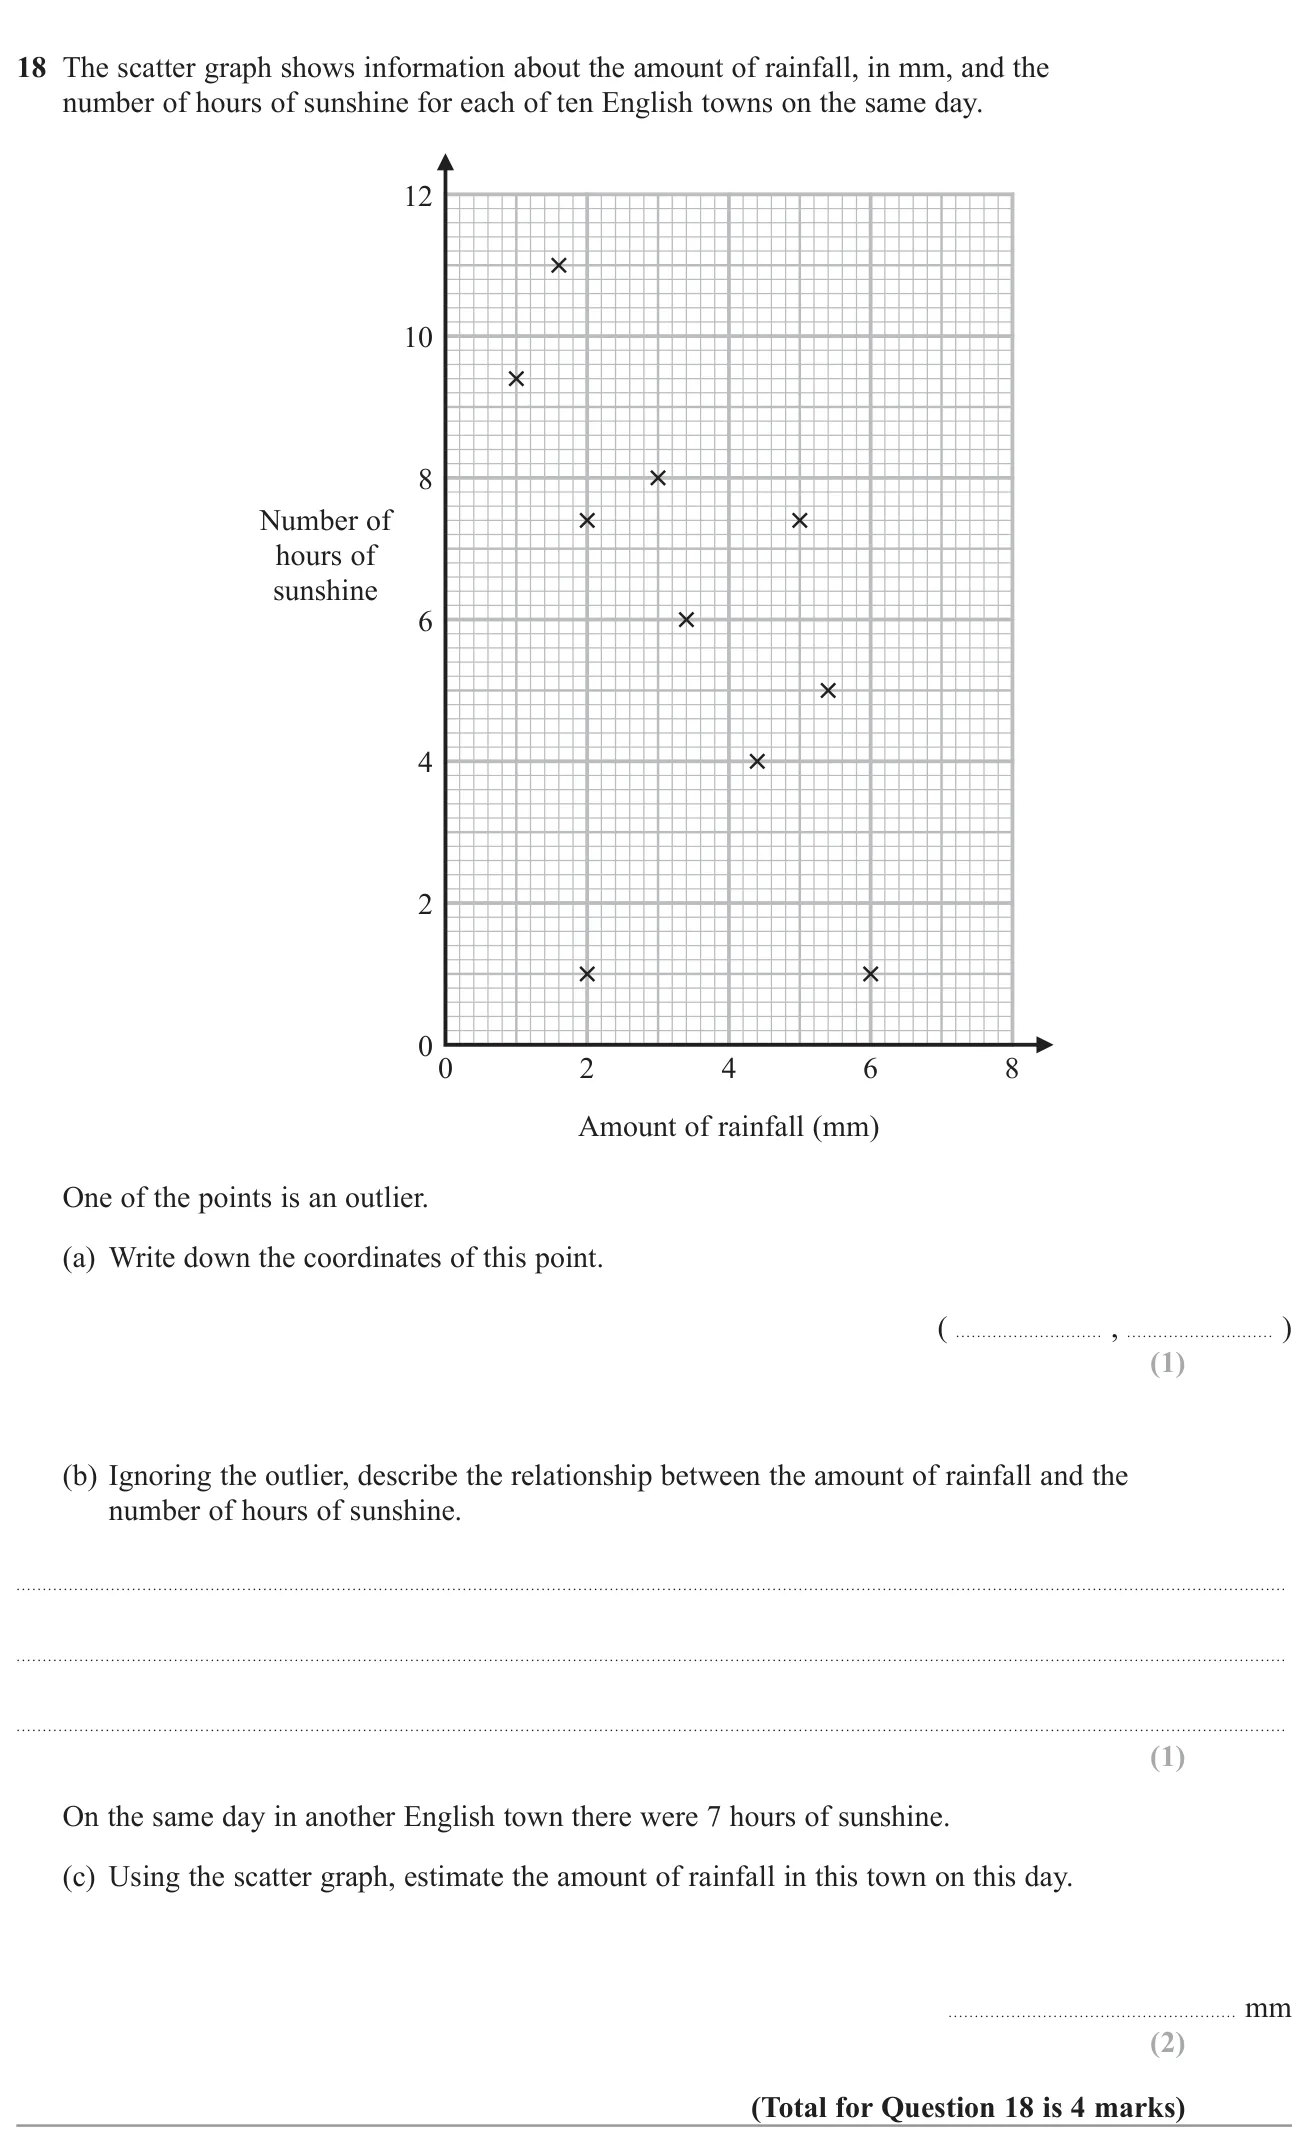
November 2022 · Paper 2 Foundation · Q18
Identify an outlier on a scatter graph, describe the correlation and use a line of best fit to estimate a value.

© Pearson Education Ltd. November 2022 Paper 2 (Foundation, calculator), question 18.

Show answer
(a)(2,1)(2, 1)1 mark
(b)Negative correlation: more rainfall goes with fewer hours of sunshine1 mark
(c)3 to 4 mm2 marks

Worked solution Checked against the mark scheme

(a) The point at (2,1)(2, 1) is far away from the trend of the others.

(b) As rainfall goes up, sunshine goes down: negative correlation.

(c) Draw a line of best fit, go across from 7 hours to the line and down: about 3.5 mm.

Watch out: Choosing (6, 1) as the outlier; it fits the downward trend.

Scatter graphs and correlation4 marksGrade 3CalculatorOn both tiers
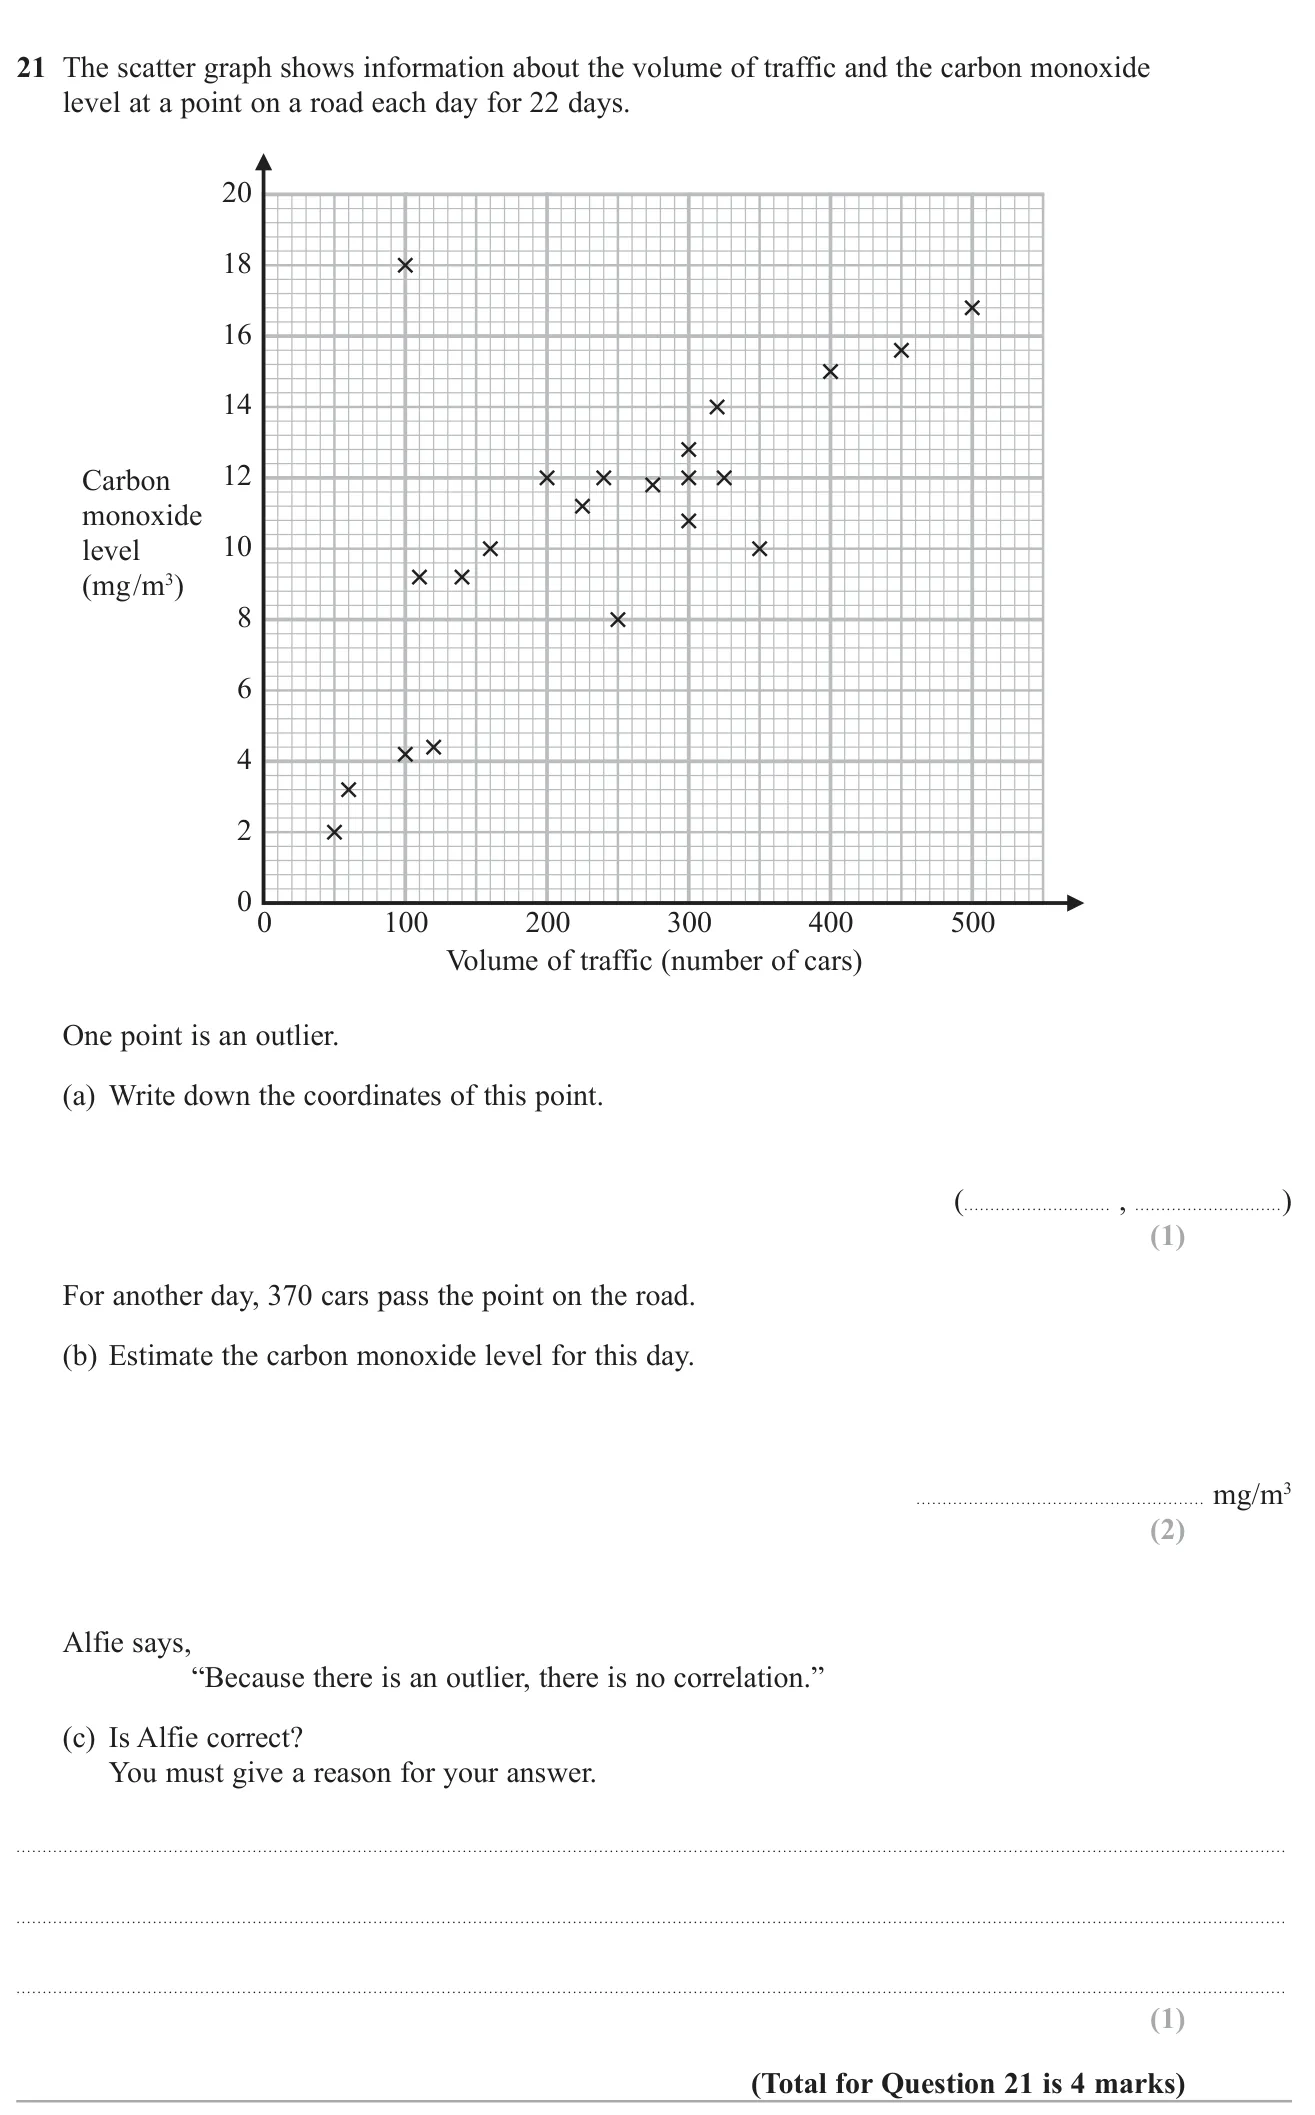
November 2021 · Paper 3 Foundation · Q21
Identify an outlier on a scatter graph, estimate a value, and comment on a claim about correlation.

© Pearson Education Ltd. November 2021 Paper 3 (Foundation, calculator), question 21.

Show answer
(a)(100, 18)1 mark
(b)About 13.8 mg/m³ (12.8 to 14.8)2 marks
(c)No, the rest of the points still show positive correlation1 mark

Worked solution Checked against the mark scheme

(a) The point far from the others is at (100,18)(100, 18).

(b) Draw a line of best fit through the main trend and read up from 370: about 13.8 mg/m³.

(c) No. One outlier does not remove the pattern; the other points still show positive correlation.

Watch out: In (c), agreeing with Alfie or saying 'yes'.

Scatter graphs and correlation2 marksGrade 3CalculatorOn both tiers
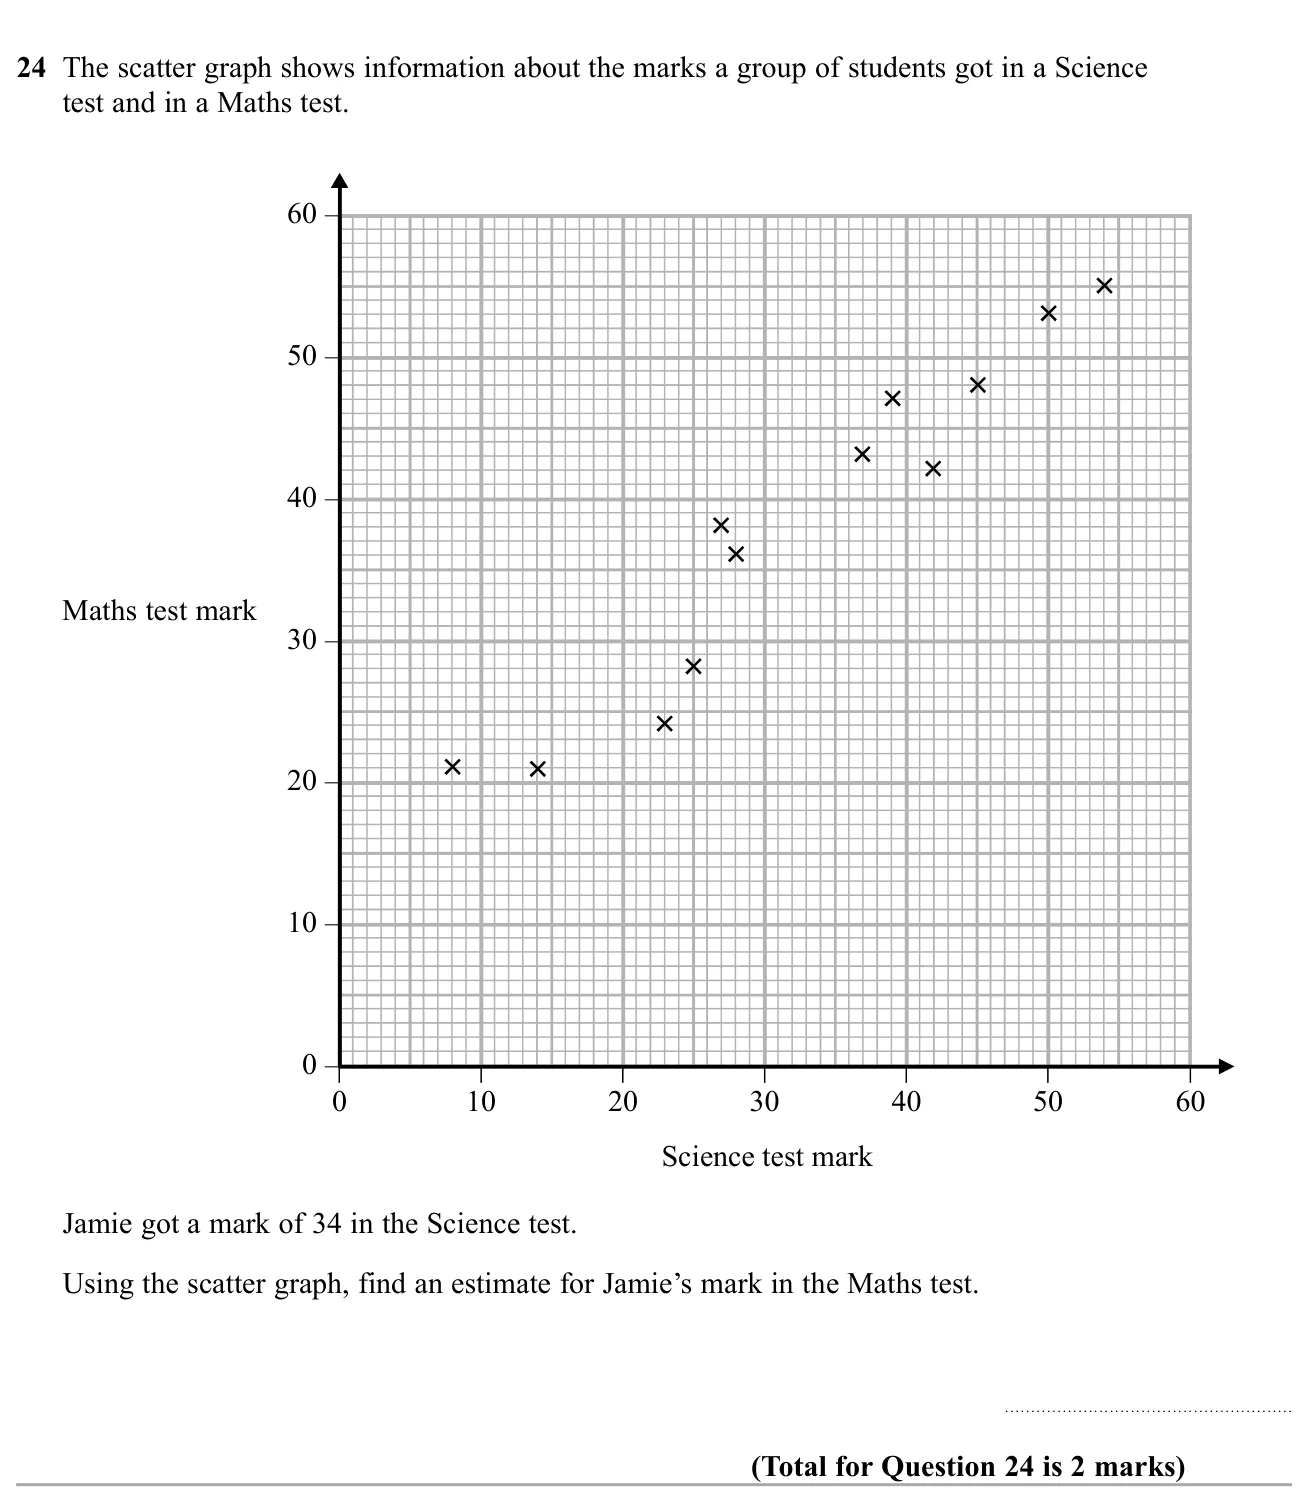
November 2019 · Paper 3 Foundation · Q24
Use a scatter graph to estimate one test mark from another.

© Pearson Education Ltd. November 2019 Paper 3 (Foundation, calculator), question 24.

Show answer
AnswerAbout 40 (35 to 42 accepted)2 marks

Worked solution Checked against the mark scheme

Draw a line of best fit through the middle of the crosses.

Go up from 34 on the Science axis to the line, then across to the Maths axis. This reads about 40.

Watch out: Reading off a single nearby cross instead of using a line of best fit.

Scatter graphs and correlation2 marksGrade 3CalculatorOn both tiers
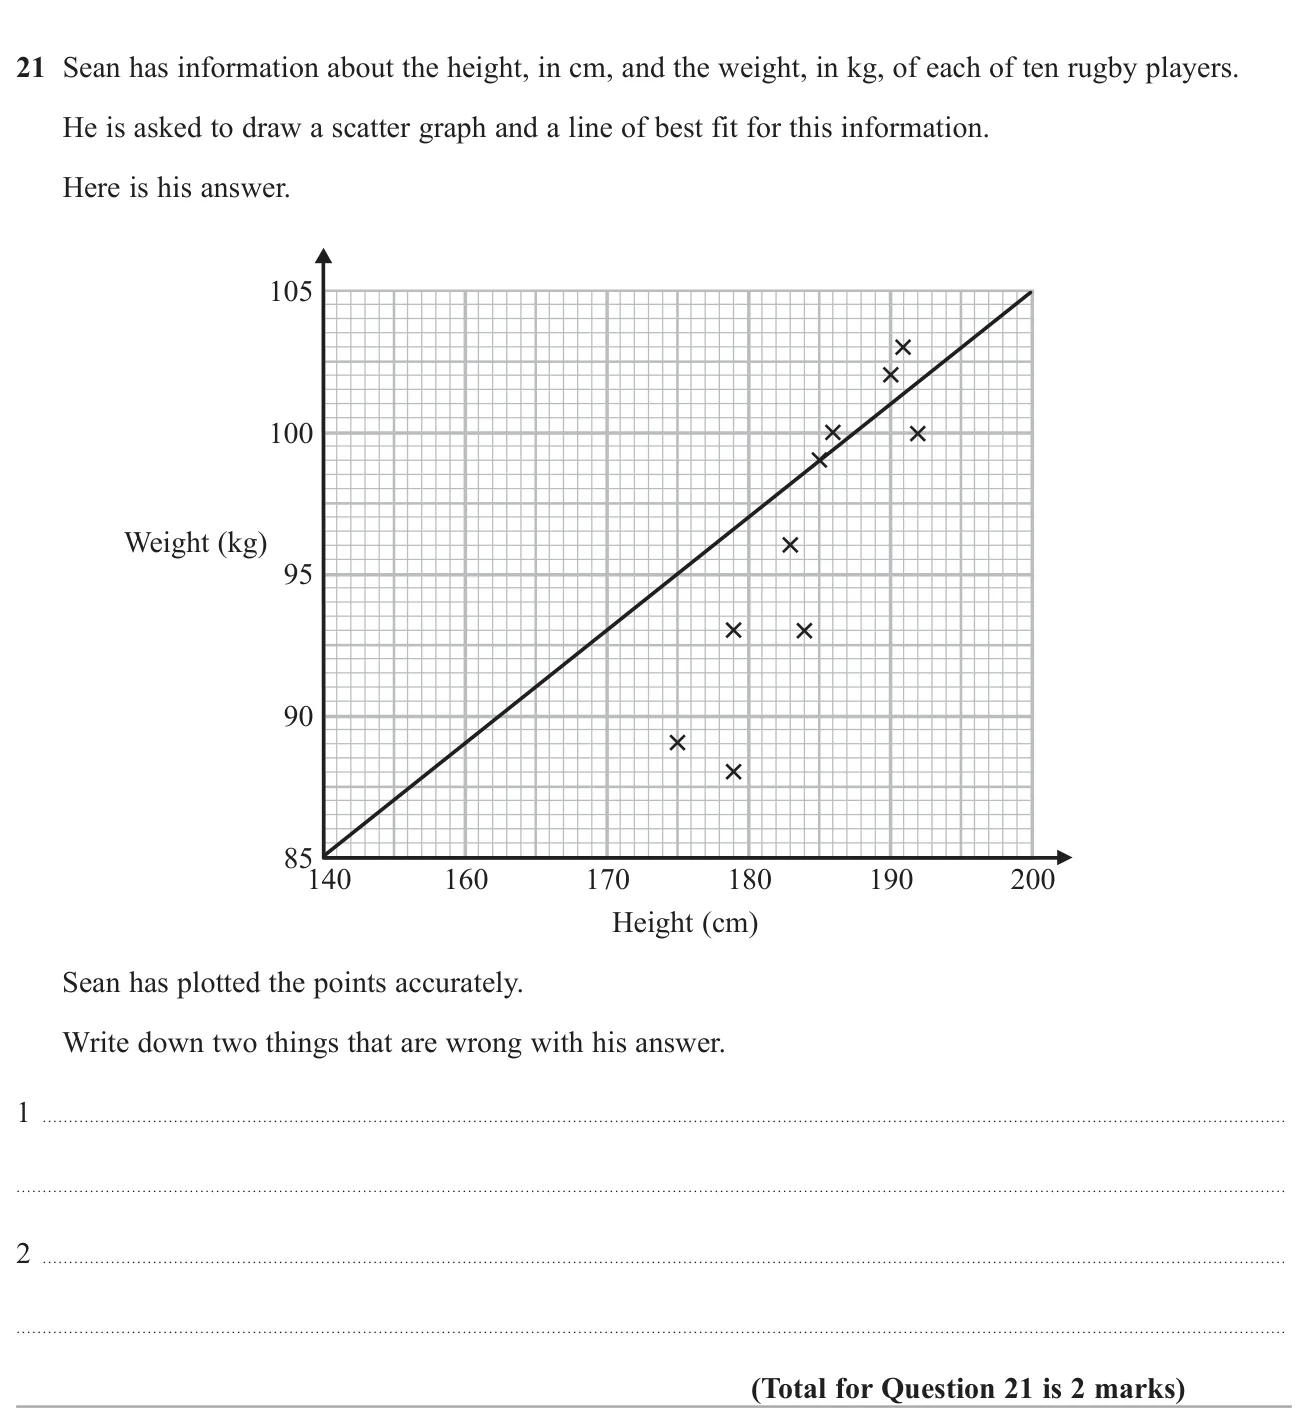
November 2018 · Paper 2 Foundation · Q21
Identify two faults in a student's scatter graph and line of best fit.

© Pearson Education Ltd. November 2018 Paper 2 (Foundation, calculator), question 21.

Show answer
AnswerThe line of best fit is wrong (it does not follow the points); the height scale is not evenly spaced (150 is missing)2 marks

Worked solution Checked against the mark scheme

Check the line: it should pass through the middle of the crosses with roughly equal numbers either side, which Sean's does not.

Check the axes: the height axis jumps from 140 to 160 in the same space as 160 to 170, so the scale is uneven.

Watch out: Saying there is no title or the axis should start at 0.

Scatter graphs and correlation5 marksGrade 3CalculatorFoundation
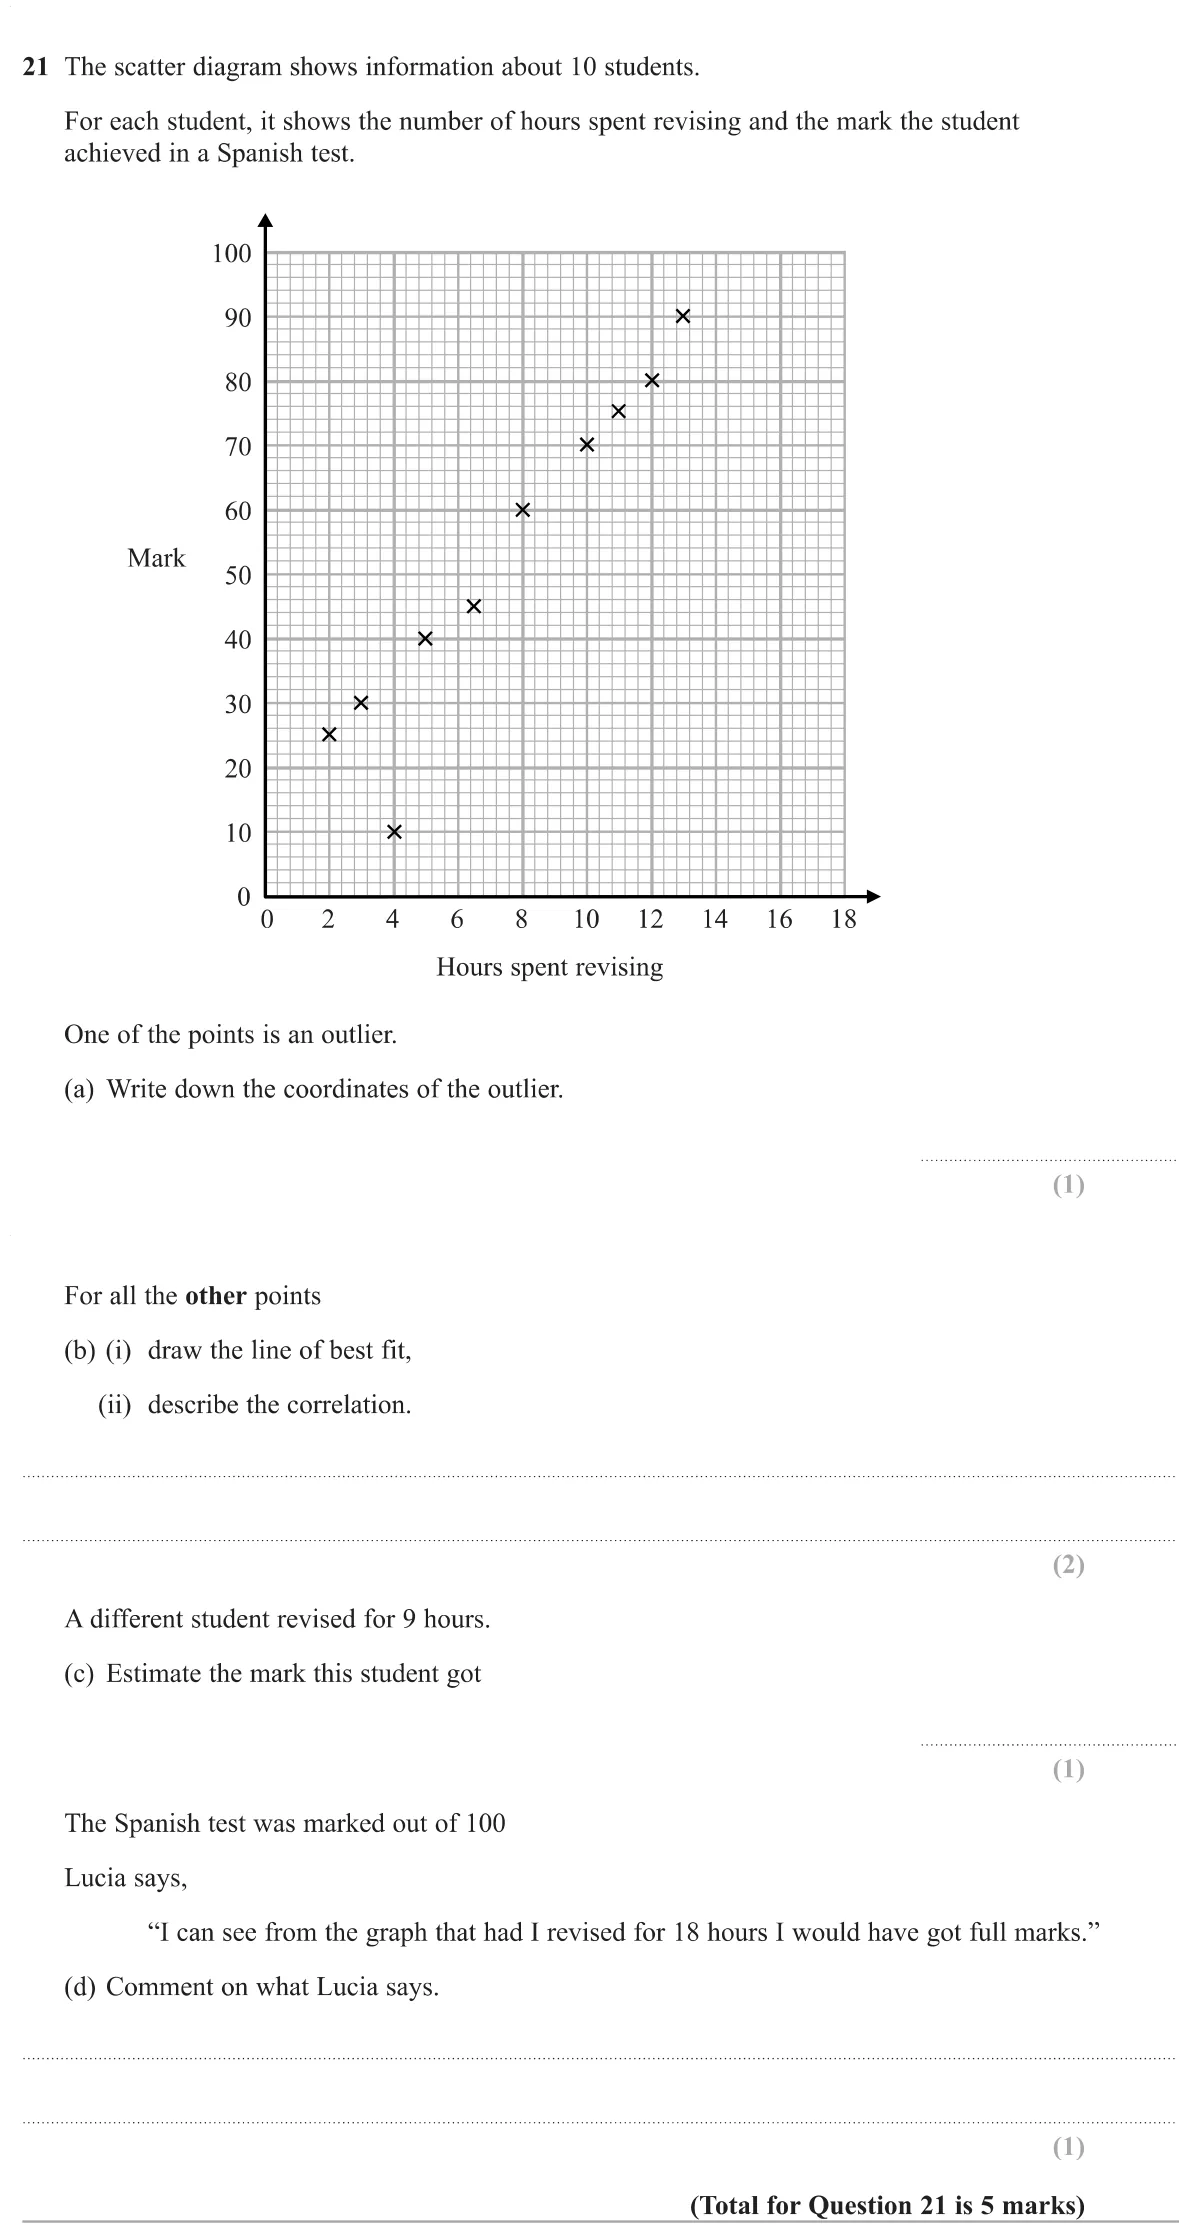
Specimen · Paper 3 Foundation · Q21
Read a scatter graph: identify an outlier, draw a line of best fit, describe correlation, estimate a value and comment on extrapolation.

© Pearson Education Ltd. Specimen Paper 3 (Foundation, calculator), question 21.

Show answer
(a)(4, 10)1 mark
(b(i))A straight line through the middle of the other points1 mark
(b(ii))Positive1 mark
(c)Between 60 and 701 mark
(d)She is extrapolating: 18 hours is outside the data, so the trend may not continue1 mark

Worked solution Checked against the mark scheme

(a) The point (4, 10) sits well below the pattern of the others.

(b) Draw a straight ruler line through the middle of the other nine points, roughly from (2, 22) to (13, 86). As hours go up, marks go up: positive correlation.

(c) Go up from 9 hours to the line and across: about 65.

(d) The data only go up to 13 hours. Using the line at 18 hours is extrapolation, so we cannot be sure she would get full marks.

Watch out: In (b)(i), forcing the line through the outlier or through the origin.

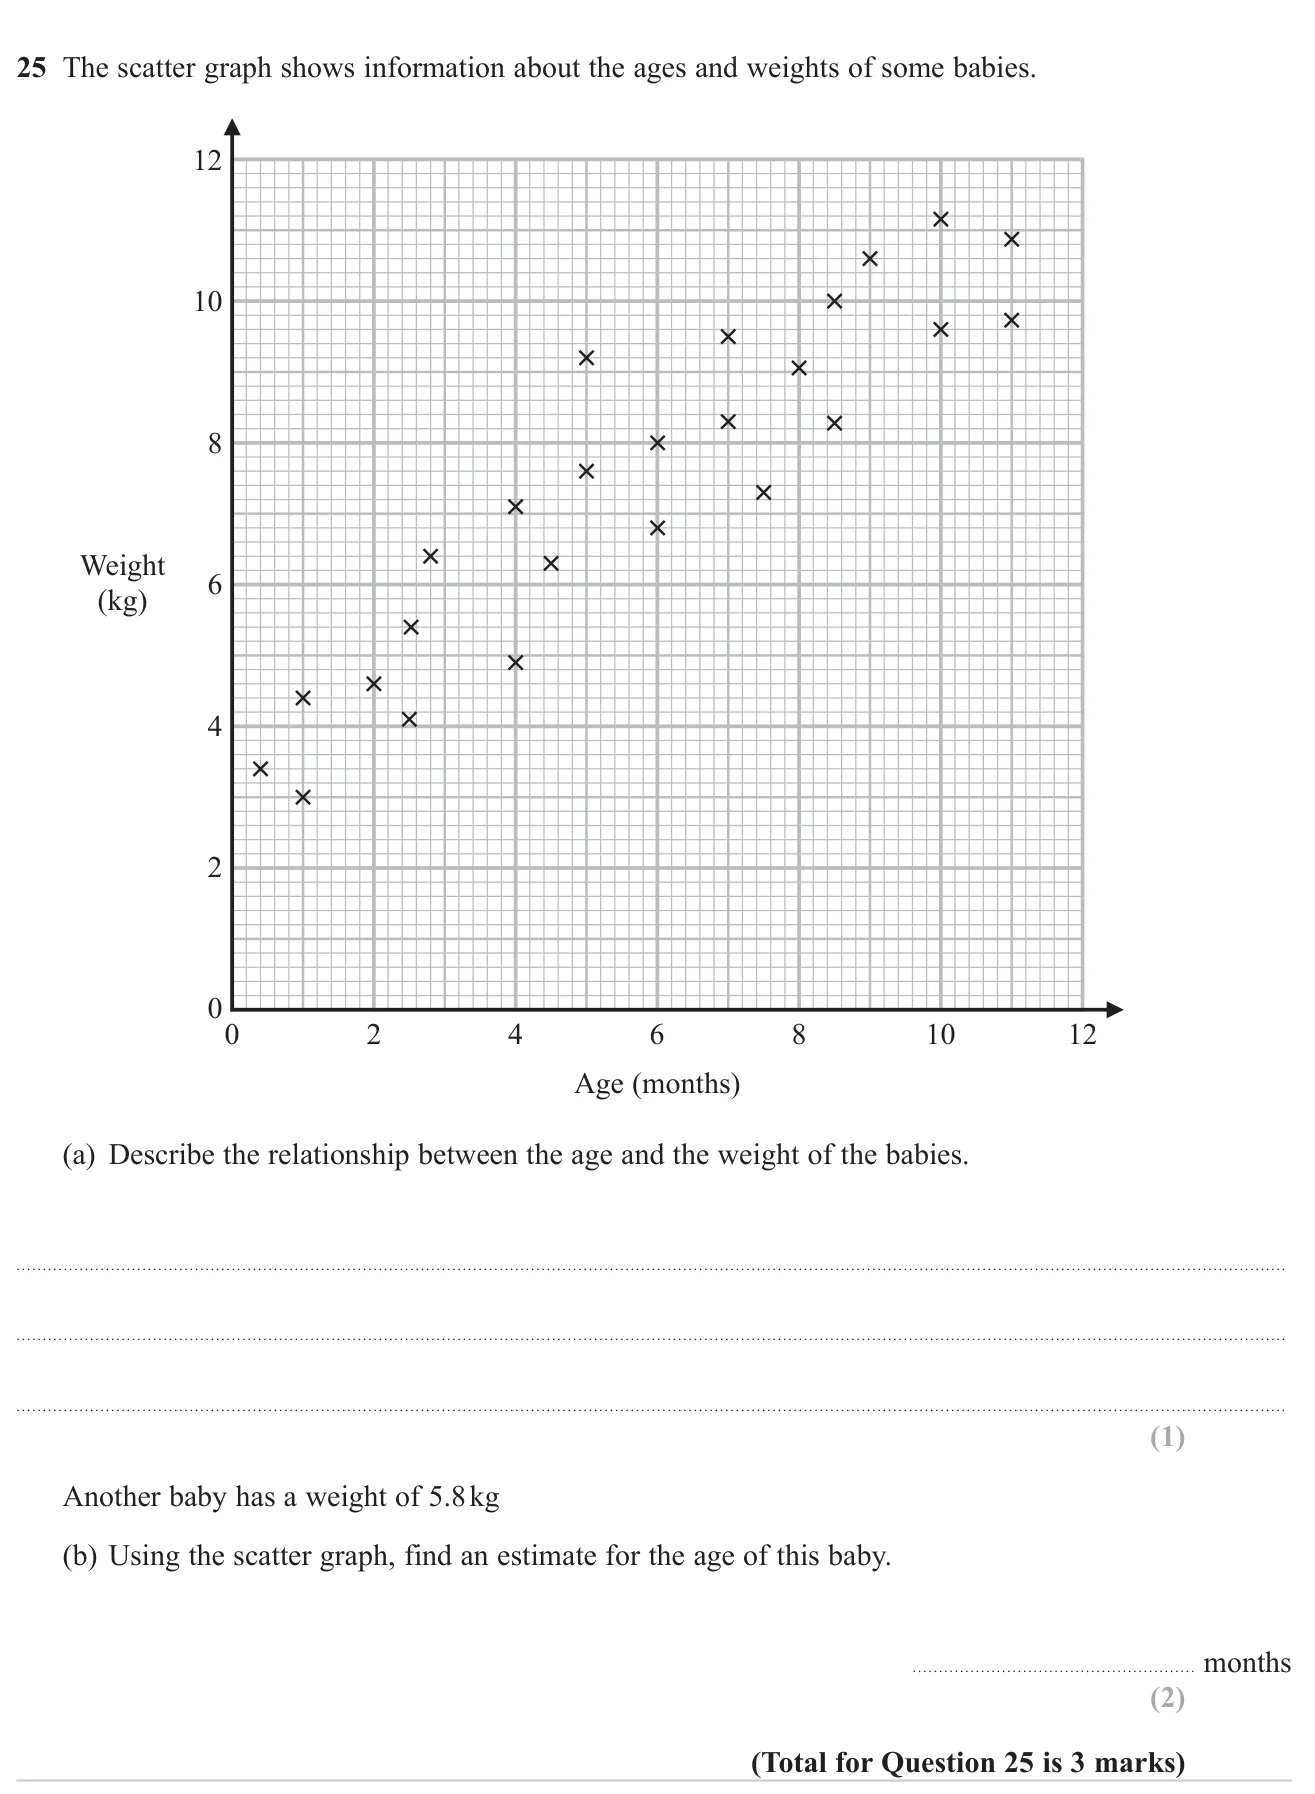
Scatter graphs and correlation3 marksGrade 4No calculatorOn both tiers
June 2023 · Paper 1 Foundation · Q25
Describe the correlation on a scatter graph and use it to estimate a value.

© Pearson Education Ltd. June 2023 Paper 1 (Foundation, non-calculator), question 25.

Show answer
(a)Positive correlation: older babies tend to weigh more1 mark
(b)About 3.5 months (accept 2.5 to 4.5)2 marks

Worked solution Checked against the mark scheme

(a) As age increases, weight increases: positive correlation.

(b) Draw a line of best fit. Go across from 5.8 kg to the line, then down to the age axis.

This gives about 3.5 months.

Watch out: In (a), writing just 'positive' without saying correlation or describing the trend.

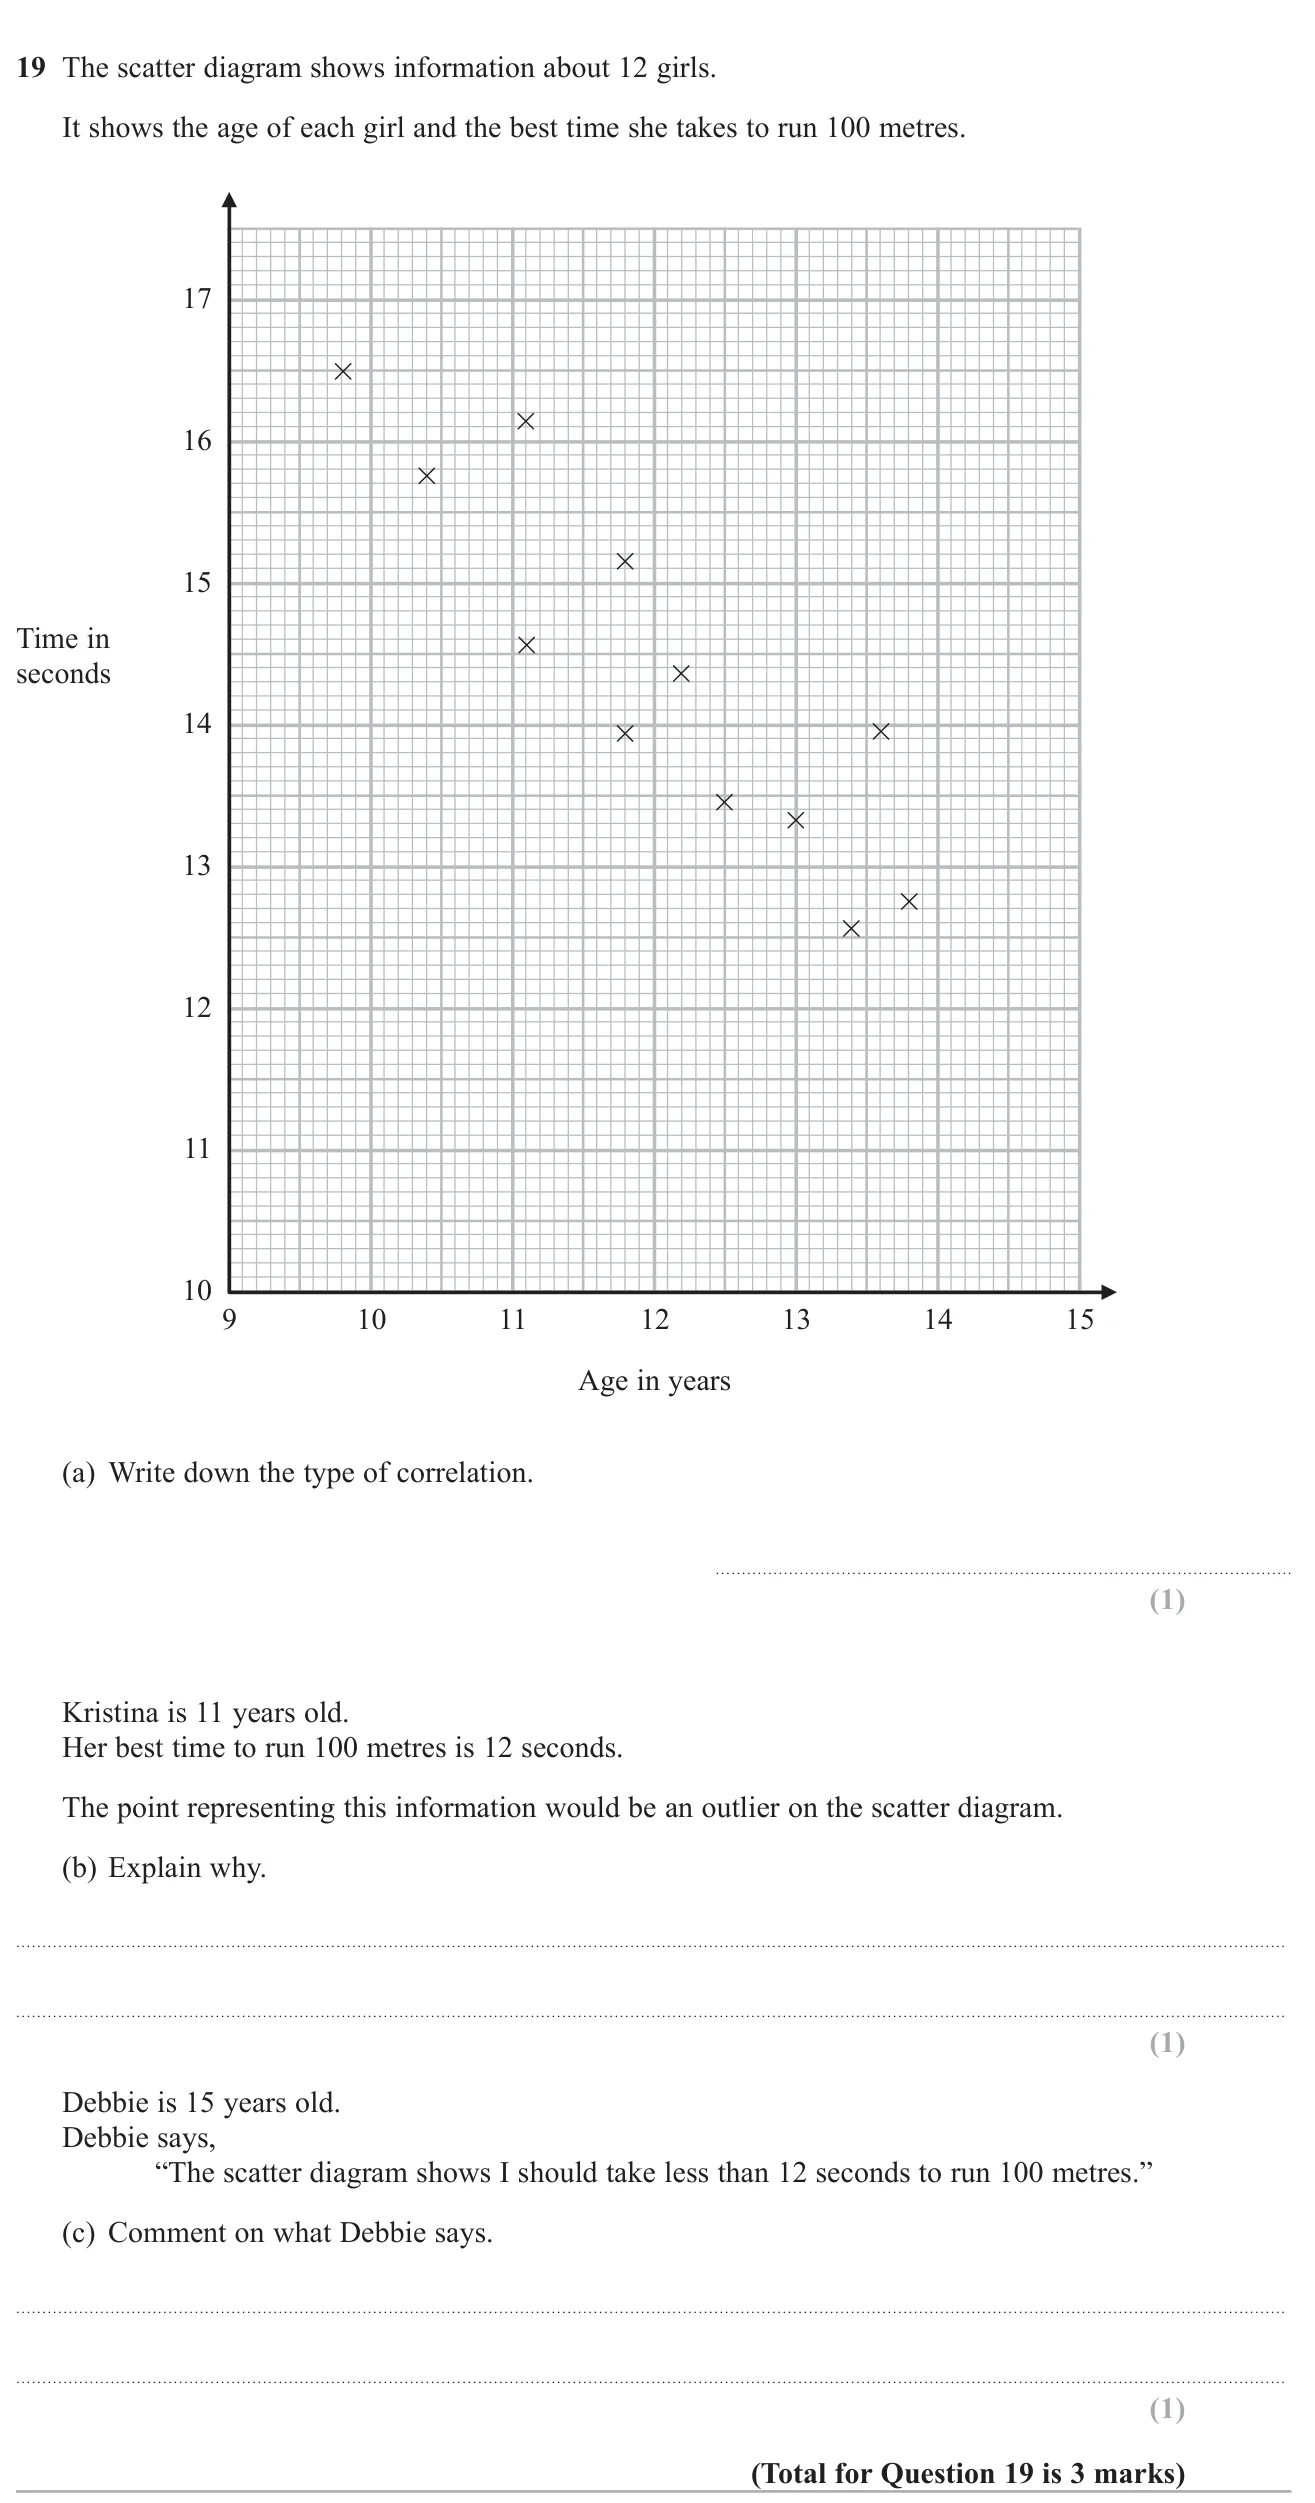
Scatter graphs and correlation3 marksGrade 4CalculatorOn both tiers
June 2018 · Paper 3 Foundation · Q19
Describe correlation on a scatter graph, explain an outlier, and comment on extrapolating beyond the data.

© Pearson Education Ltd. June 2018 Paper 3 (Foundation, calculator), question 19.

Show answer
(a)Negative1 mark
(b)It does not follow the trend; it is far from the other points1 mark
(c)Age 15 is outside the range of the data, so the graph cannot be used to predict her time1 mark

Worked solution Checked against the mark scheme

(a) As age increases, time decreases, so the correlation is negative.

(b) An 11-year-old's times on the graph are about 14.5 to 16 seconds; 12 seconds is far faster than the trend suggests.

(c) The oldest girl on the graph is under 14, so predicting for 15 means going beyond the data, which is unreliable.

Watch out: Saying 'positive' because the numbers on both axes go up.

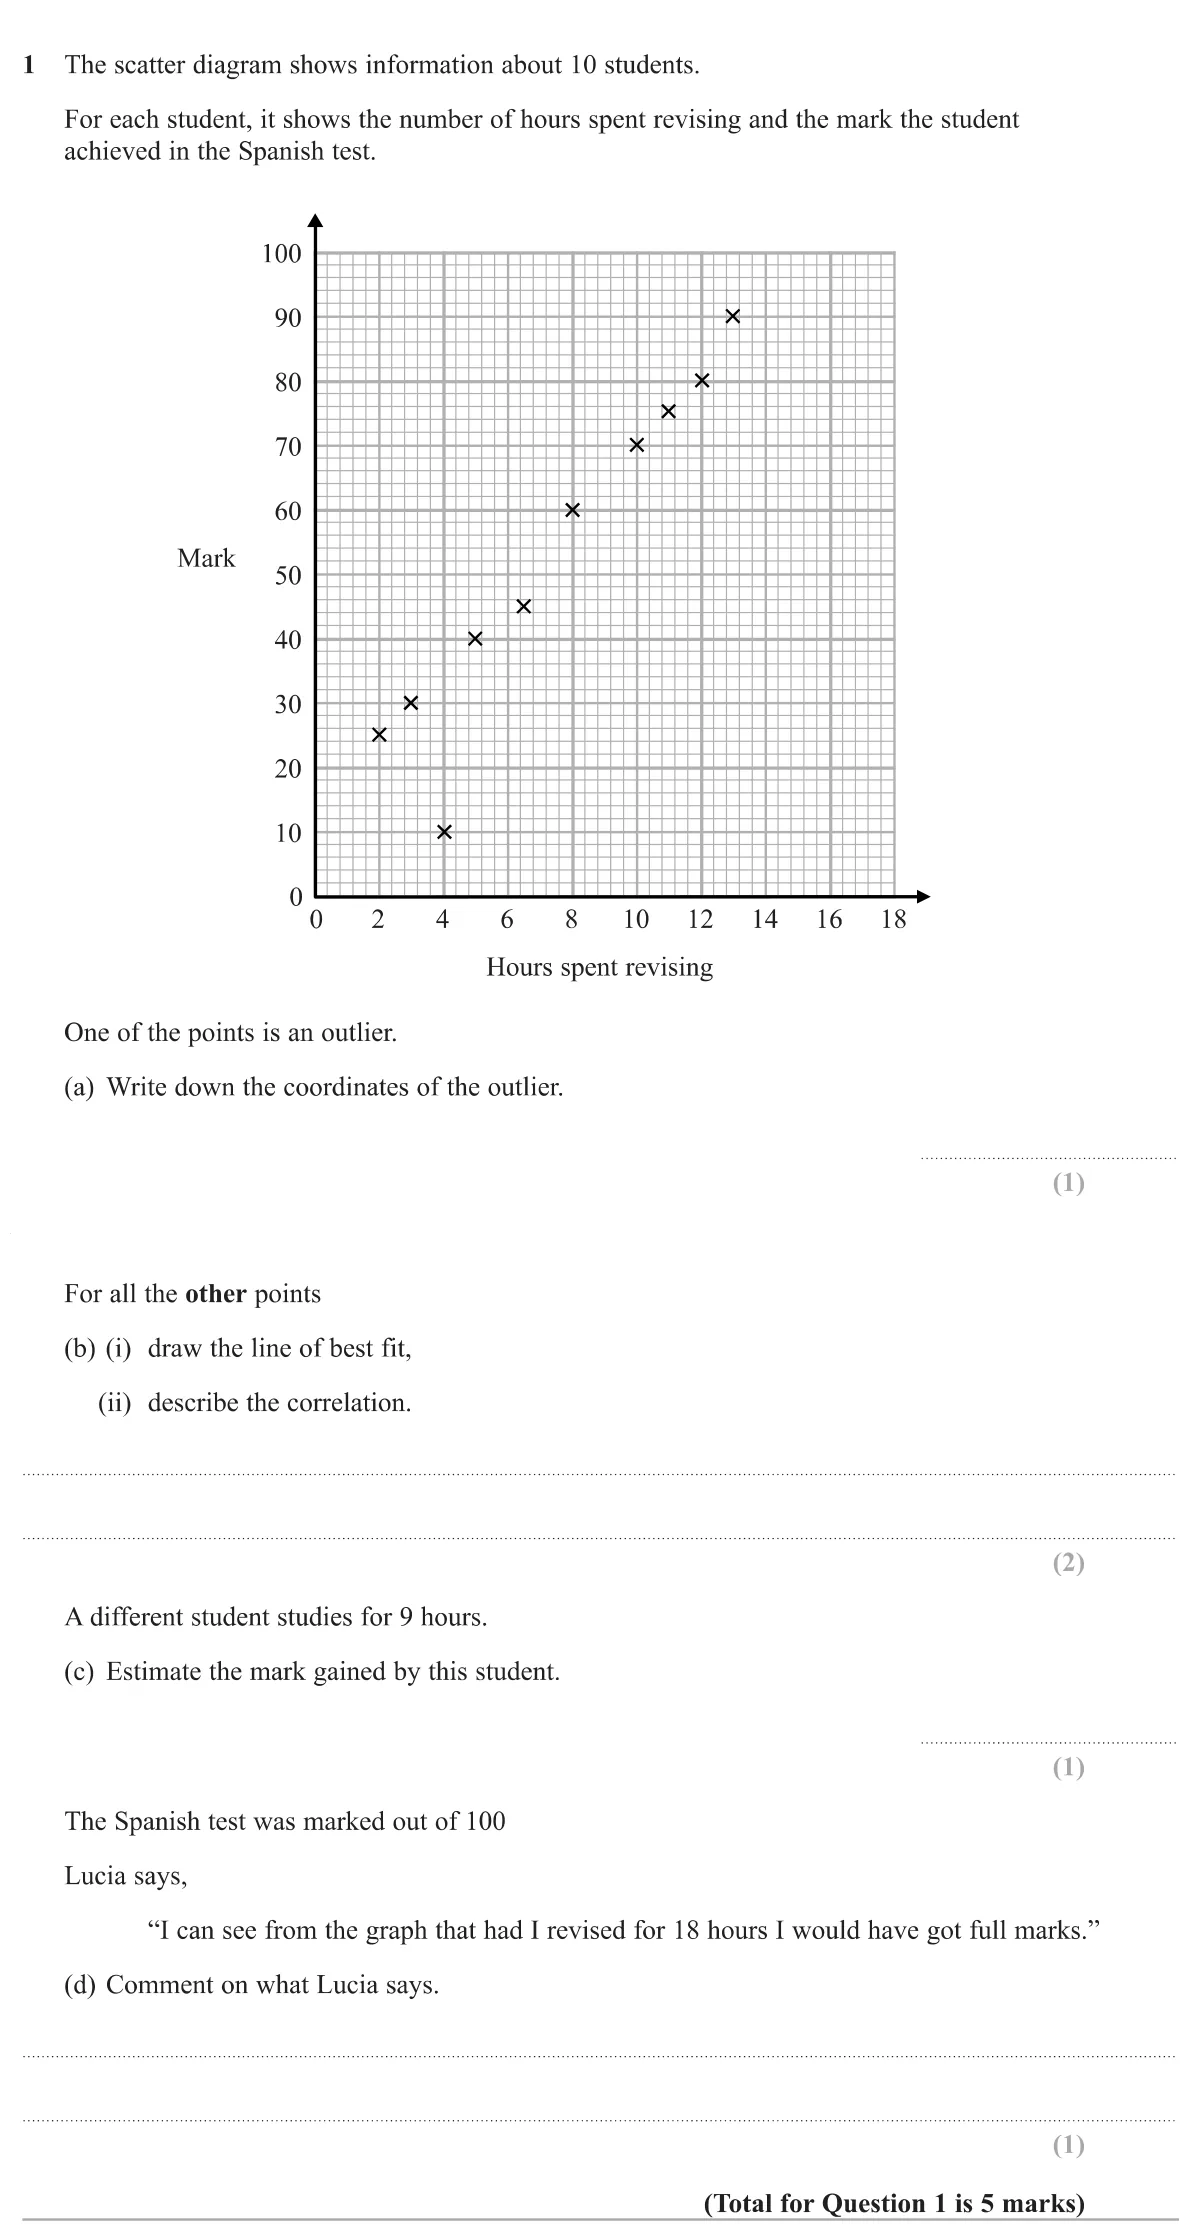
Scatter graphs and correlation5 marksGrade 4CalculatorHigher
Specimen · Paper 3 Higher · Q1
Use a scatter graph of revision hours against test marks to spot an outlier, draw a line of best fit, describe the correlation, make an estimate and comment on extrapolation.

© Pearson Education Ltd. Specimen Paper 3 (Higher, calculator), question 1.

Show answer
(a)(4,10)(4, 10)1 mark
(b(i))A straight line of best fit through the other nine points1 mark
(b(ii))Positive correlation1 mark
(c)A value from 60 to 701 mark
(d)She cannot be sure: 18 hours is outside the range of the data, so the line should not be extended that far1 mark

Worked solution Checked against the mark scheme

(a) The point at 4 hours with a mark of 10 is far below the pattern of the rest: (4,10)(4, 10).

(b) Ignore the outlier and draw one straight line through the middle of the other points, e.g. from about (2,22)(2, 22) to (13,86)(13, 86). As hours go up, marks go up: positive correlation.

(c) Go up from 9 hours to your line and across: about 65.

(d) The data only goes up to about 13 hours. Extending the line to 18 hours is extrapolation, so the prediction is unreliable (and marks can't keep rising past 100).

Watch out: Including the outlier when drawing the line of best fit, which drags it down.