Statistics

Box plots

11 past-paper questions, easiest first. Try each one, then reveal the answer.

Higher only

Revision guide by The Full Marks

Box plots: what you need to know

A box plot shows five key values of a data set: lowest, lower quartile, median, upper quartile and highest. It is the quickest way to compare two distributions, which is exactly what Higher questions ask for.

Key facts

  • The box runs from the lower quartile (LQ) to the upper quartile (UQ), with a line at the median.
  • The whiskers go out to the lowest and highest values.
  • For nn ordered values: LQ is the n+14\frac{n+1}{4}th value and UQ is the 3(n+1)4\frac{3(n+1)}{4}th value.
  • From a cumulative frequency graph with total nn, read across from n4\frac{n}{4}, n2\frac{n}{2} and 3n4\frac{3n}{4} on the cumulative frequency axis to get the LQ, median and UQ.
  • 25% of the data lies in each section: below LQ, LQ to median, median to UQ, above UQ. So 50% lies in the box and 75% lies below the UQ.
  • IQR = UQ − LQ: the length of the box.

Drawing a box plot

  1. Put the data in order (a stem and leaf diagram is already in order).
  2. Find the lowest, LQ, median, UQ and highest values. If you are given the IQR or range instead, work back: UQ = LQ + IQR, highest = lowest + range.
  3. Draw the box from LQ to UQ on the scale given, with a vertical line at the median.
  4. Add whiskers to the lowest and highest values.

Comparing box plots

  1. Compare the medians: say which is higher and what that means, e.g. 'Class B scored higher on average'.
  2. Compare the IQRs (the box lengths): the smaller IQR means more consistent data.
  3. Each comparison must say which is bigger or smaller, not just quote both values.

Worked examples

Example 1 Higher · grade 5

Find the five values needed for a box plot: 4, 6, 7, 9, 10, 12, 13, 15, 17, 18, 22.

Show the solution

There are 11 values, already in order.
Median = 6th value = 12
LQ = 3rd value = 7
UQ = 9th value = 17
Lowest = 4, highest = 22
IQR = 17 − 7 = 10

Example 2 Higher · grade 6

Test scores for two classes: Class A median 54, IQR 18. Class B median 61, IQR 9, upper quartile 68. (a) Compare the scores. (b) Class B has 32 students. Estimate how many scored more than 68.

Show the solution

(a) Class B's median is higher, so Class B did better on average.
Class B's IQR is smaller, so their scores were more consistent.
(b) 25% score above the upper quartile.
32 ÷ 4 = 8 students

Common mistakes

  • Quoting both medians (e.g. 'A is 54, B is 61') without saying which is higher and what that means.
  • Comparing only the highest or lowest values, such as the longest time. These are single extreme values and say little about the whole group.
  • Reading a cumulative frequency graph at 25, 50 and 75 when the total is not 100. Use a quarter, a half and three quarters of the total.

Exam tips

  • A full comparison needs two sentences: one about the average (median) and one about the spread (IQR), both in context. The IQR is a better measure of spread than the range because extreme values do not affect it.
  • Draw box plots on the scale given and use a ruler for the box and whiskers.

Questions people ask

How do you compare two box plots?

Compare the medians to say which is higher on average, and the interquartile ranges to say which is more consistent. Always link it to the context.

What percentage of data is in the box of a box plot?

The box holds the middle 50% of the data, from the lower quartile to the upper quartile.

Exam questions: Box plots (11, easiest first)

Box plots5 marksGrade 5CalculatorHigher
June 2024 · Paper 3 Higher · Q11
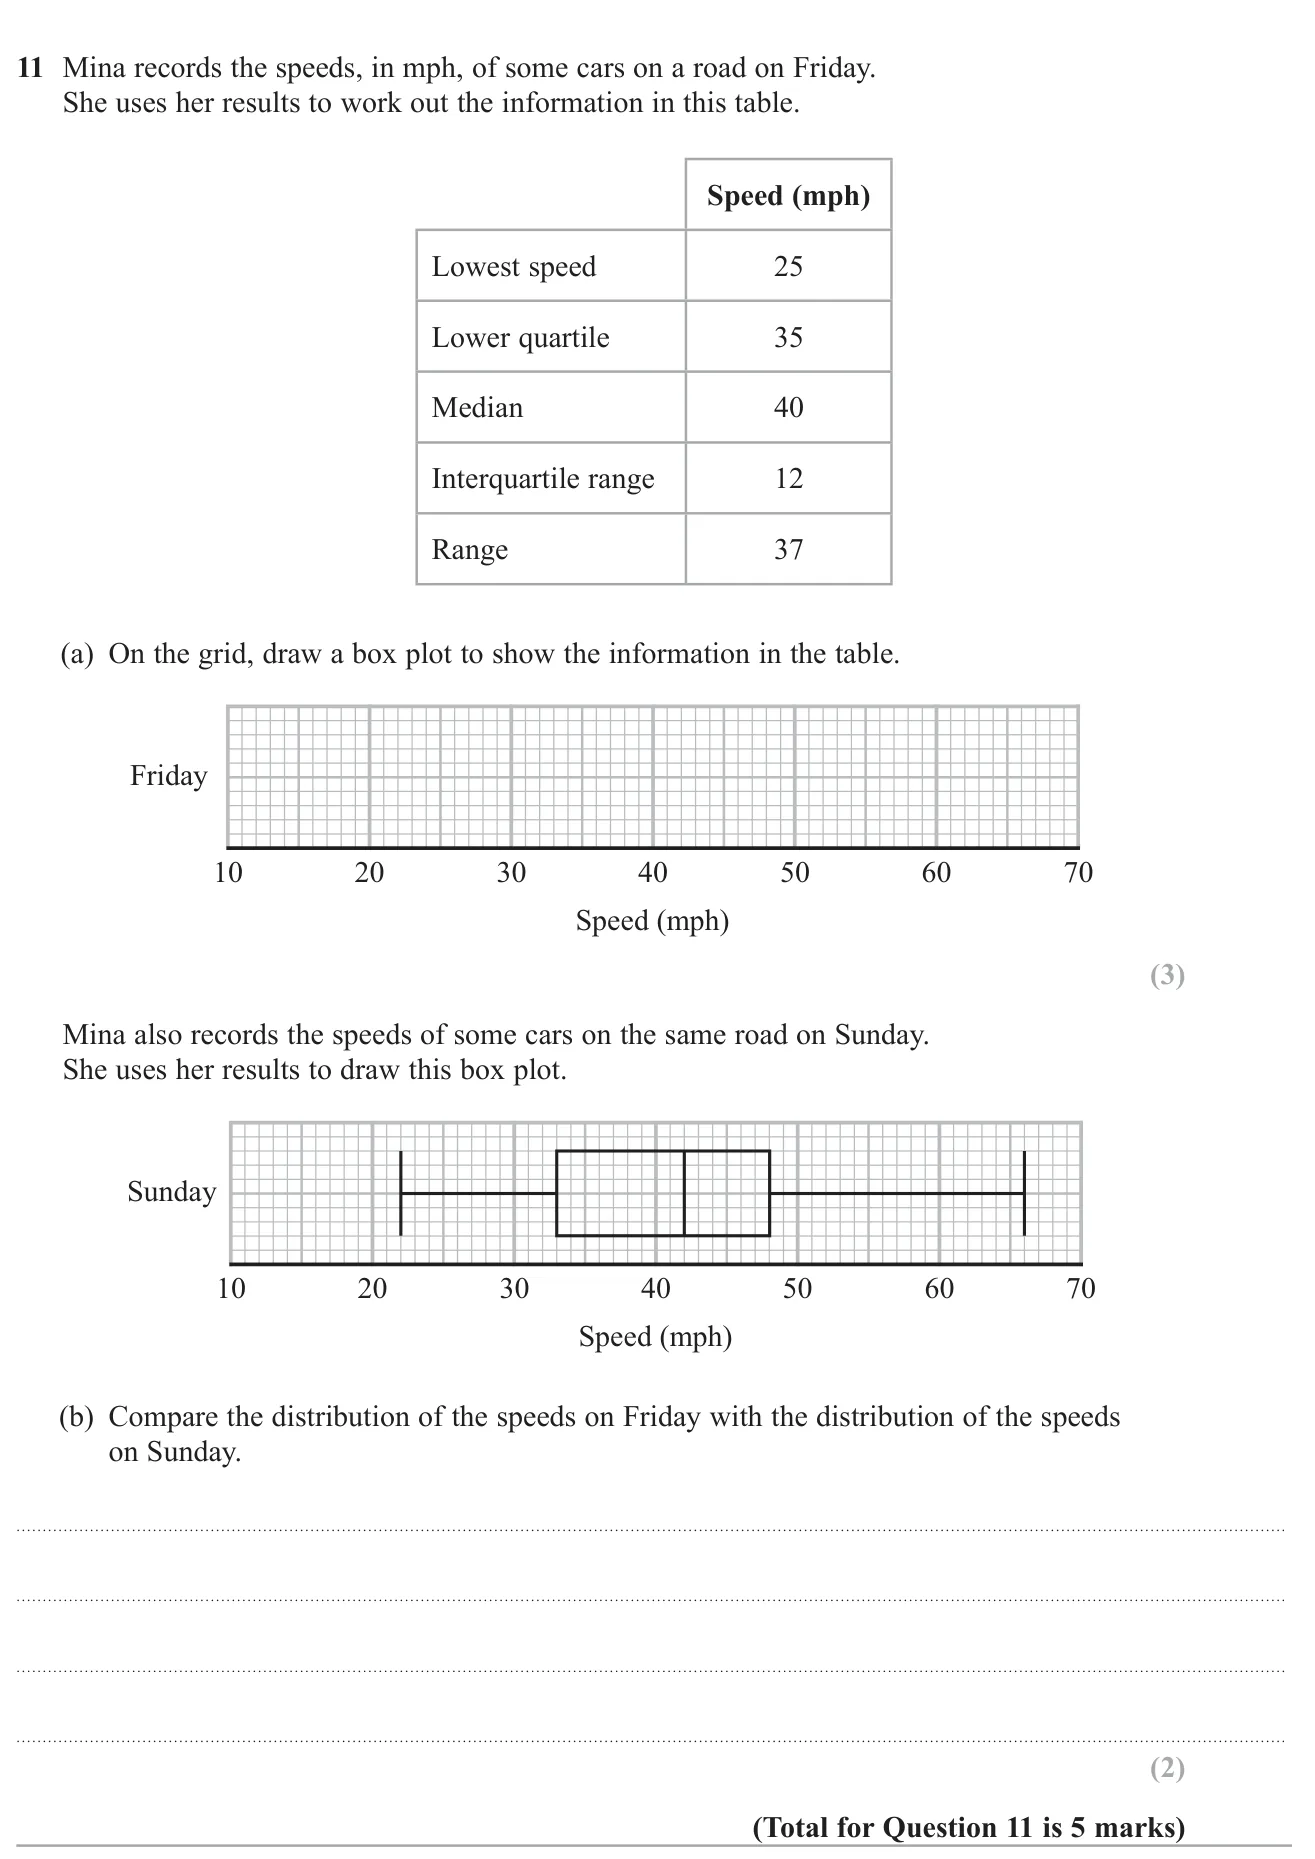
Draw a box plot from summary statistics and compare it with another box plot.

© Pearson Education Ltd. June 2024 Paper 3 (Higher, calculator), question 11.

Show answer
(a)Box plot with minimum 25, LQ 35, median 40, UQ 47, maximum 623 marks
(b)e.g. The median speed on Sunday (42 mph) was higher than on Friday (40 mph); the speeds on Sunday were more spread out (IQR 15 v 12, range 44 v 37)2 marks

Worked solution Checked against the mark scheme

(a) UQ =35+12=47= 35 + 12 = 47; highest =25+37=62= 25 + 37 = 62. Draw the box from 35 to 47 with a line at 40, and whiskers to 25 and 62.

(b) Sunday: median 42, IQR 48−33=1548 - 33 = 15, range 66−22=4466 - 22 = 44.

The median speed was higher on Sunday, so cars were generally faster. The IQR was larger on Sunday, so speeds were more varied.

Watch out: Just quoting values for each day without actually comparing them, or not referring to speed.
Box plots5 marksGrade 5No calculatorHigher
November 2023 · Paper 1 Higher · Q11
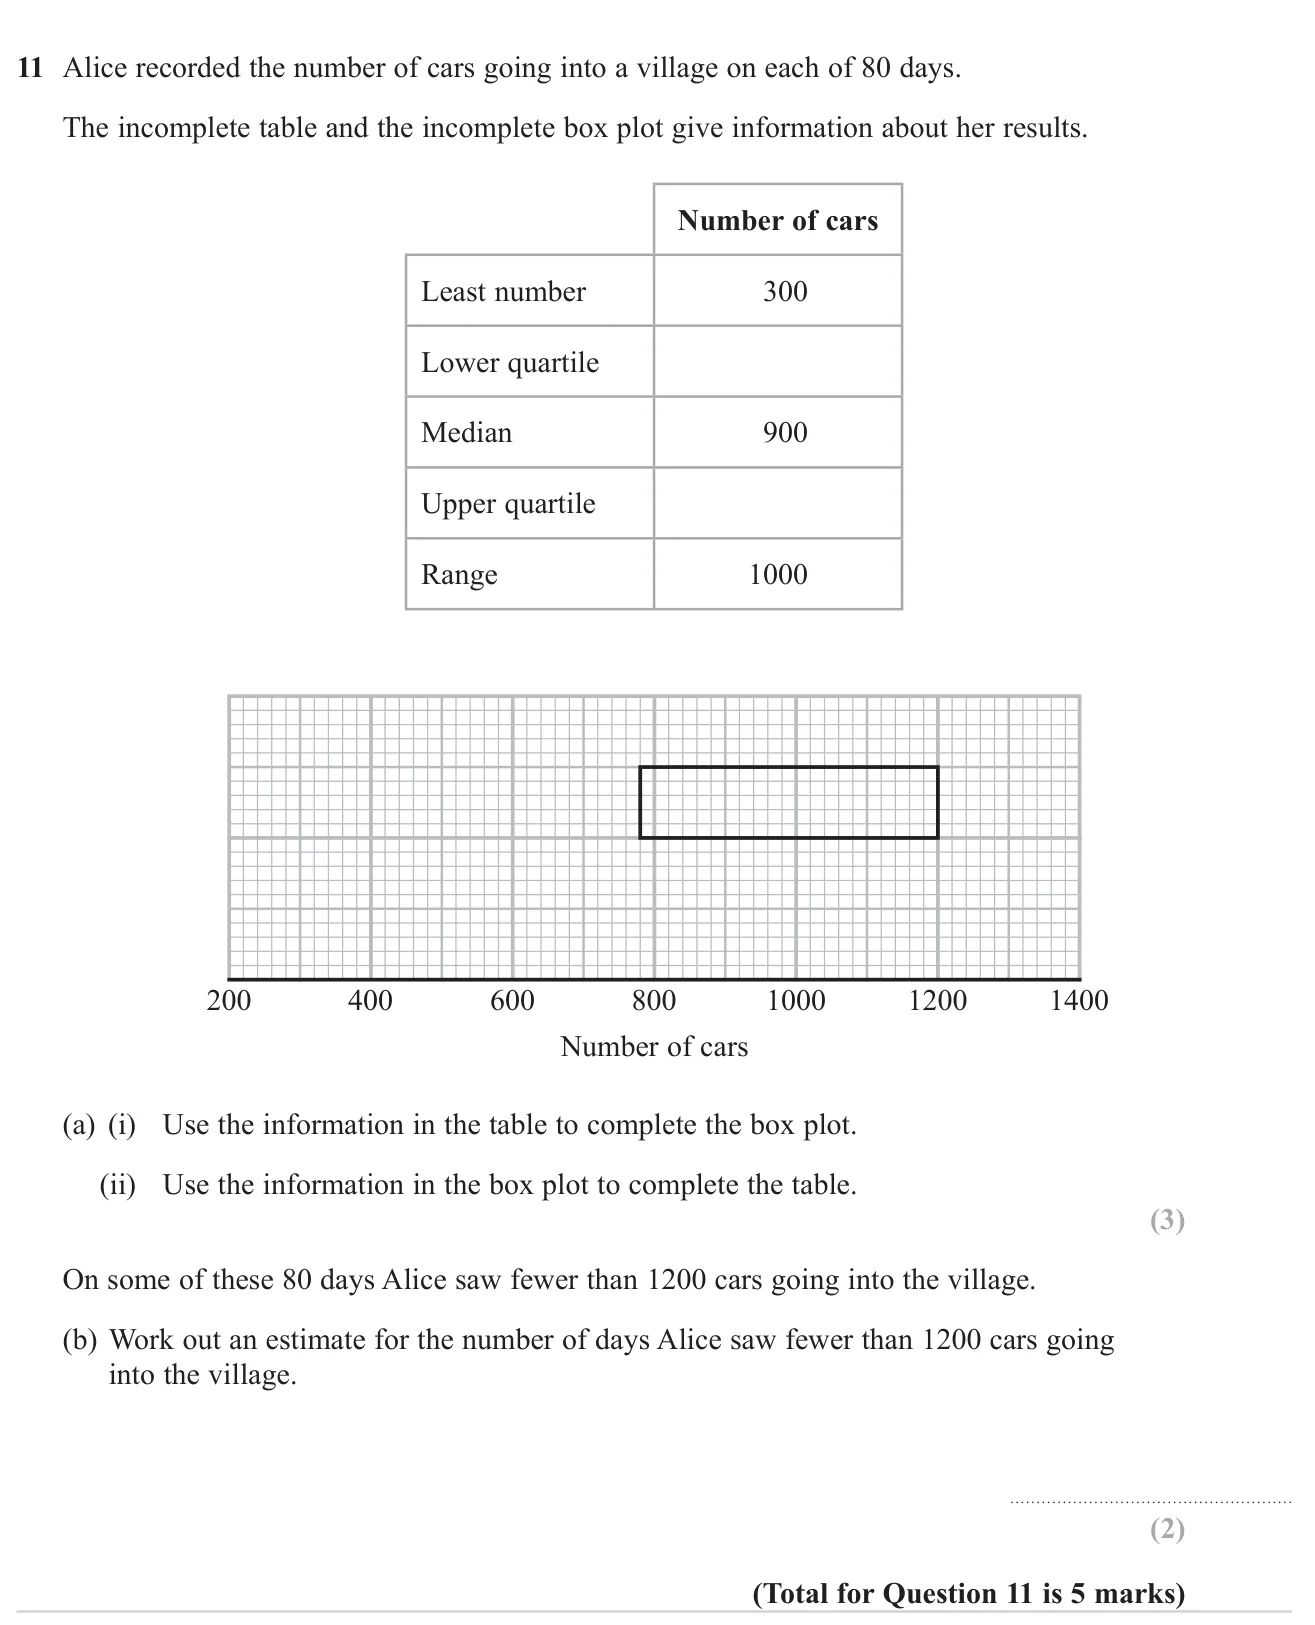
Complete a box plot and its summary table, then use the quartiles to estimate how many of 80 days had fewer than 1200 cars.

© Pearson Education Ltd. November 2023 Paper 1 (Higher, non-calculator), question 11.

Show answer
(a)Box plot: median line at 900, whiskers to 300 and 1300. Table: lower quartile 780, upper quartile 12003 marks
(b)60602 marks

Worked solution Checked against the mark scheme

(a) Greatest value =300+1000=1300= 300 + 1000 = 1300. Draw whiskers from the box to 300 and 1300, and a line in the box at 900.

Reading the box: lower quartile =780= 780, upper quartile =1200= 1200

(b) 1200 is the upper quartile, so about 34\frac{3}{4} of the days were below it: 34×80=60\frac{3}{4} \times 80 = 60

Watch out: Drawing the top whisker to 1000 (the range) instead of 1300.

Box plots5 marksGrade 5CalculatorHigher
June 2023 · Paper 3 Higher · Q11
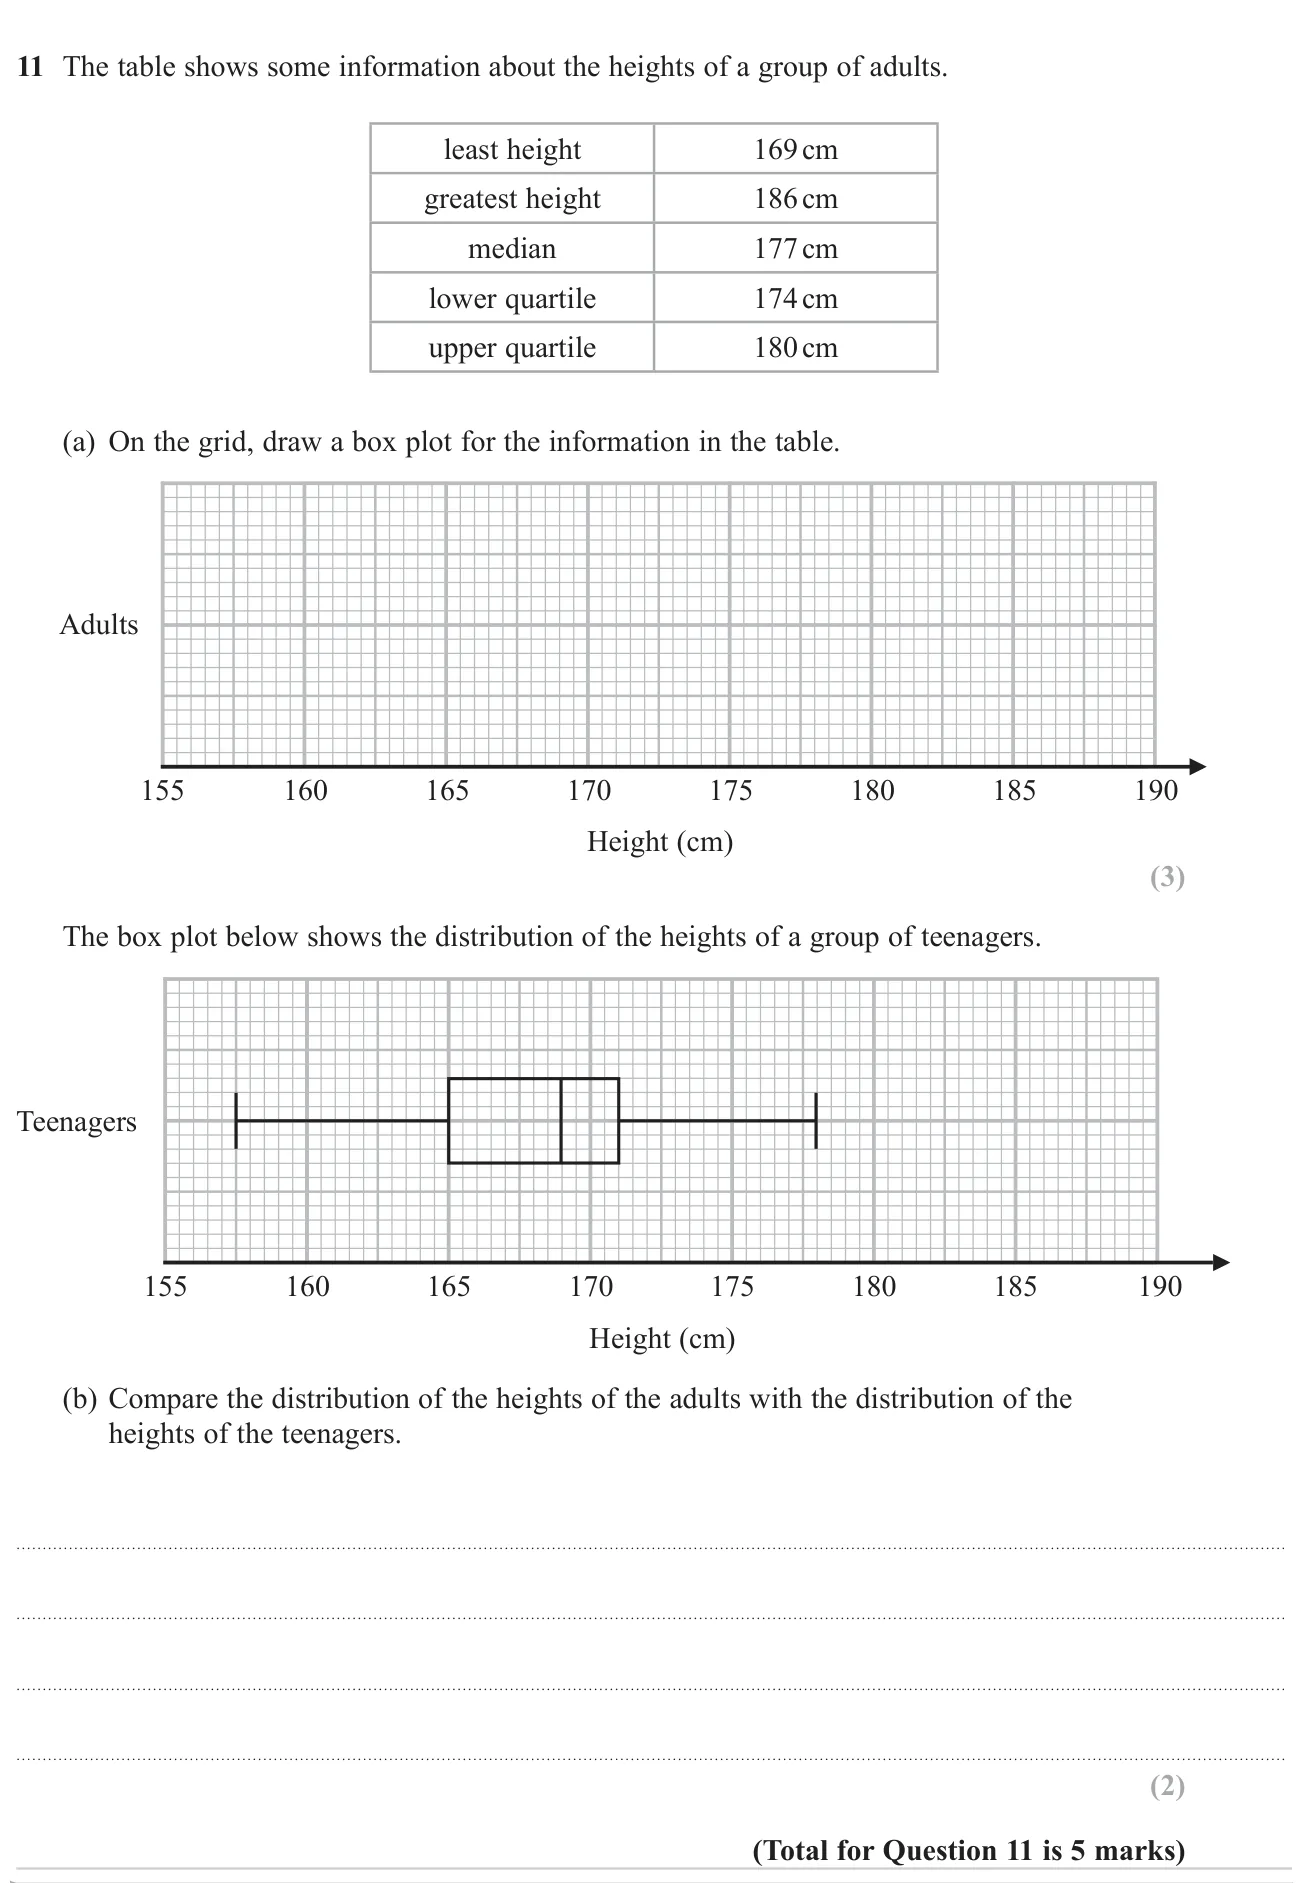
Draw a box plot from five summary values, then compare it with another group's box plot.

© Pearson Education Ltd. June 2023 Paper 3 (Higher, calculator), question 11.

Show answer
(a)Box plot with whiskers from 169 to 186, box from 174 to 180 and median line at 1773 marks
(b)Adults are taller on average (median 177 cm vs 169 cm); the IQRs are the same (6 cm) but the teenagers' range is larger (20.5 cm vs 17 cm)2 marks

Worked solution Checked against the mark scheme

(a) Plot the five values on the scale: whisker from 169 to 174, box from 174 to 180 with a line at 177, whisker from 180 to 186.

(b) Teenagers: median 169, IQR 171−165=6171 - 165 = 6, range 178−157.5=20.5178 - 157.5 = 20.5

Adults: median 177, IQR 180−174=6180 - 174 = 6, range 186−169=17186 - 169 = 17

The adults' median height is greater, so adults are generally taller. Both groups have the same IQR, so the middle half of heights is equally spread.

Watch out: Just quoting the medians and ranges without saying which is bigger, or not mentioning heights.

Box plots5 marksGrade 5CalculatorHigher
June 2022 · Paper 2 Higher · Q10
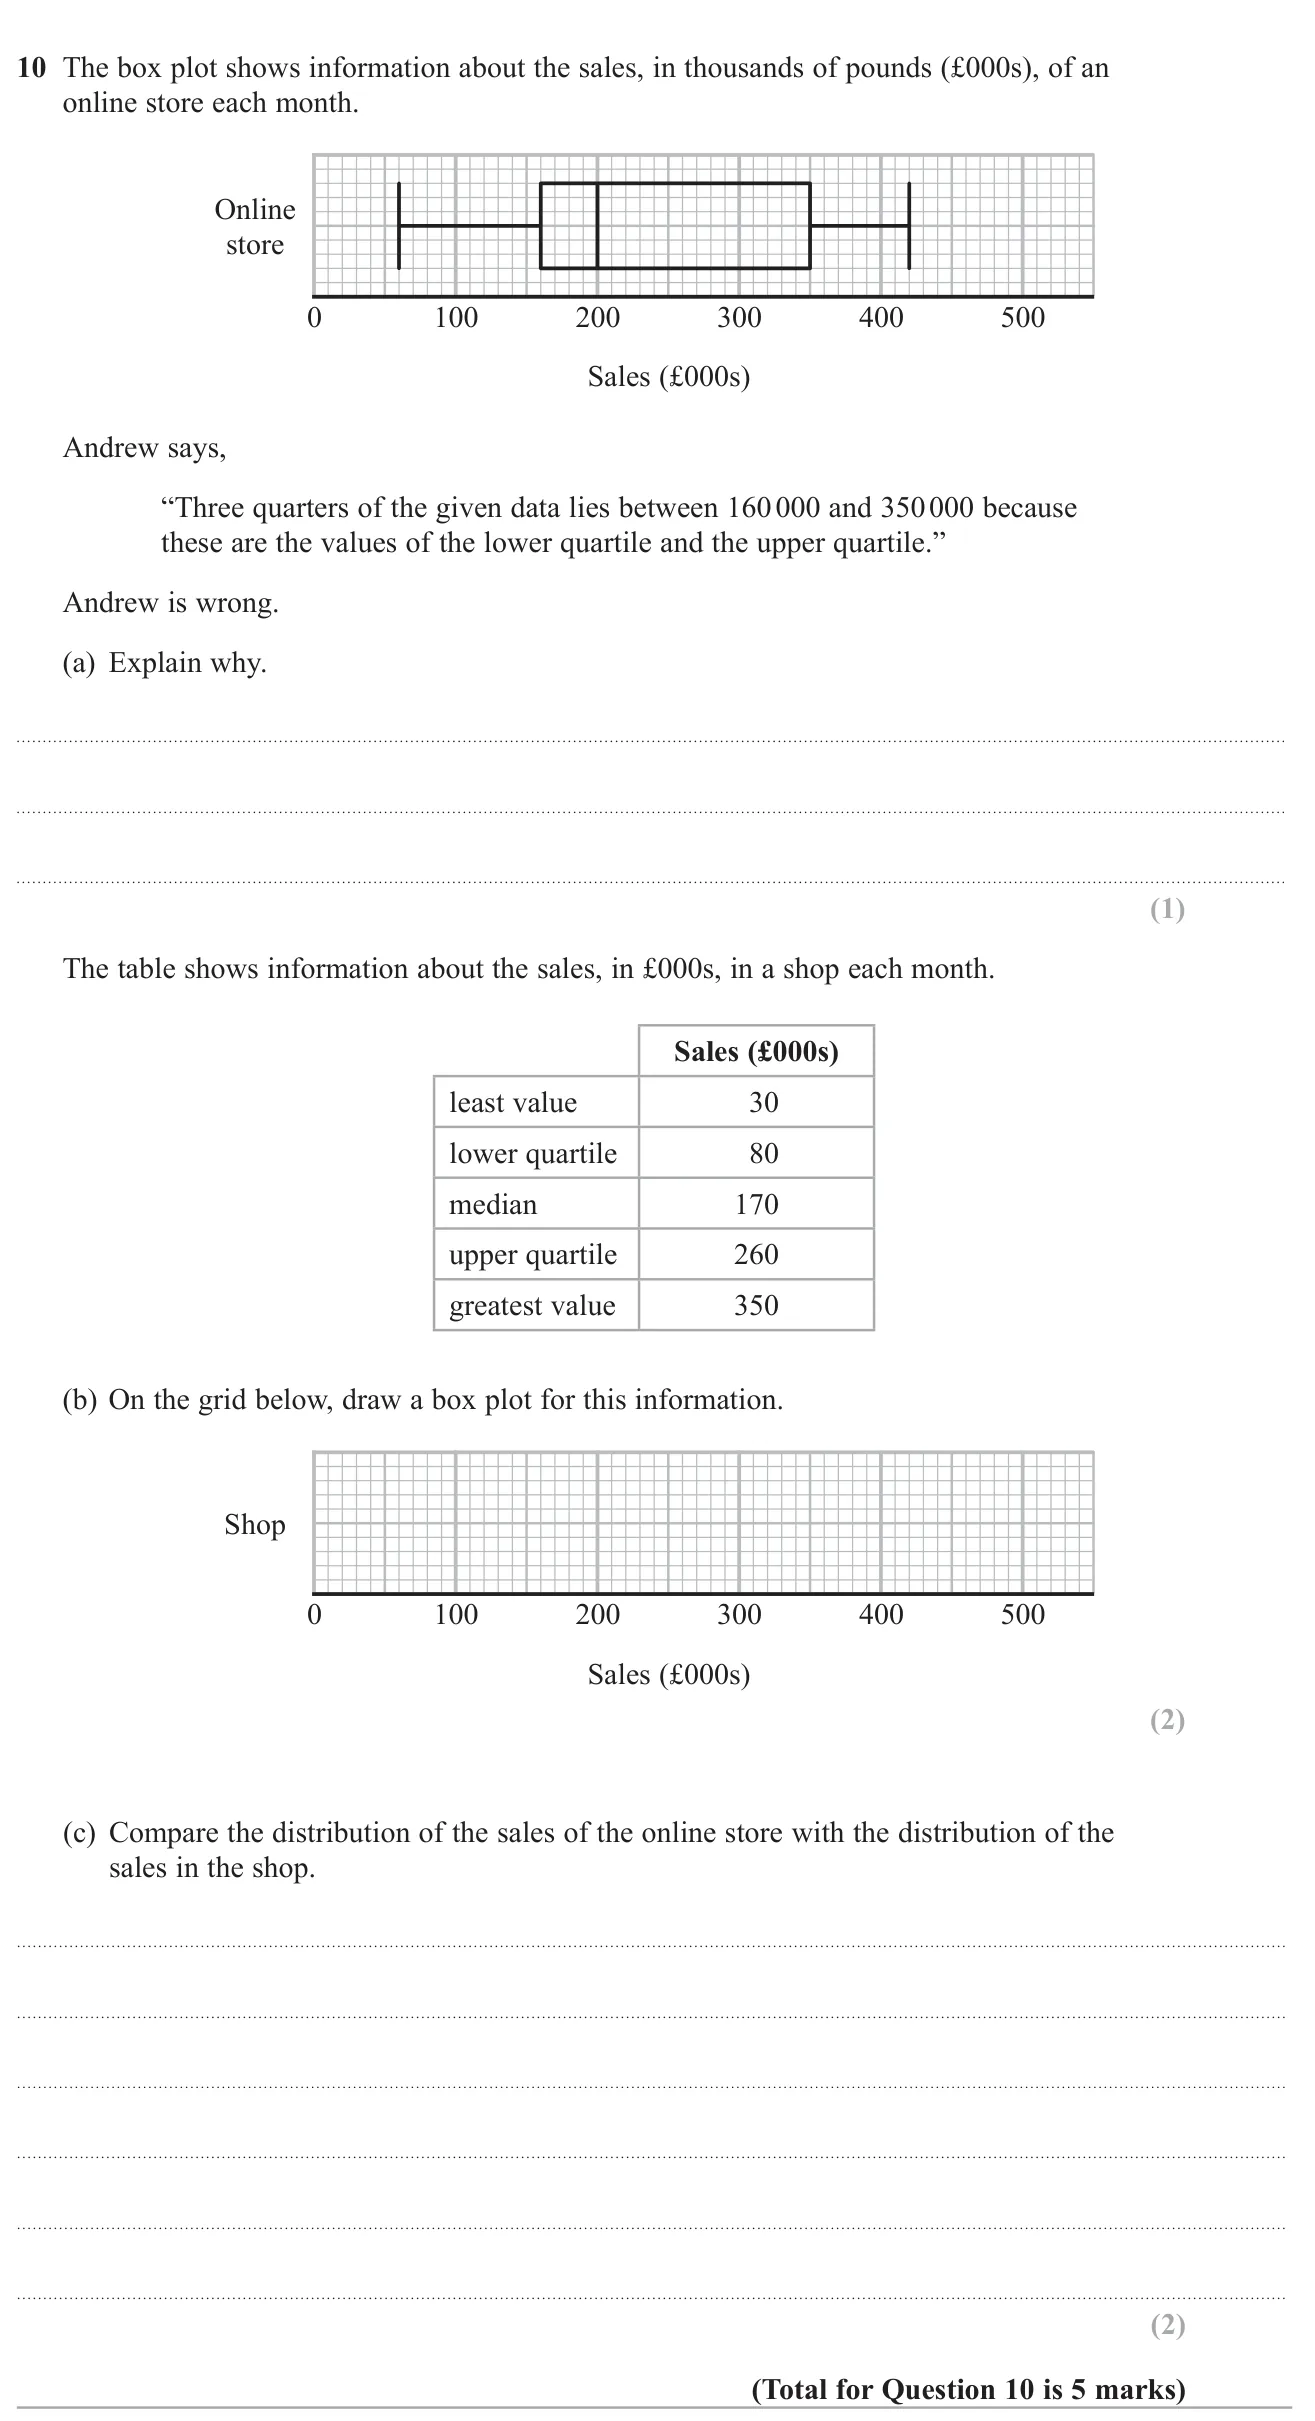
Explain an error about quartiles, draw a box plot from summary values, and compare two sales distributions.

© Pearson Education Ltd. June 2022 Paper 2 (Higher, calculator), question 10.

Show answer
(a)Between the quartiles lies only half of the data, not three quarters1 mark
(b)Box plot with whiskers from 30 to 350, box from 80 to 260, median line at 1702 marks
(c)The online store has a higher median (200 vs 170), so sales are generally higher online; the online store's IQR (190 vs 180) and range (360 vs 320) are larger, so its sales are more varied2 marks

Worked solution Checked against the mark scheme

(a) The lower quartile is at 25% and the upper quartile at 75%, so only 75%−25%=50%75\% - 25\% = 50\% of the data lies between them.

(b) Draw whiskers from 30 to 80 and from 260 to 350, a box from 80 to 260 and a line at 170.

(c) Online: median 200, IQR 350−160=190350 - 160 = 190. Shop: median 170, IQR 260−80=180260 - 80 = 180.

The online median is higher, so it typically sells more each month. The online IQR is bigger, so its monthly sales are less consistent.

Watch out: In (c), stating the medians and IQRs without actually comparing them or saying what they mean.

Box plots4 marksGrade 5CalculatorHigher
November 2021 · Paper 2 Higher · Q9
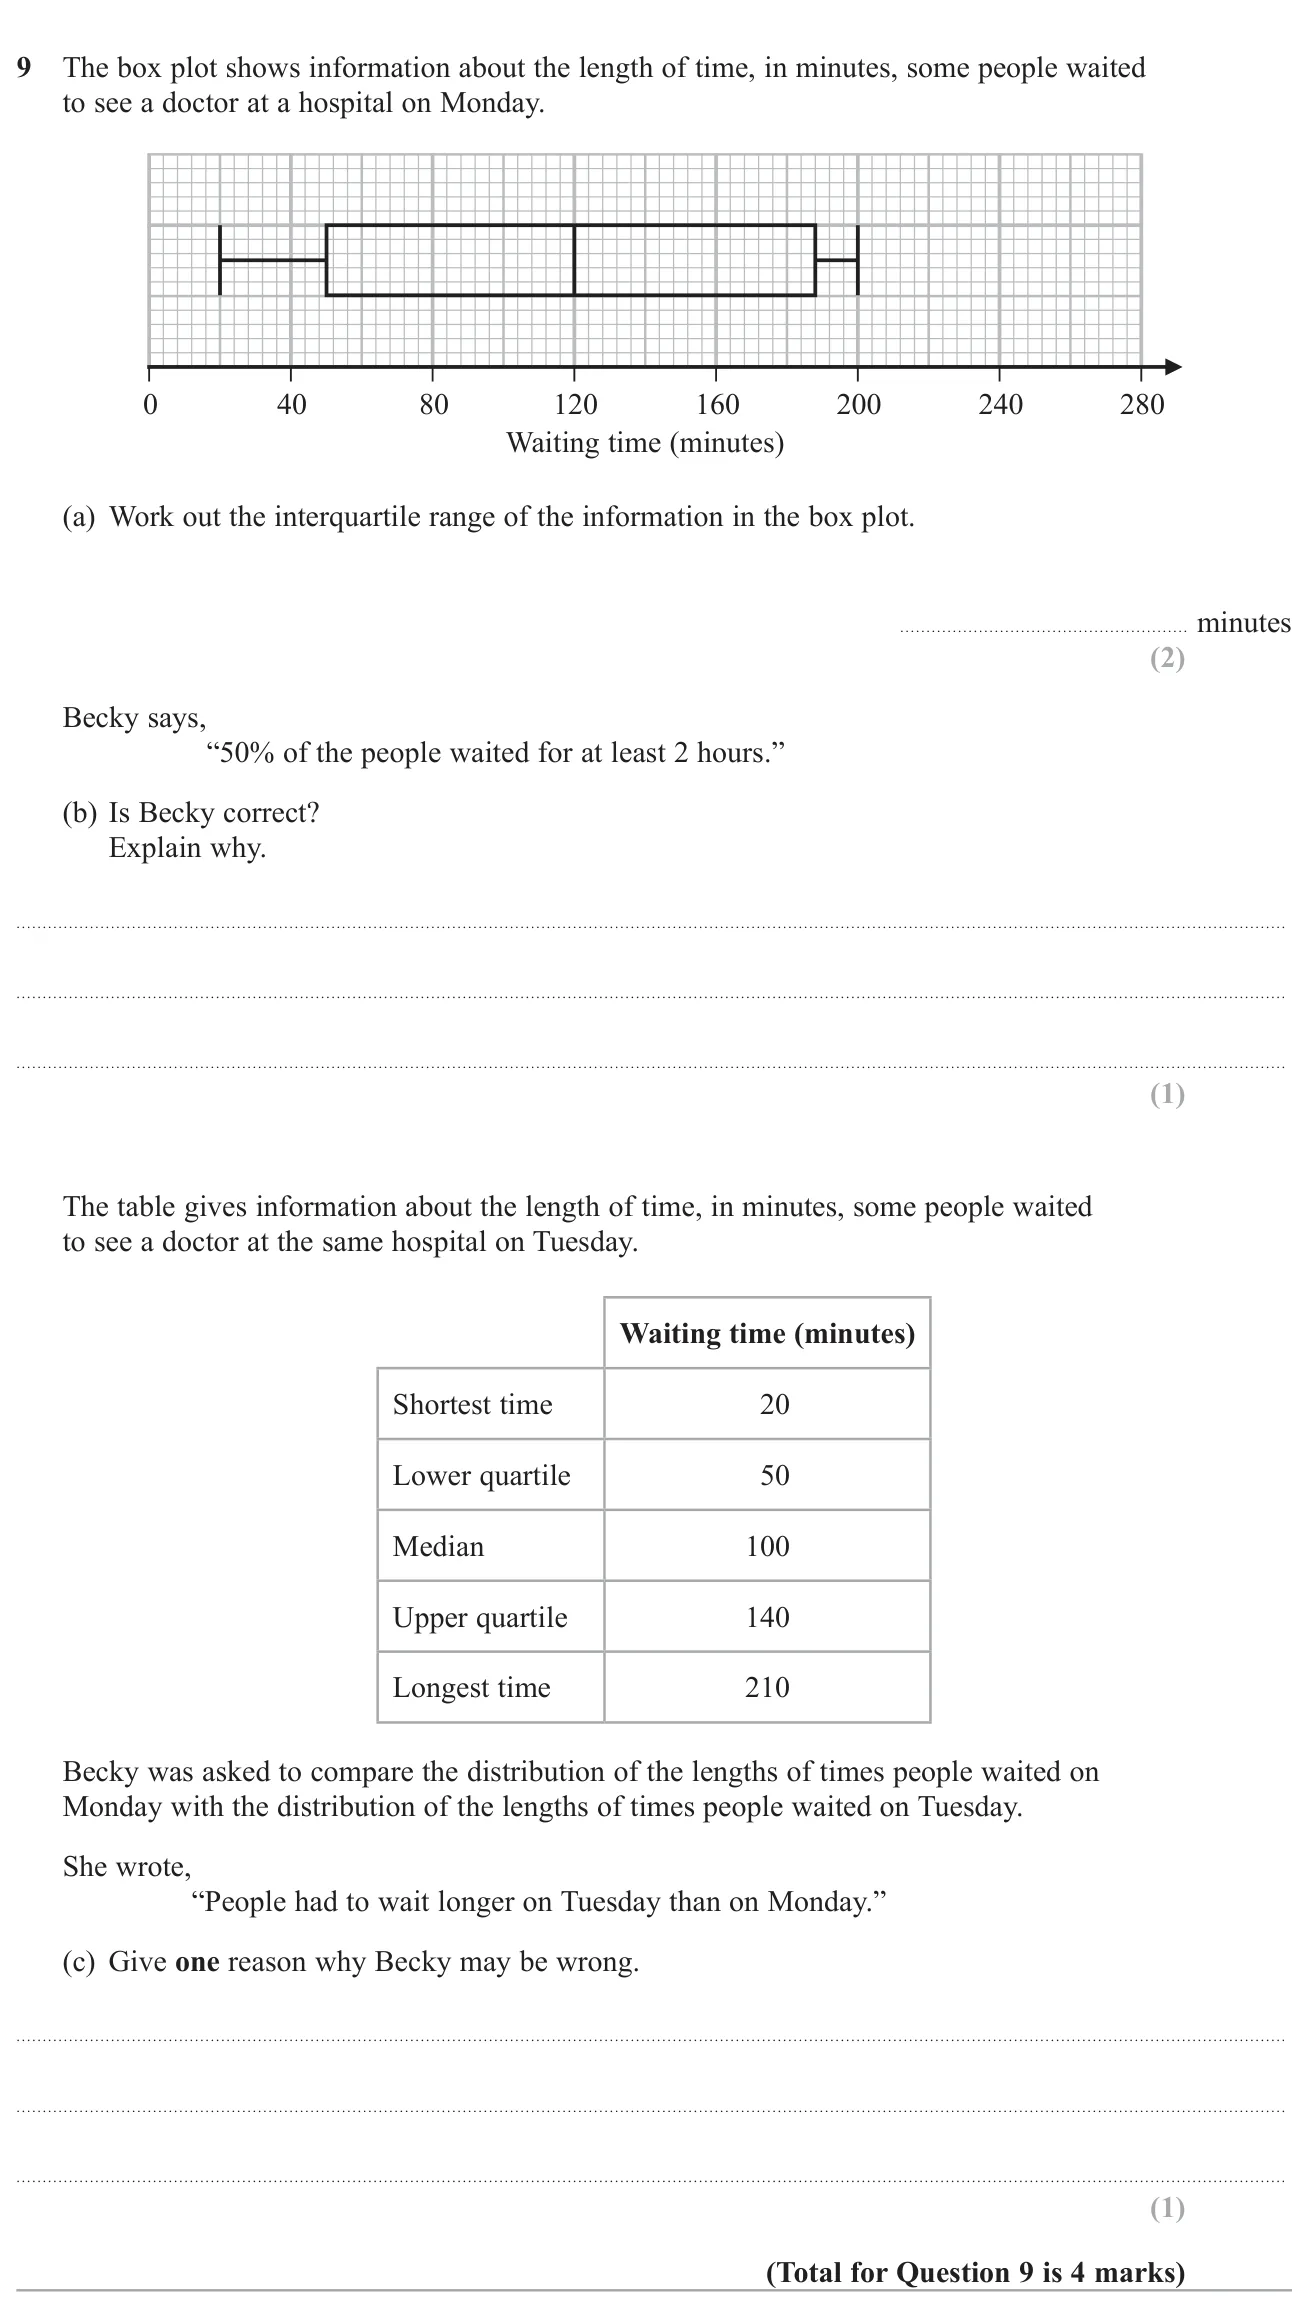
Find the interquartile range from a box plot, judge a claim about the median and criticise a comparison with a second day.

© Pearson Education Ltd. November 2021 Paper 2 (Higher, calculator), question 9.

Show answer
(a)138138 minutes2 marks
(b)Yes, because the median is 120 minutes (2 hours)1 mark
(c)Tuesday's median (100) is lower than Monday's (120), so typical waits were shorter1 mark

Worked solution Checked against the mark scheme

(a) Upper quartile =188= 188, lower quartile =50= 50.

IQR =188−50=138= 188 - 50 = 138 minutes.

(b) The median is at 120 minutes, which is 2 hours, so half the people waited at least that long. Becky is right.

(c) The median on Tuesday is 100 minutes, lower than 120 on Monday, so on average people waited less on Tuesday.

Watch out: Comparing only the longest times (210 vs 200) and agreeing with Becky.

Box plots5 marksGrade 5No calculatorHigher
June 2018 · Paper 1 Higher · Q10
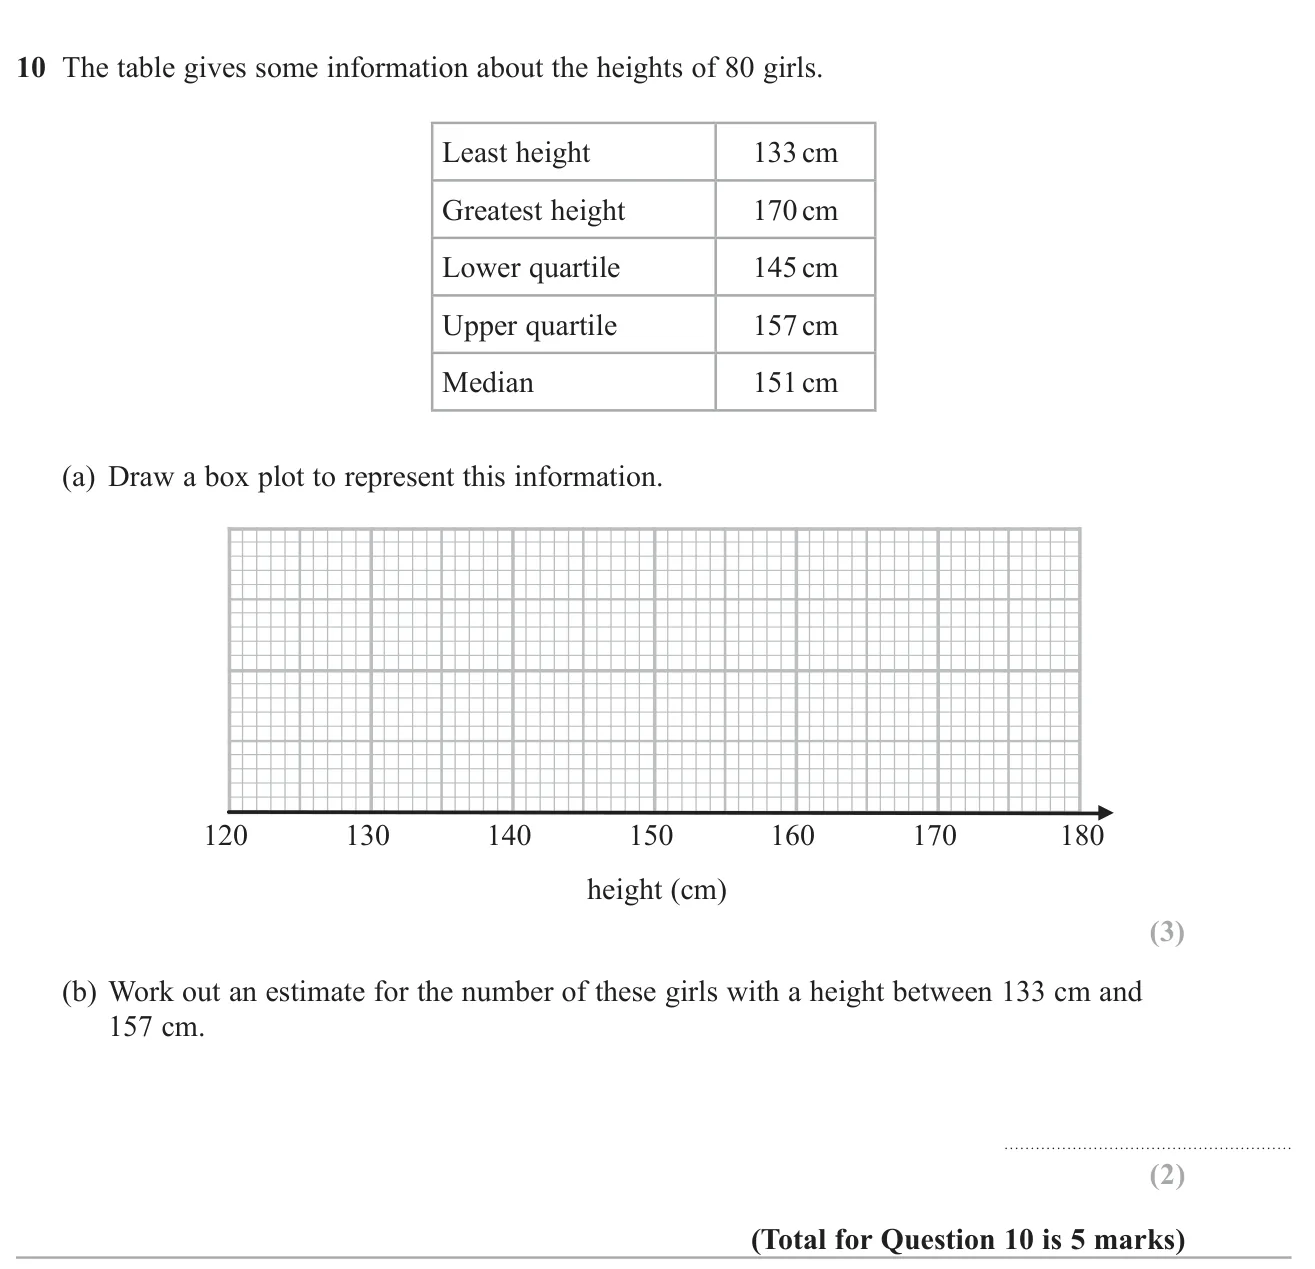
Draw a box plot from five summary values for girls' heights and estimate how many girls lie between the lowest value and the upper quartile.

© Pearson Education Ltd. June 2018 Paper 1 (Higher, non-calculator), question 10.

Show answer
(a)Box plot: whiskers to 133 and 170, box from 145 to 157, median line at 1513 marks
(b)602 marks

Worked solution Checked against the mark scheme

(a) Draw whiskers from 133 to 145 and from 157 to 170; draw a box from 145 to 157 with a line at 151.

(b) From the minimum to the upper quartile covers three quarters of the data.

34×80=60\frac{3}{4} \times 80 = 60 girls

Watch out: In (b), using the heights themselves (157 − 133) instead of the quartile proportions.

Box plots3 marksGrade 6CalculatorHigher
November 2022 · Paper 2 Higher · Q11
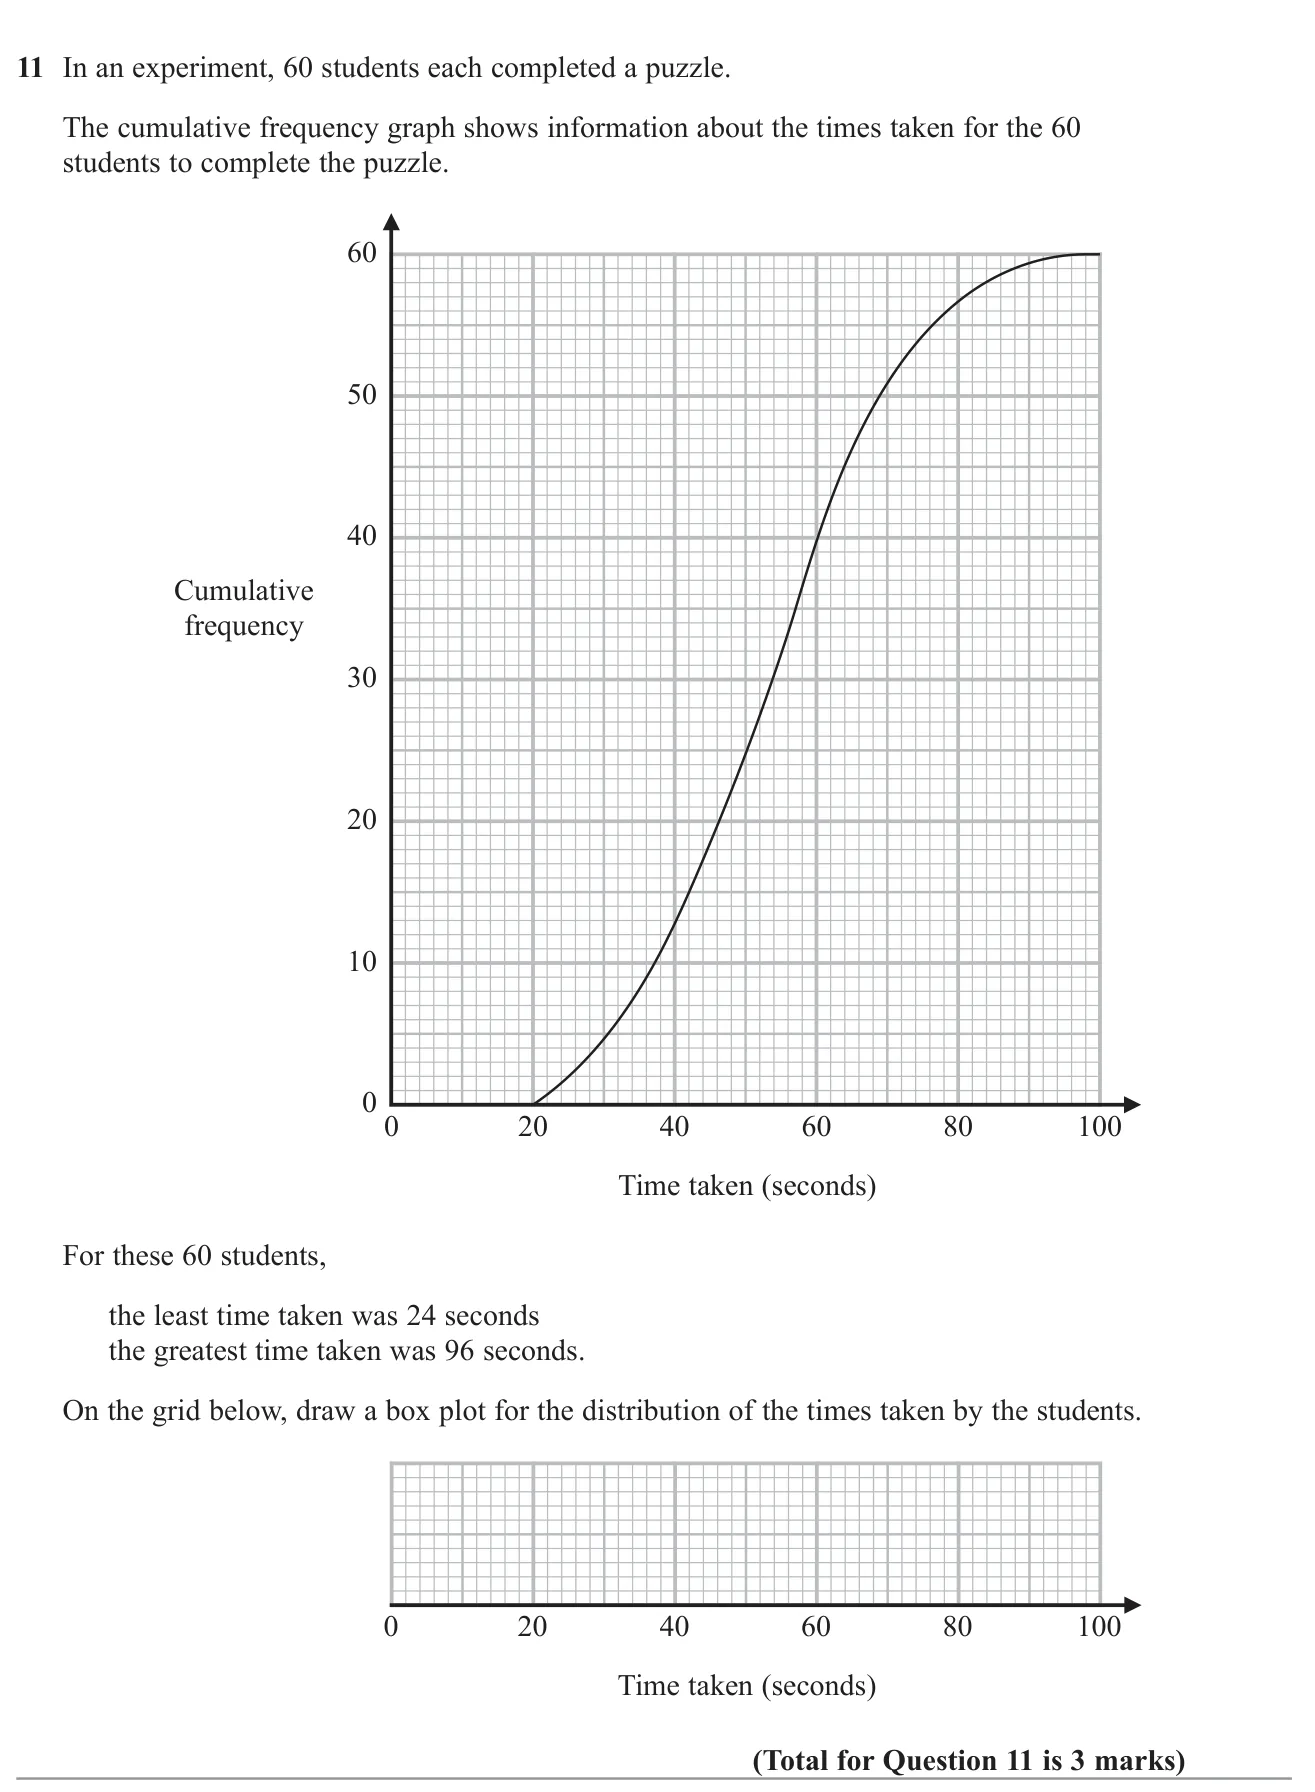
Use a cumulative frequency graph to find the quartiles and median, then draw a box plot.

© Pearson Education Ltd. November 2022 Paper 2 (Higher, calculator), question 11.

Show answer
AnswerBox plot with minimum 24, lower quartile 42, median 54, upper quartile 64, maximum 963 marks

Worked solution Checked against the mark scheme

There are 60 students.

Lower quartile: read across from 15 → 42 s

Median: read across from 30 → 54 s

Upper quartile: read across from 45 → 64 s

Draw the box from 42 to 64 with a line at 54, and whiskers to 24 and 96.

Watch out: Reading the quartiles at cumulative frequencies of 25, 50 and 75 instead of a quarter, half and three quarters of 60.

Box plots2 marksGrade 6CalculatorHigher
November 2020 · Paper 2 Higher · Q9
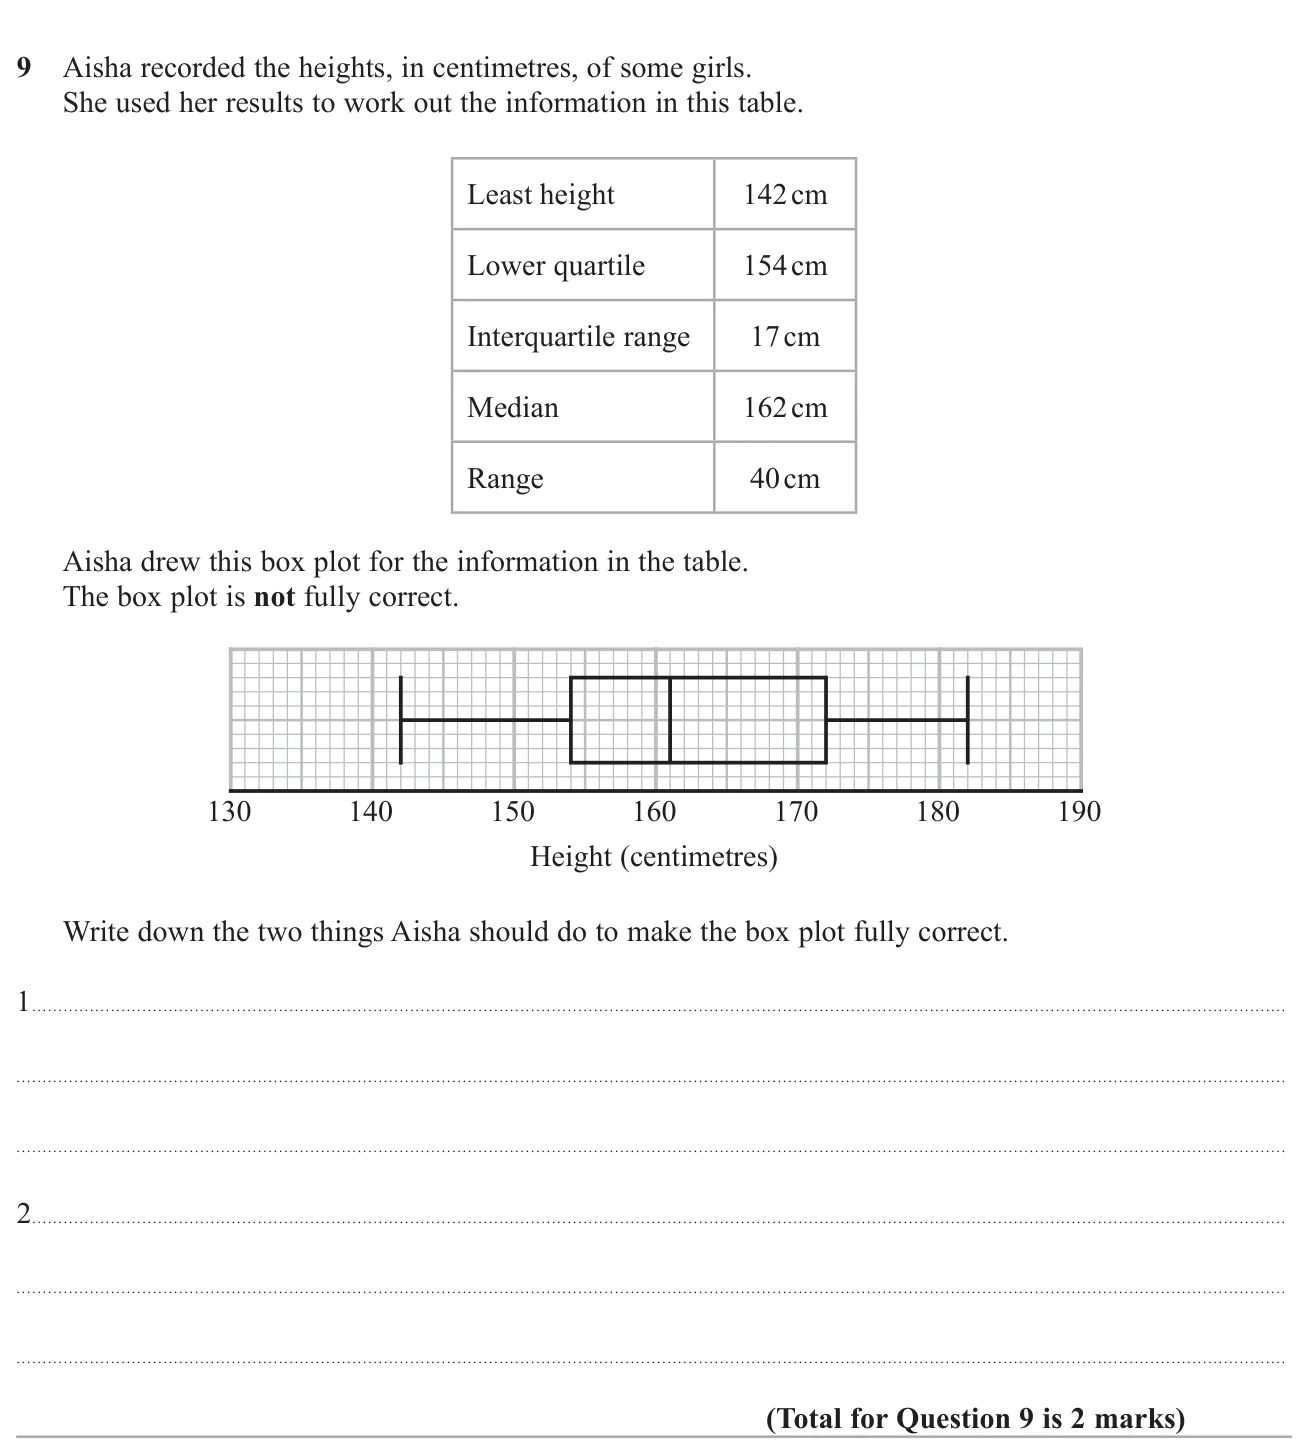
Compare a box plot with a table of summary statistics and say what two corrections are needed.

© Pearson Education Ltd. November 2020 Paper 2 (Higher, calculator), question 9.

Show answer
AnswerMove the median to 162 cm (it is drawn at 161) and move the upper quartile to 171 cm (it is drawn at 172)2 marks

Worked solution Checked against the mark scheme

Check each value against the table.

Least height 142 and lower quartile 154 are plotted correctly. Greatest height =142+40=182= 142 + 40 = 182, which is correct.

Median should be 162, but it is drawn at 161.

Upper quartile =154+17=171= 154 + 17 = 171, but it is drawn at 172.

So she should move the median line to 162 and the right end of the box to 171.

Watch out: Just saying the median is wrong without giving the correct value.

Box plots3 marksGrade 6CalculatorHigher
November 2019 · Paper 2 Higher · Q11
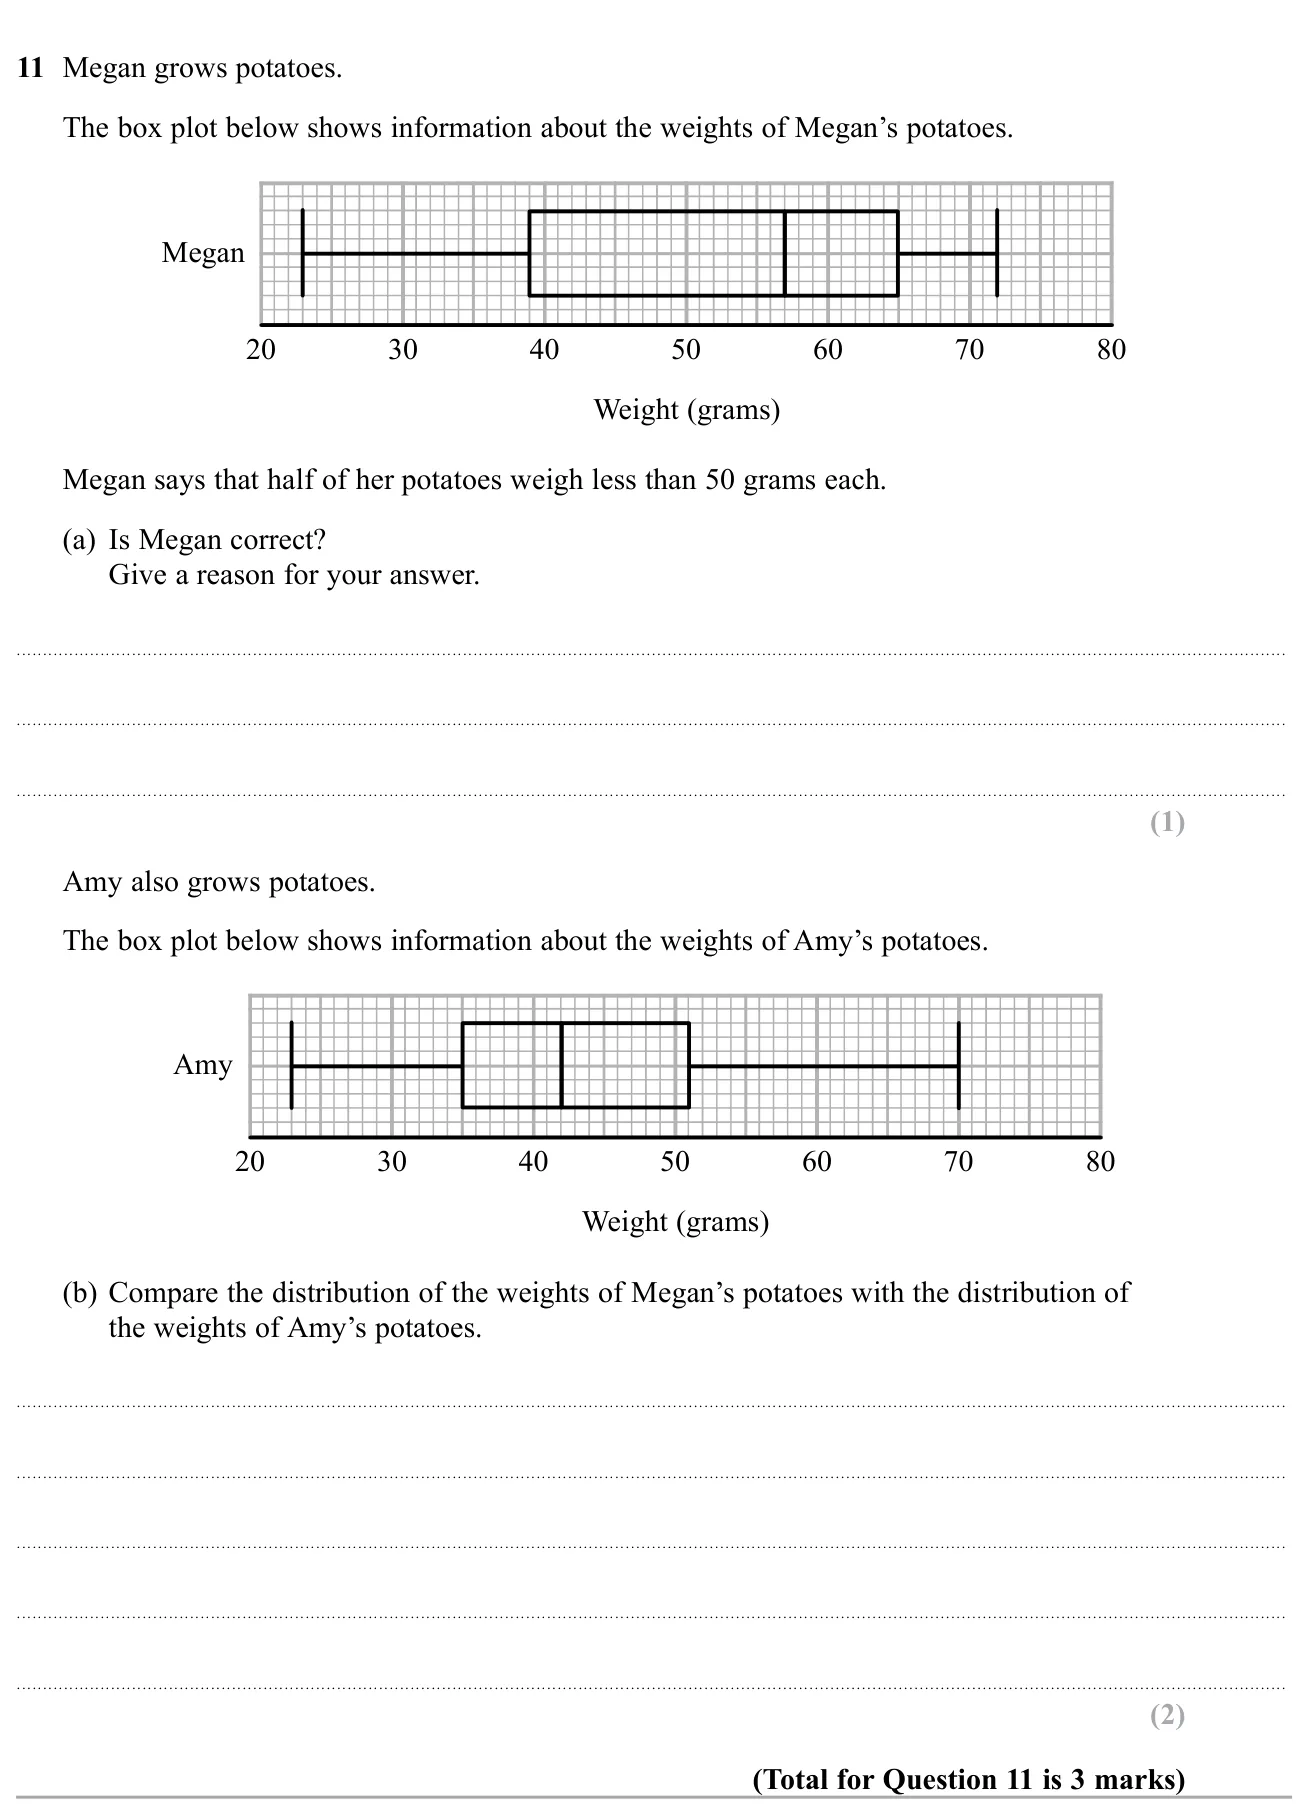
Use a box plot to test a claim about the median, then compare two box plots of potato weights.

© Pearson Education Ltd. November 2019 Paper 2 (Higher, calculator), question 11.

Show answer
(a)No: the median is 57 g, so half weigh less than 57 g, not 50 g1 mark
(b)Megan's median (57 g) is higher than Amy's (42 g), so her potatoes are heavier on average; Megan's IQR (26 g) is larger than Amy's (16 g), so her weights are more spread out2 marks

Worked solution Checked against the mark scheme

(a) The line inside Megan's box is at 57 g. This is the median, so half her potatoes weigh less than 57 g, not 50 g. She is wrong.

(b) Medians: Megan 57 g, Amy 42 g, so Megan's potatoes are generally heavier.

IQRs: Megan 65−39=2665 - 39 = 26 g, Amy 51−35=1651 - 35 = 16 g, so Megan's weights are more varied.

Watch out: Quoting the values without actually comparing them.

Box plots3 marksGrade 6CalculatorHigher
November 2019 · Paper 3 Higher · Q12
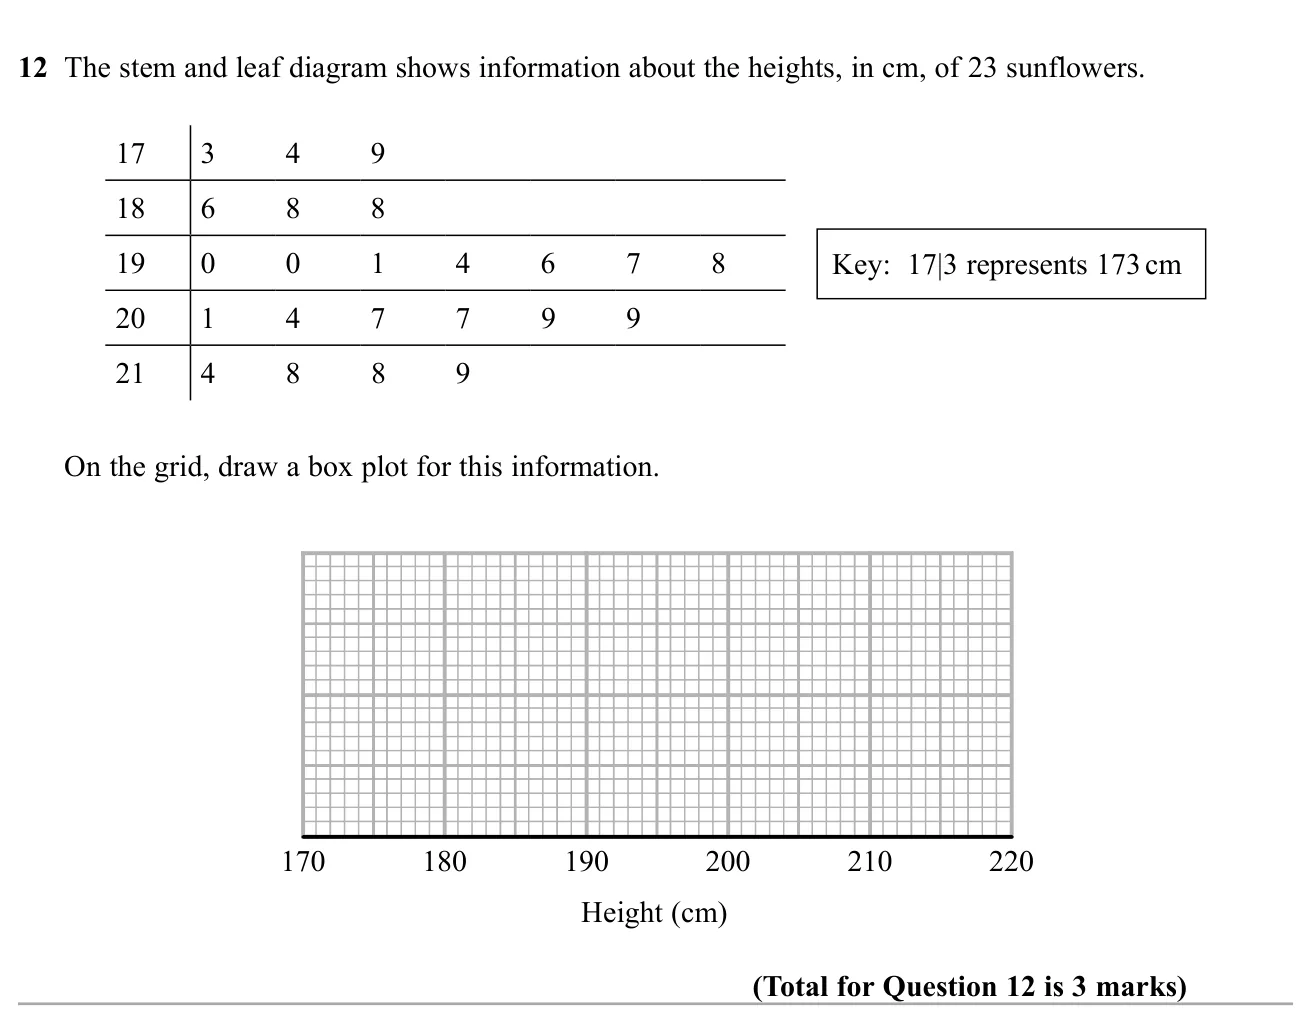
Draw a box plot from a stem and leaf diagram of sunflower heights.

© Pearson Education Ltd. November 2019 Paper 3 (Higher, calculator), question 12.

Show answer
AnswerBox plot with min 173, LQ 188, median 197, UQ 209, max 2193 marks

Worked solution Checked against the mark scheme

There are 23 values, so the median is the 12th: 197 cm.

LQ is the 6th value: 188 cm. UQ is the 18th value: 209 cm.

Smallest 173 cm, largest 219 cm.

Draw the box from 188 to 209 with a line at 197, and whiskers to 173 and 219.

Watch out: Using n÷4n \div 4 positions wrongly, e.g. taking the 5th or 6th value inconsistently for the quartiles.

Box plots6 marksGrade 6No calculatorHigher
November 2018 · Paper 1 Higher · Q9
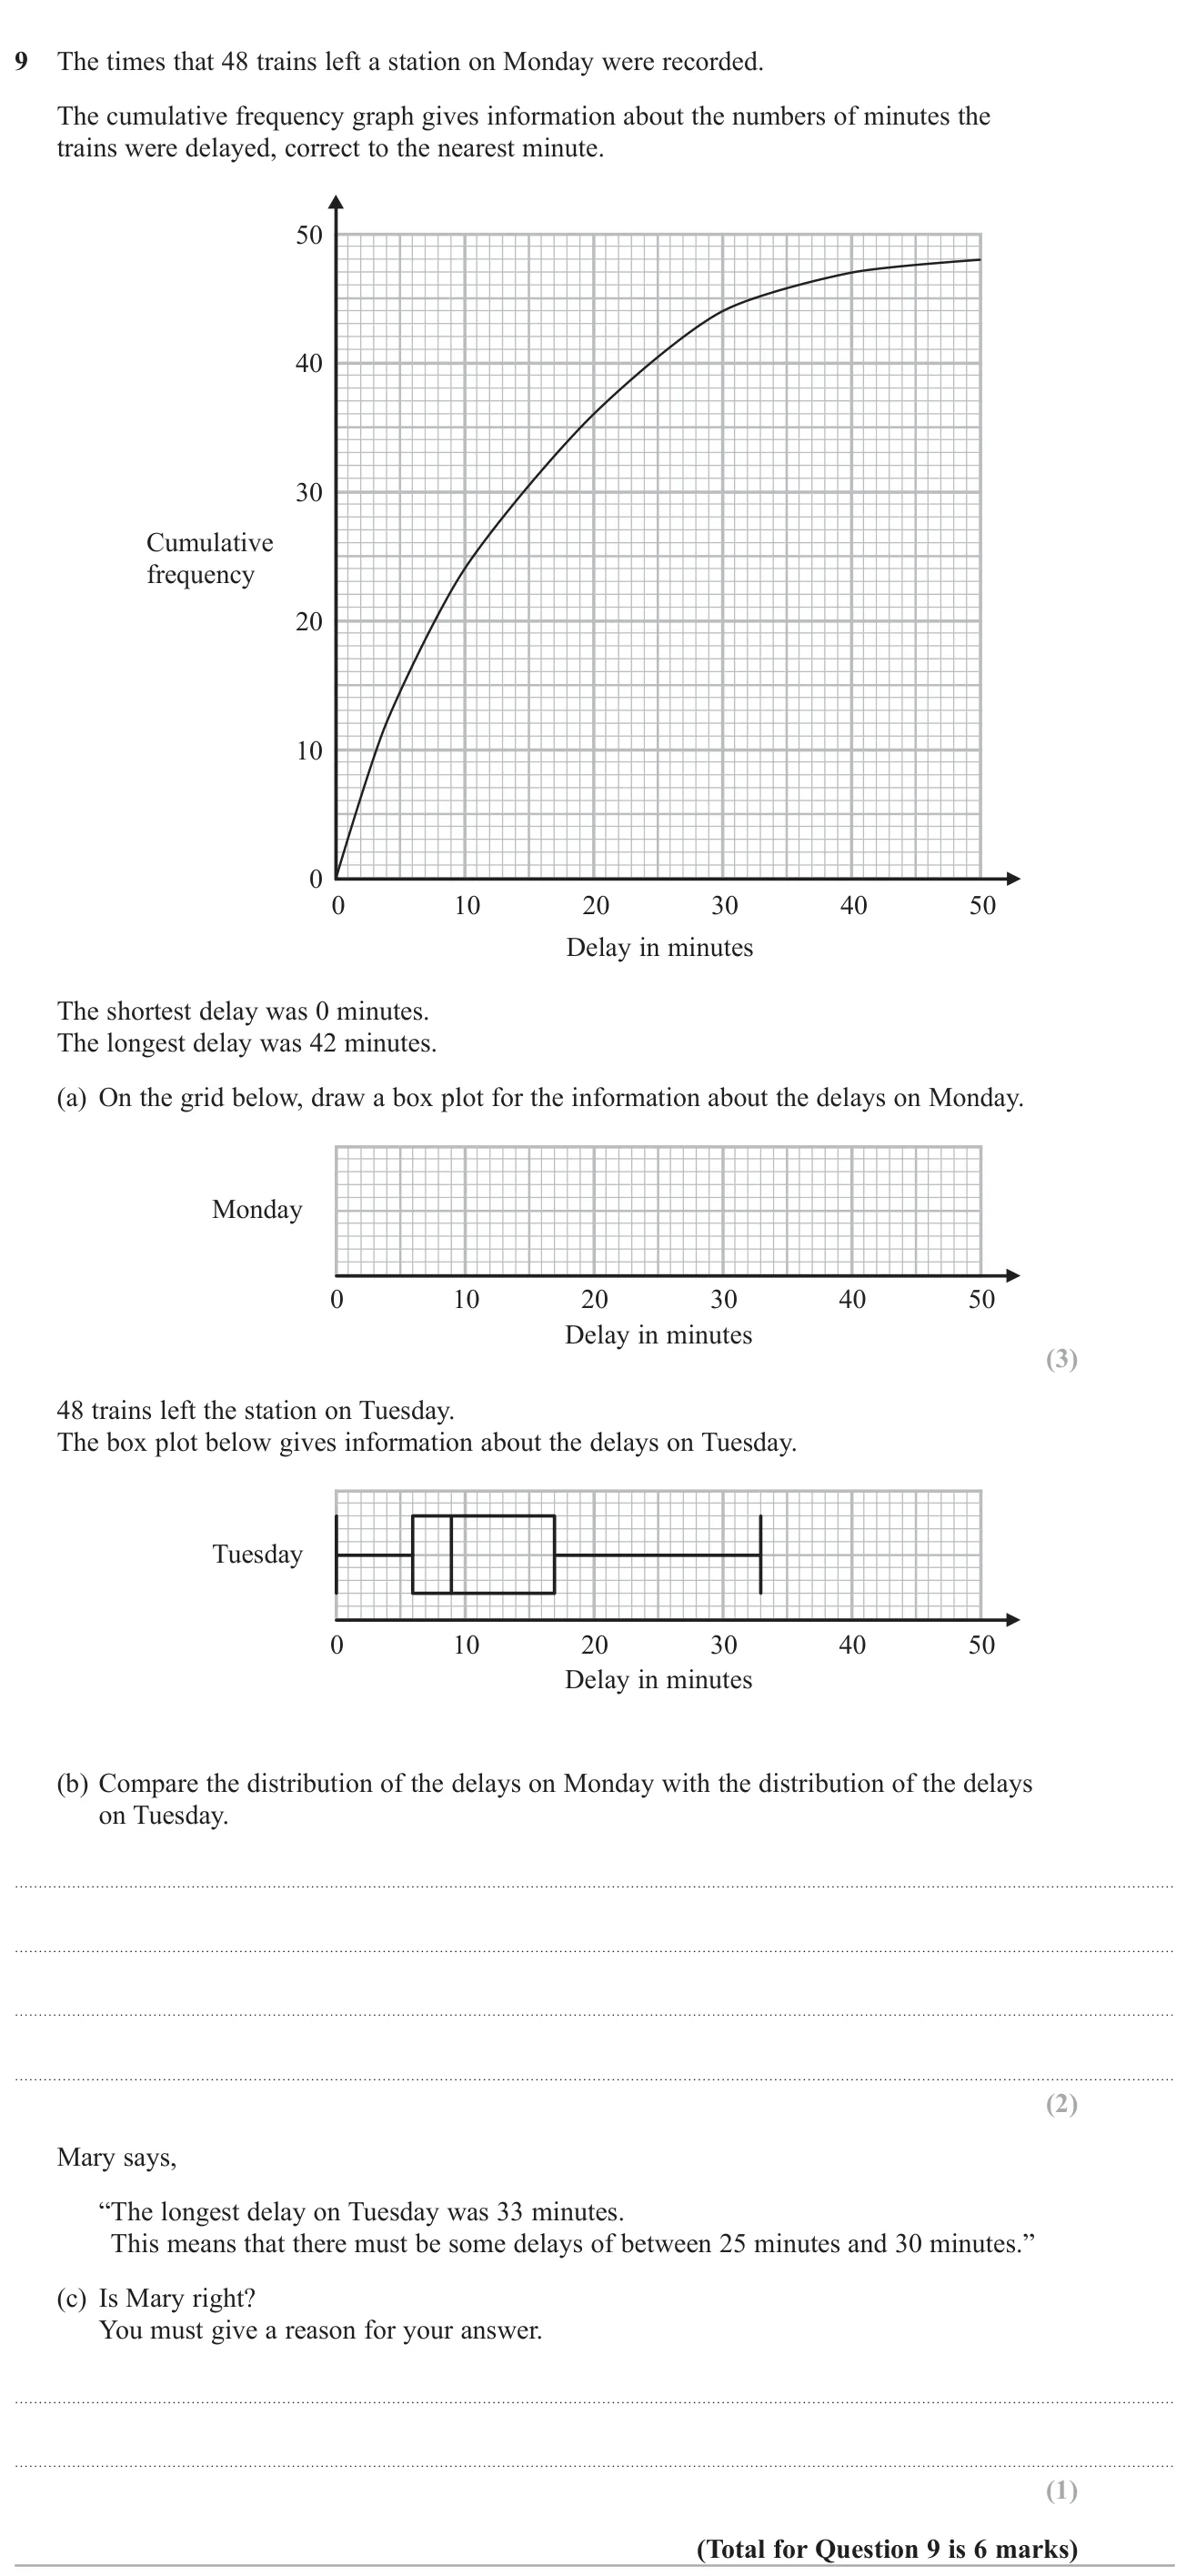
Read quartiles from a cumulative frequency graph to draw a box plot, compare it with another box plot, and judge a claim about the data.

© Pearson Education Ltd. November 2018 Paper 1 (Higher, non-calculator), question 9.

Show answer
(a)Box plot with whiskers at 0 and 42, box from 4 to 20, median at 103 marks
(b)Monday's median (10) is higher than Tuesday's (9), so delays were typically longer on Monday; Monday's IQR (16) is bigger than Tuesday's (11), so Monday's delays were more varied2 marks
(c)No: the top quarter of Tuesday's delays could all lie between 17 and 25 or between 30 and 33 minutes1 mark

Worked solution Checked against the mark scheme

(a) There are 48 trains. Read across at 12, 24 and 36: LQ = 4, median = 10, UQ = 20. Draw the box from 4 to 20 with a line at 10 and whiskers to 0 and 42.

(b) From Tuesday's box plot: median 9, LQ 6, UQ 17 (IQR 11). Monday: median 10, IQR 16. Monday's delays were longer on average and more spread out.

(c) A box plot only tells us that 12 delays lie between 17 and 33. They could all avoid 25–30, so Mary is not right.

Watch out: Reading the median at 25 on the delay axis instead of at cumulative frequency 24.

Also tested in these questions

Their main topic is different, but part of each one tests this topic.