Statistics

Cumulative frequency

11 past-paper questions, easiest first. Try each one, then reveal the answer.

Higher only

Revision guide by The Full Marks

Cumulative frequency: what you need to know

A cumulative frequency graph shows a running total of grouped data. From it you can estimate the median, the quartiles and how many values lie above or below any point. It is Higher only.

Key facts

  • Cumulative frequency is a running total: add each frequency to the ones before it.
  • Plot each running total at the upper end of its class, not the midpoint.
  • Join the points with a smooth curve or straight lines.
  • For nn values, read across at n2\frac{n}{2} for the median, n4\frac{n}{4} for the lower quartile and 3n4\frac{3n}{4} for the upper quartile.
  • Interquartile range = upper quartile − lower quartile.

Drawing and using the graph

  1. Add a running total column to the table.
  2. Plot (upper class boundary, running total) for each class. Also plot the lower boundary of the first class at 0, e.g. (0,0)(0, 0) if the first class starts at 0.
  3. Draw the curve.
  4. Read across from the cumulative frequency you need, then down to the axis.

How many are more than a value? What percentage?

  1. Read up from the value to the curve and across to find how many are below it.
  2. Subtract from the total.
  3. For a percentage or probability, divide by the total (and multiply by 100 for a percentage).

Worked examples

Example 1 Higher · grade 6

The masses, mm grams, of 80 apples are grouped: 0<m≤200 < m \le 20: 6, 20<m≤4020 < m \le 40: 14, 40<m≤6040 < m \le 60: 28, 60<m≤8060 < m \le 80: 22, 80<m≤10080 < m \le 100: 10. Find the cumulative frequencies and the points to plot.

Show the solution

Running totals: 6, 20, 48, 70, 80
Points: (0, 0), (20, 6), (40, 20), (60, 48), (80, 70), (100, 80)
To estimate the median, read across from 40; for the quartiles, from 20 and 60.

Example 2 Higher · grade 7

A cumulative frequency graph shows the times of 120 runners. Reading across from 30, 60 and 90 to the curve and down to the time axis gives 28, 36 and 45 minutes. Reading up from 50 minutes gives a cumulative frequency of 102. (a) Find the interquartile range. (b) Estimate how many runners took more than 50 minutes. (c) What percentage of the runners is this?

Show the solution

120÷4=30120 \div 4 = 30 and 34×120=90\frac{3}{4} \times 120 = 90, so the lower quartile is 28 minutes and the upper quartile is 45 minutes.
(a) IQR =45−28=17= 45 - 28 = 17 minutes
(b) 102 runners took 50 minutes or less.
120−102=18120 - 102 = 18 runners
(c) 18120×100=15%\frac{18}{120} \times 100 = 15\%

Common mistakes

  • Plotting points at the midpoints of the classes instead of the upper ends.
  • Reading quartiles at 25 and 75 when the total is not 100. Use a quarter and three quarters of the total.
  • Forgetting to subtract from the total for 'more than' questions.
  • Not starting the graph at the lowest class boundary with a cumulative frequency of 0, or forgetting to label the axes.

Exam tips

  • Draw your reading lines on the graph: they can earn method marks even if your reading is a little out.
  • Answers are accepted within a small range, so read carefully but do not worry about tiny differences.
  • If asked what is wrong with someone's graph or table, check where the points are plotted, the running totals and the axis labels. Joining points with straight lines is not a mistake.

Questions people ask

Where do you plot points on a cumulative frequency graph?

At the upper boundary of each class, because the running total counts everything up to the end of that class.

How do you find the median from a cumulative frequency graph?

Go to half the total frequency on the vertical axis, read across to the curve, then down to the horizontal axis.

Exam questions: Cumulative frequency (11, easiest first)

Cumulative frequency6 marksGrade 5No calculatorHigher
November 2024 · Paper 1 Higher · Q9
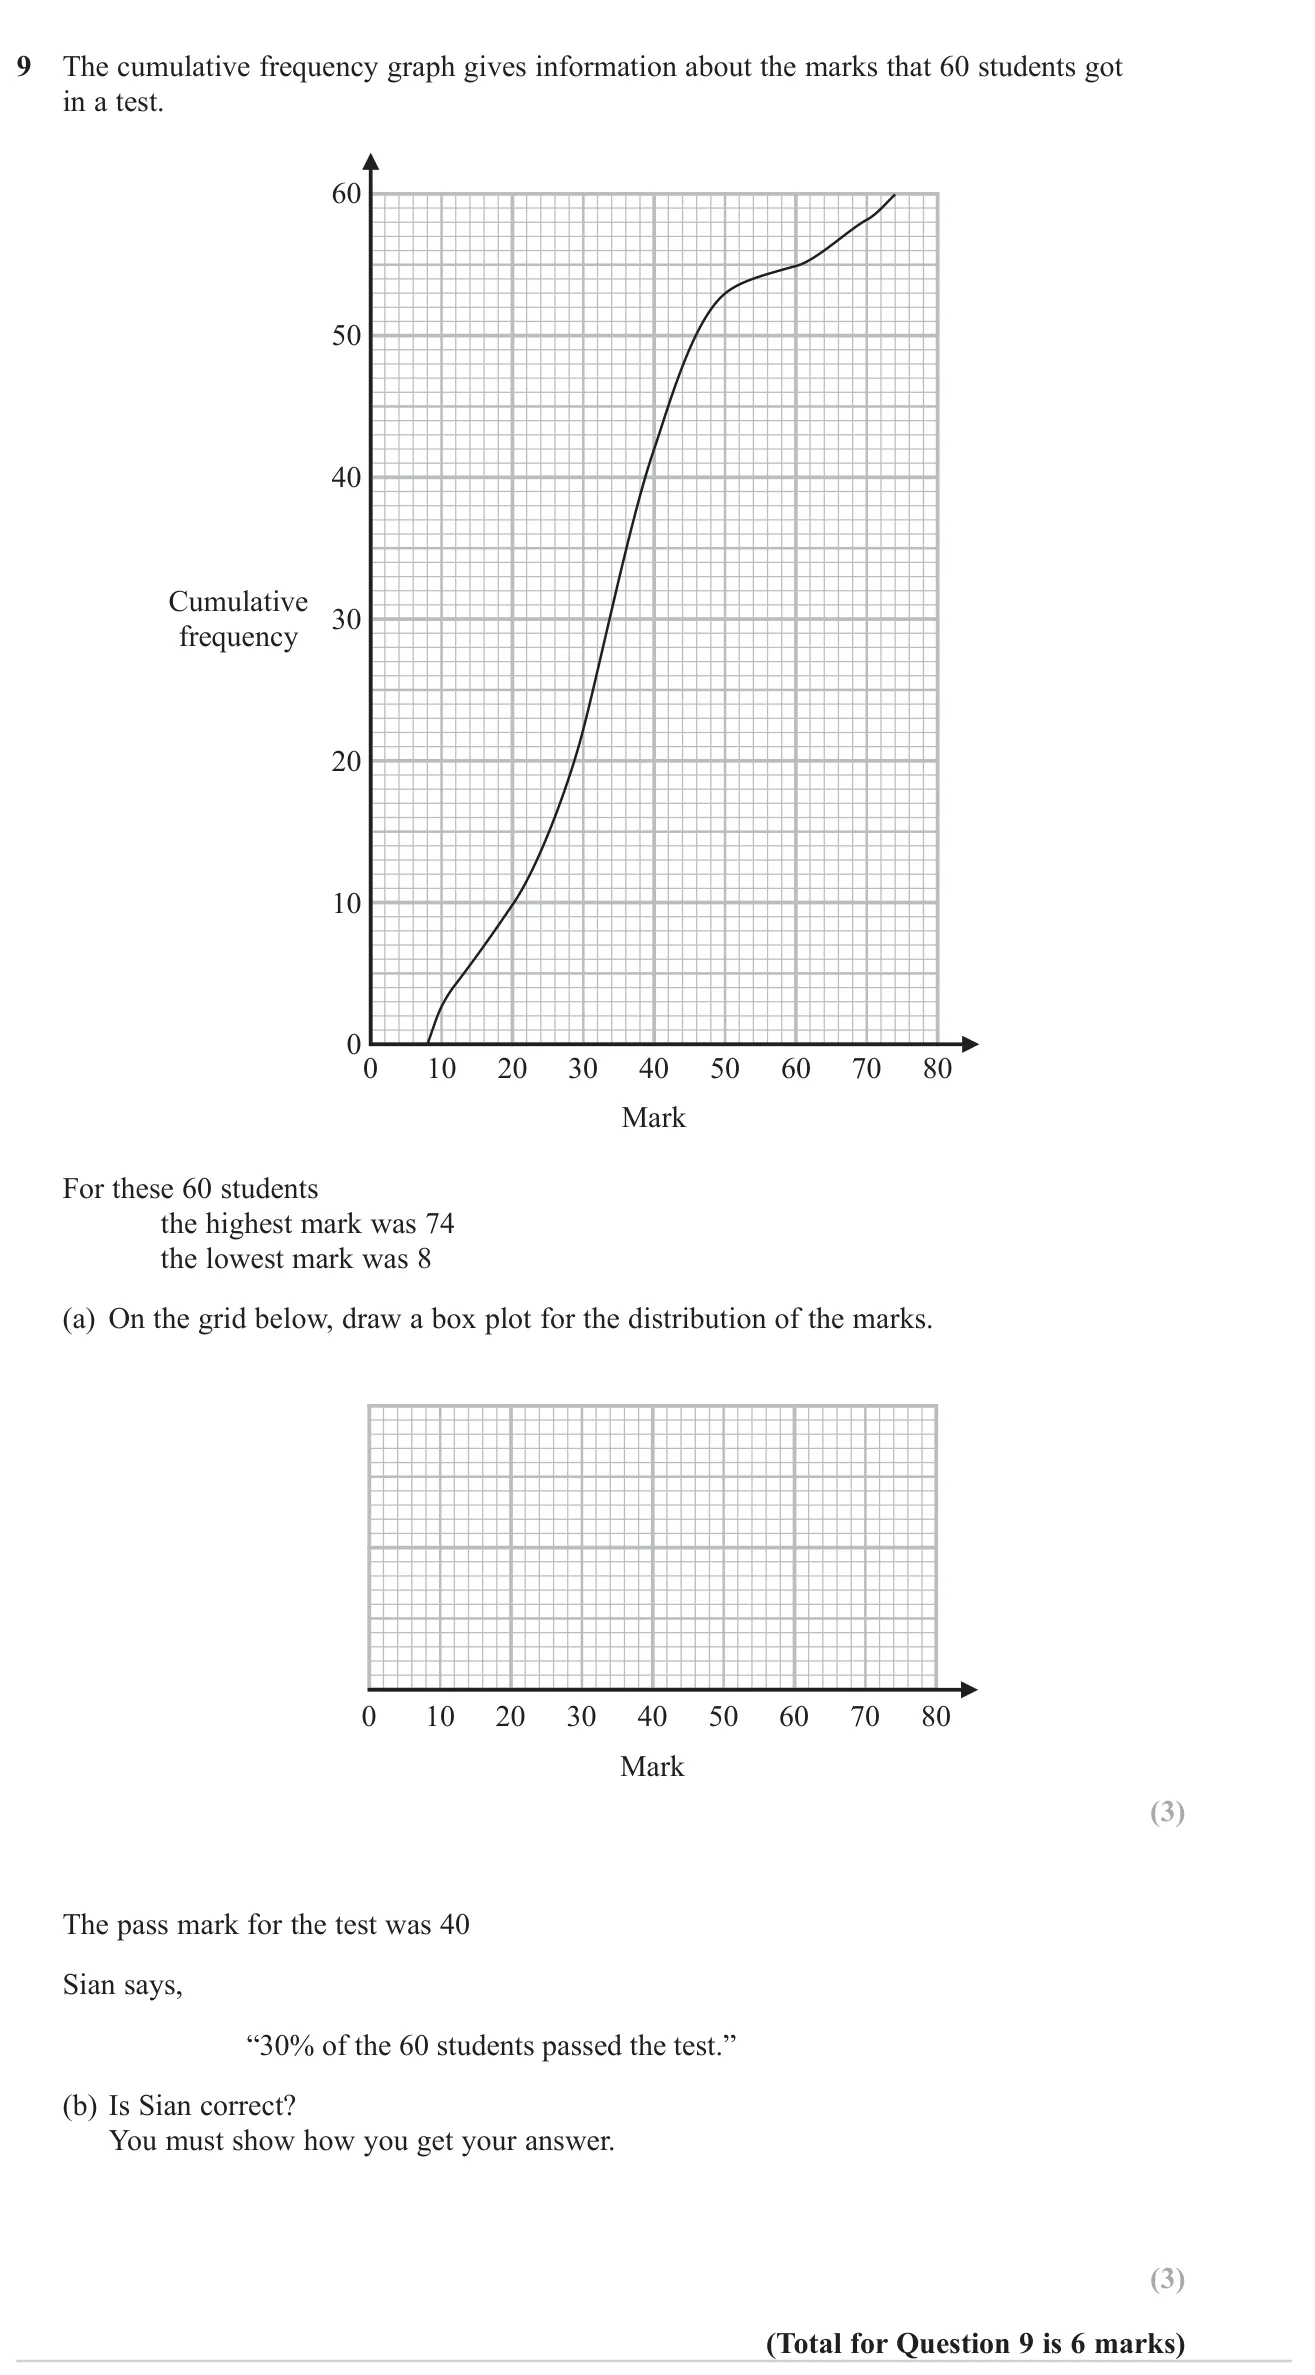
Read quartiles and the median from a cumulative frequency graph to draw a box plot, then test a claim about the percentage who passed.

© Pearson Education Ltd. November 2024 Paper 1 (Higher, non-calculator), question 9.

Show answer
(a)Box plot: minimum 8, lower quartile 25, median 34, upper quartile 42, maximum 743 marks
(b)Yes: about 42 students scored under 40, so 18 passed, and 18 is 30% of 603 marks

Worked solution Checked against the mark scheme

(a) Read across at cf 15, 30 and 45:

LQ ≈25\approx 25, median ≈34\approx 34, UQ ≈42\approx 42. Plot these with the lowest mark 8 and highest 74.

(b) At mark 40 the graph reads a cumulative frequency of about 42.

Passed: 60−42=1860 - 42 = 18, and 1860×100=30%\frac{18}{60} \times 100 = 30\%. So Sian is correct.

Watch out: Reading the quartiles at cf 20 and 40 instead of 15 and 45.
Cumulative frequency6 marksGrade 5CalculatorHigher
November 2023 · Paper 3 Higher · Q13
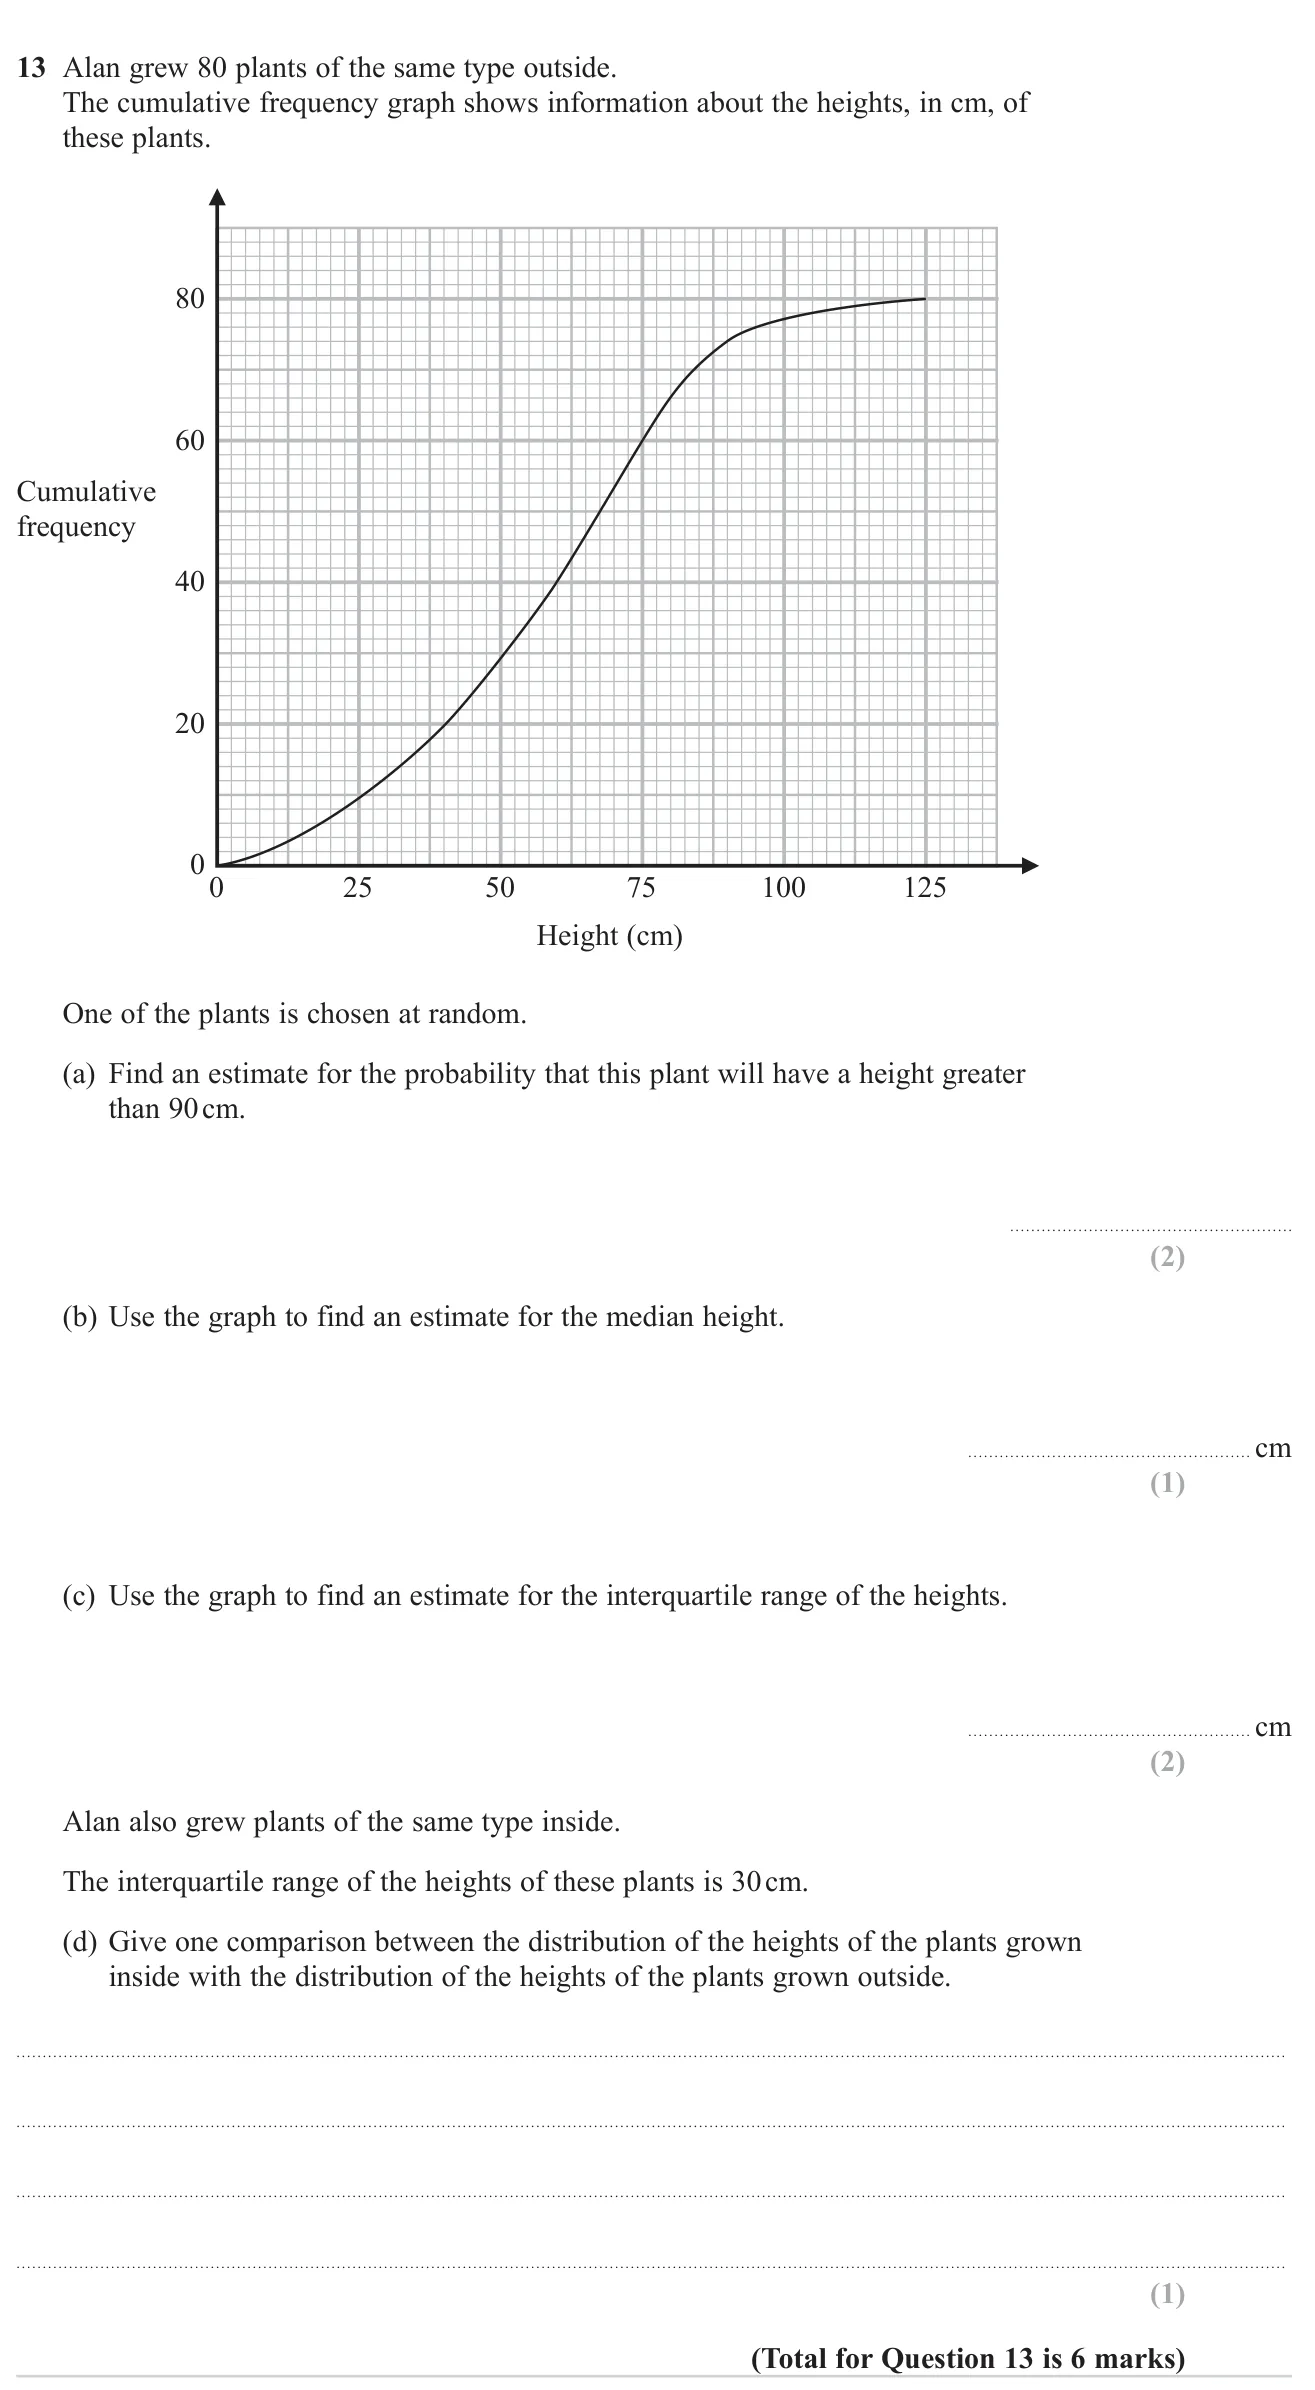
Read a cumulative frequency graph to estimate a probability, the median and the interquartile range, then compare spreads.

© Pearson Education Ltd. November 2023 Paper 3 (Higher, calculator), question 13.

Show answer
(a)680\frac{6}{80} (accept 580\frac{5}{80})2 marks
(b)6060 cm1 mark
(c)3535 cm2 marks
(d)The heights of the plants grown outside are more spread out (IQR 35 cm compared with 30 cm)1 mark

Worked solution Checked against the mark scheme

(a) At 90 cm the cumulative frequency is about 74, so 80−74=680 - 74 = 6 plants are taller. Probability ≈680\approx \frac{6}{80}.

(b) Median at 80÷2=4080 \div 2 = 40th plant: about 60 cm.

(c) LQ (20th plant) ≈40\approx 40 cm, UQ (60th plant) ≈75\approx 75 cm. IQR =75−40=35= 75 - 40 = 35 cm.

(d) 35>3035 > 30, so the heights of the outside plants are more varied than those grown inside.

Watch out: In (a), giving 74/80, the probability of being 90 cm or shorter.

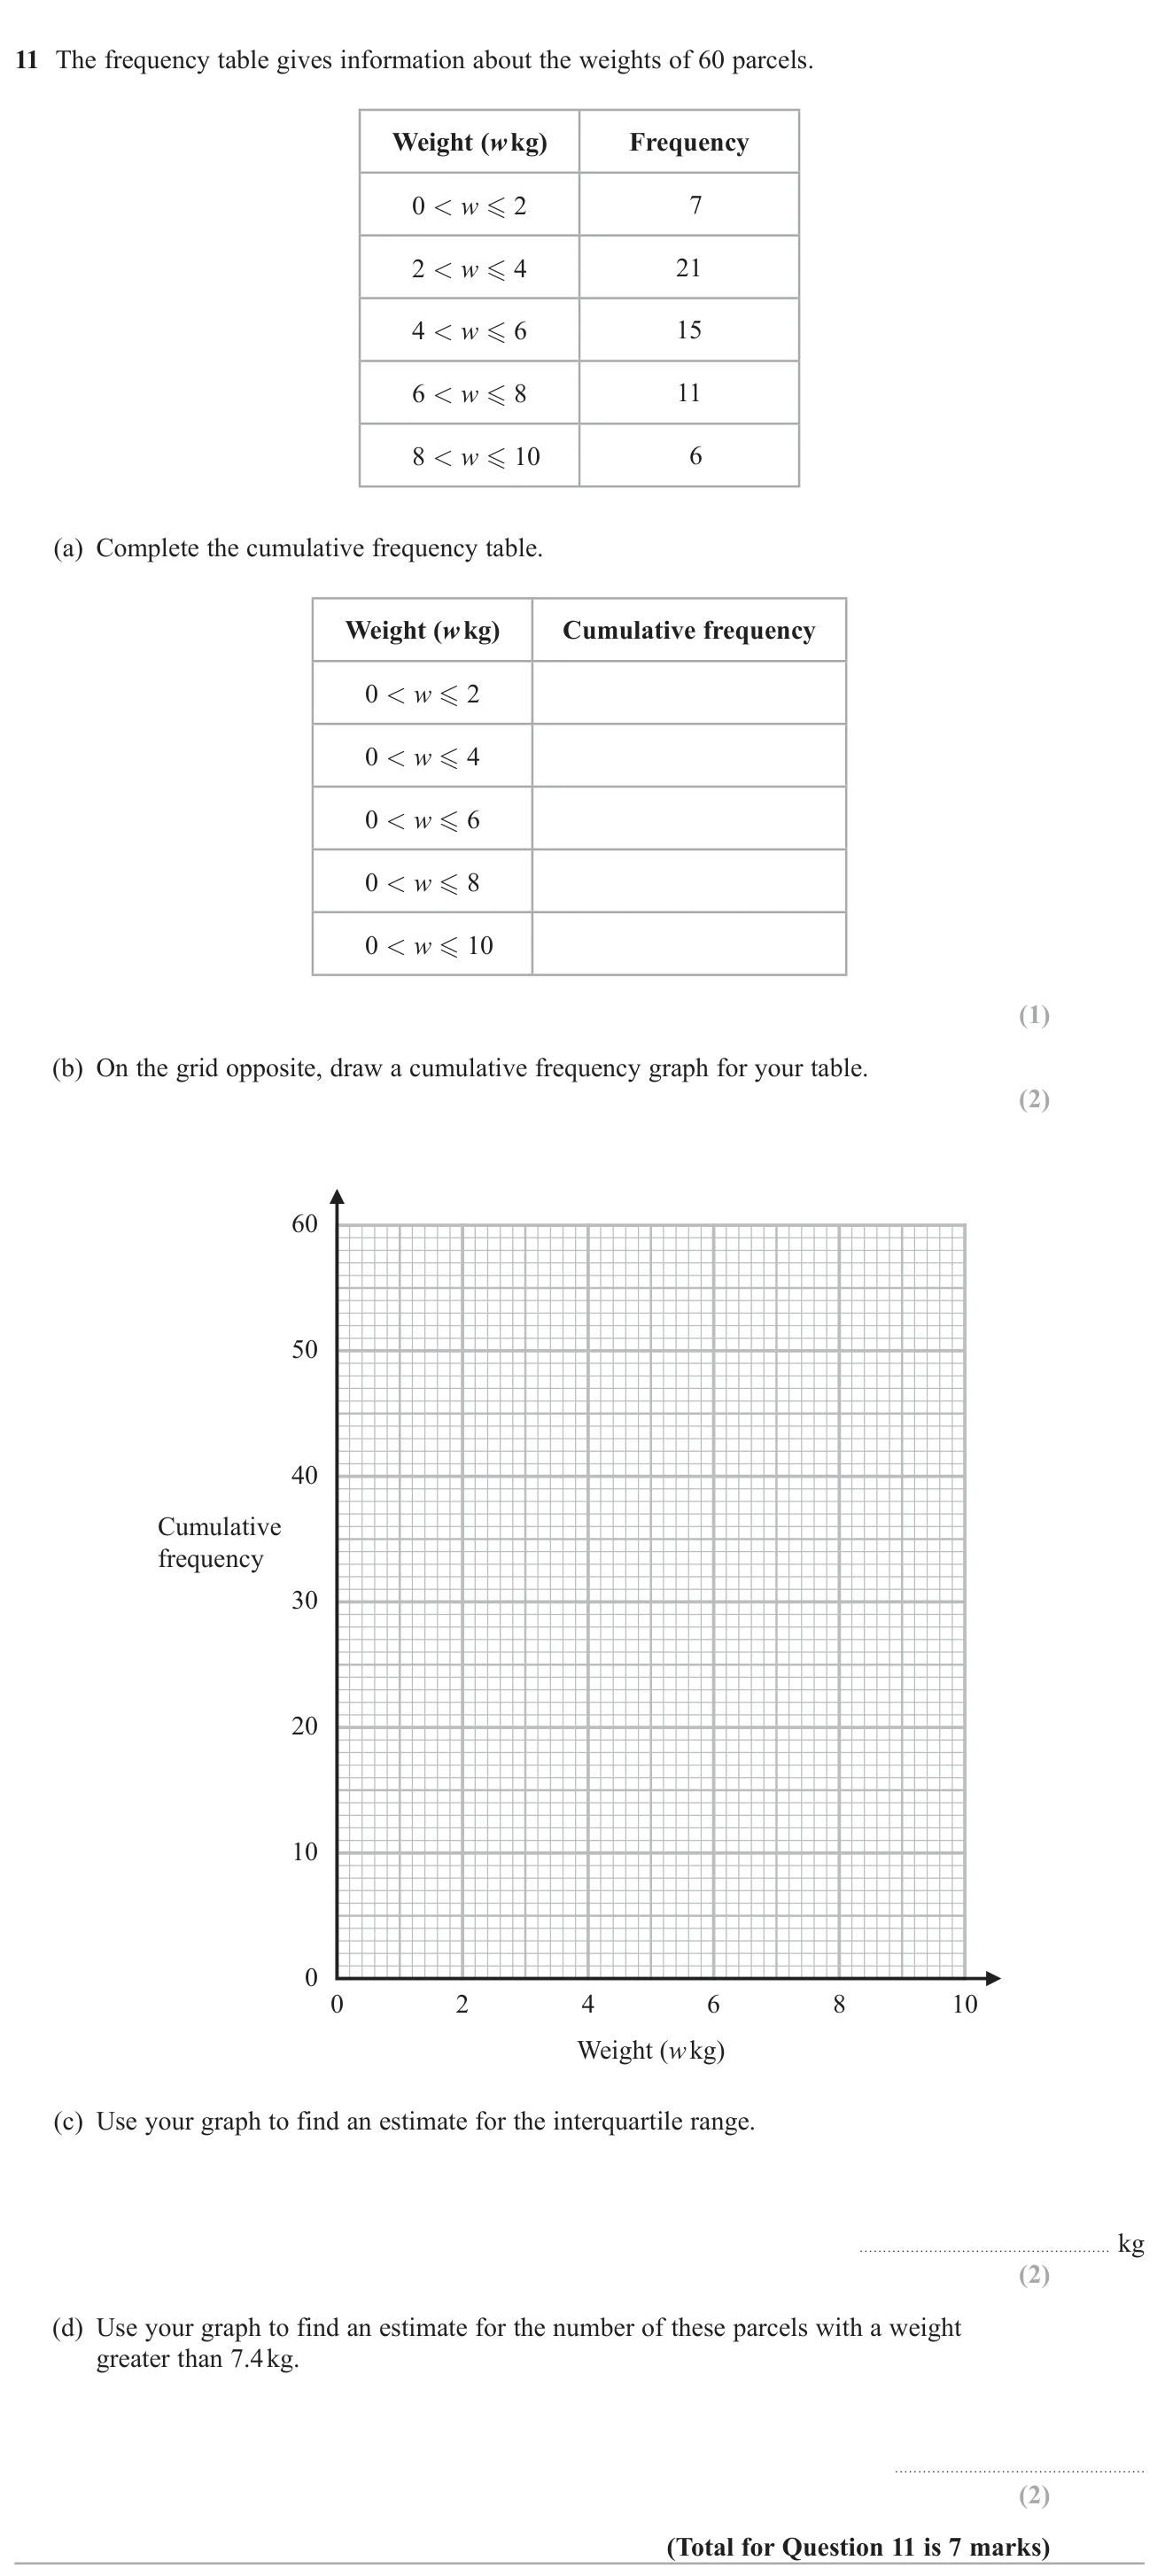
Cumulative frequency7 marksGrade 6CalculatorHigher
June 2024 · Paper 2 Higher · Q11
Complete a cumulative frequency table, draw the graph, estimate the interquartile range and count values above a given weight.

© Pearson Education Ltd. June 2024 Paper 2 (Higher, calculator), question 11.

Show answer
(a)7,28,43,54,607, 28, 43, 54, 601 mark
(b)Cumulative frequency curve through (2,7),(4,28),(6,43),(8,54),(10,60)(2,7),(4,28),(6,43),(8,54),(10,60)2 marks
(c)About 3.73.7 kg (accept 3.4 to 4)2 marks
(d)About 88 (accept 7 to 10)2 marks

Worked solution Checked against the mark scheme

(a) Running totals: 7,7+21=28,43,54,607, 7+21=28, 43, 54, 60.

(b) Plot at the upper ends of each class, (2,7),(4,28),(6,43),(8,54),(10,60)(2,7),(4,28),(6,43),(8,54),(10,60), and join with a smooth curve.

(c) LQ at cf 15 is about 2.7 kg; UQ at cf 45 is about 6.3 kg. IQR ≈6.3−2.7=3.6\approx 6.3 - 2.7 = 3.6 kg.

(d) At 7.4 kg the cf is about 51, so 60−51≈960 - 51 \approx 9 parcels.

Watch out: Plotting cumulative frequencies at the midpoints of the classes instead of the upper boundaries.

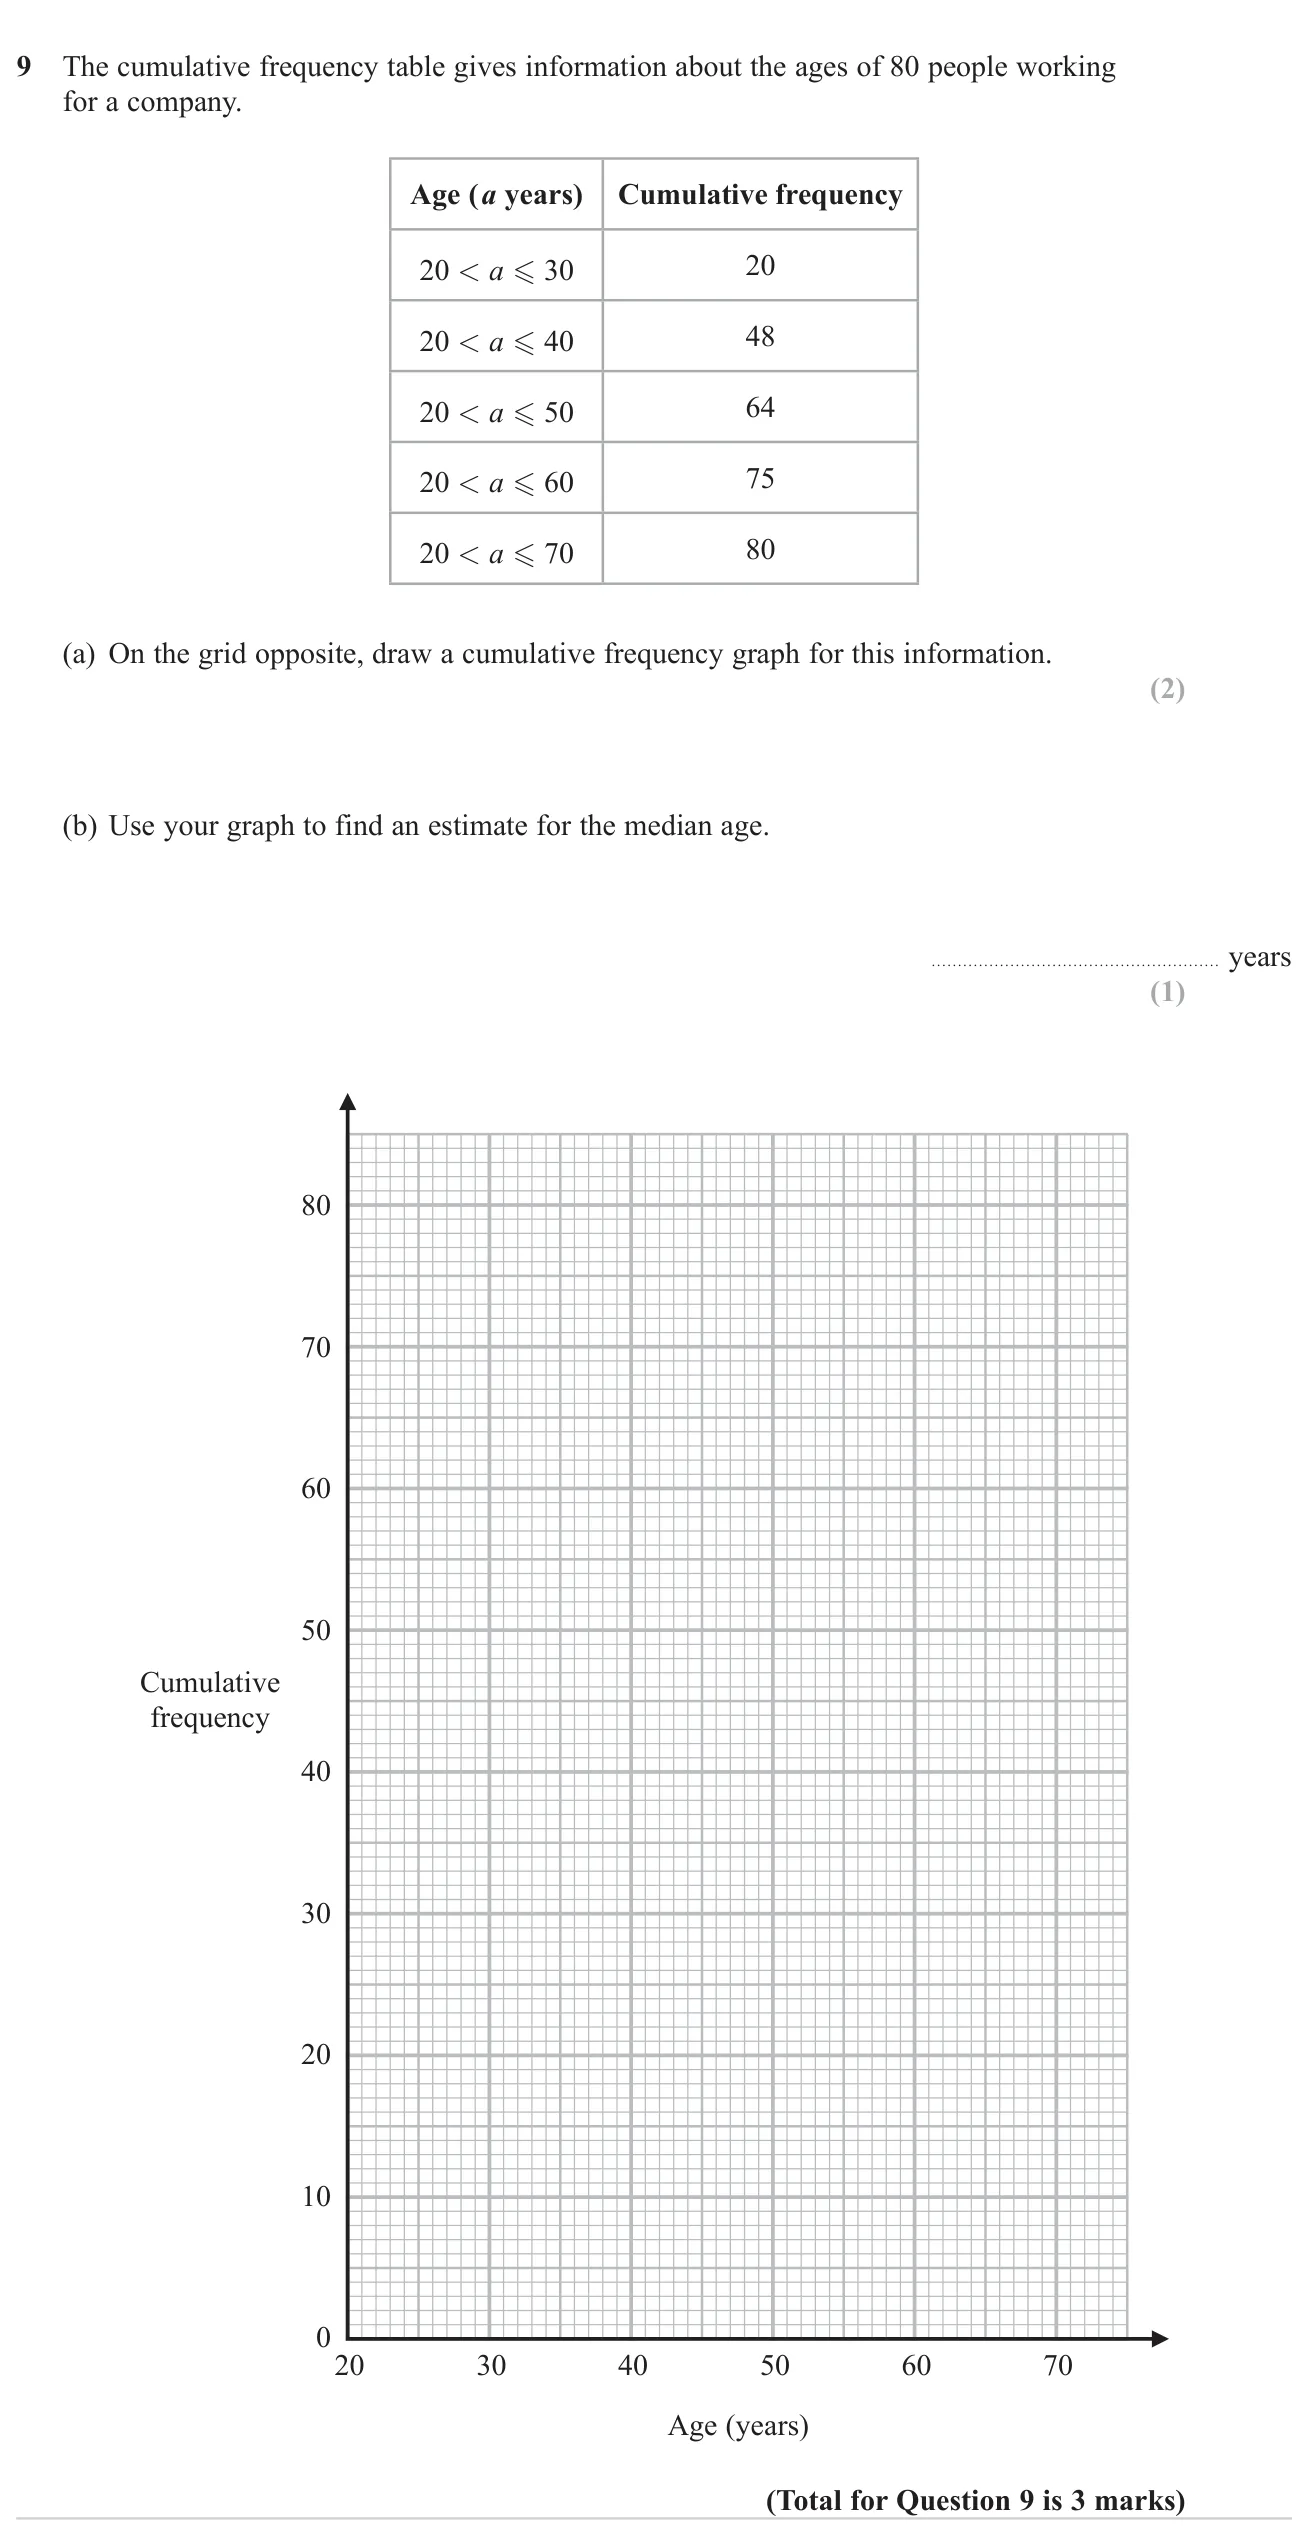
Cumulative frequency3 marksGrade 6CalculatorHigher
June 2023 · Paper 2 Higher · Q9
Plot a cumulative frequency graph from a table of ages and read off an estimate of the median.

© Pearson Education Ltd. June 2023 Paper 2 (Higher, calculator), question 9.

Show answer
(a)Curve through (20,0)(20, 0), (30,20)(30, 20), (40,48)(40, 48), (50,64)(50, 64), (60,75)(60, 75), (70,80)(70, 80)2 marks
(b)About 3737 years (36 to 38)1 mark

Worked solution Checked against the mark scheme

(a) Plot each cumulative frequency at the upper end of its class: (30,20)(30, 20), (40,48)(40, 48), (50,64)(50, 64), (60,75)(60, 75), (70,80)(70, 80), starting from (20,0)(20, 0), and join with a smooth curve.

(b) Median is at 80÷2=4080 \div 2 = 40 people. Read across from 40 to the curve and down: about 3737 years.

Watch out: Plotting the points at the middle of each class instead of the upper end.

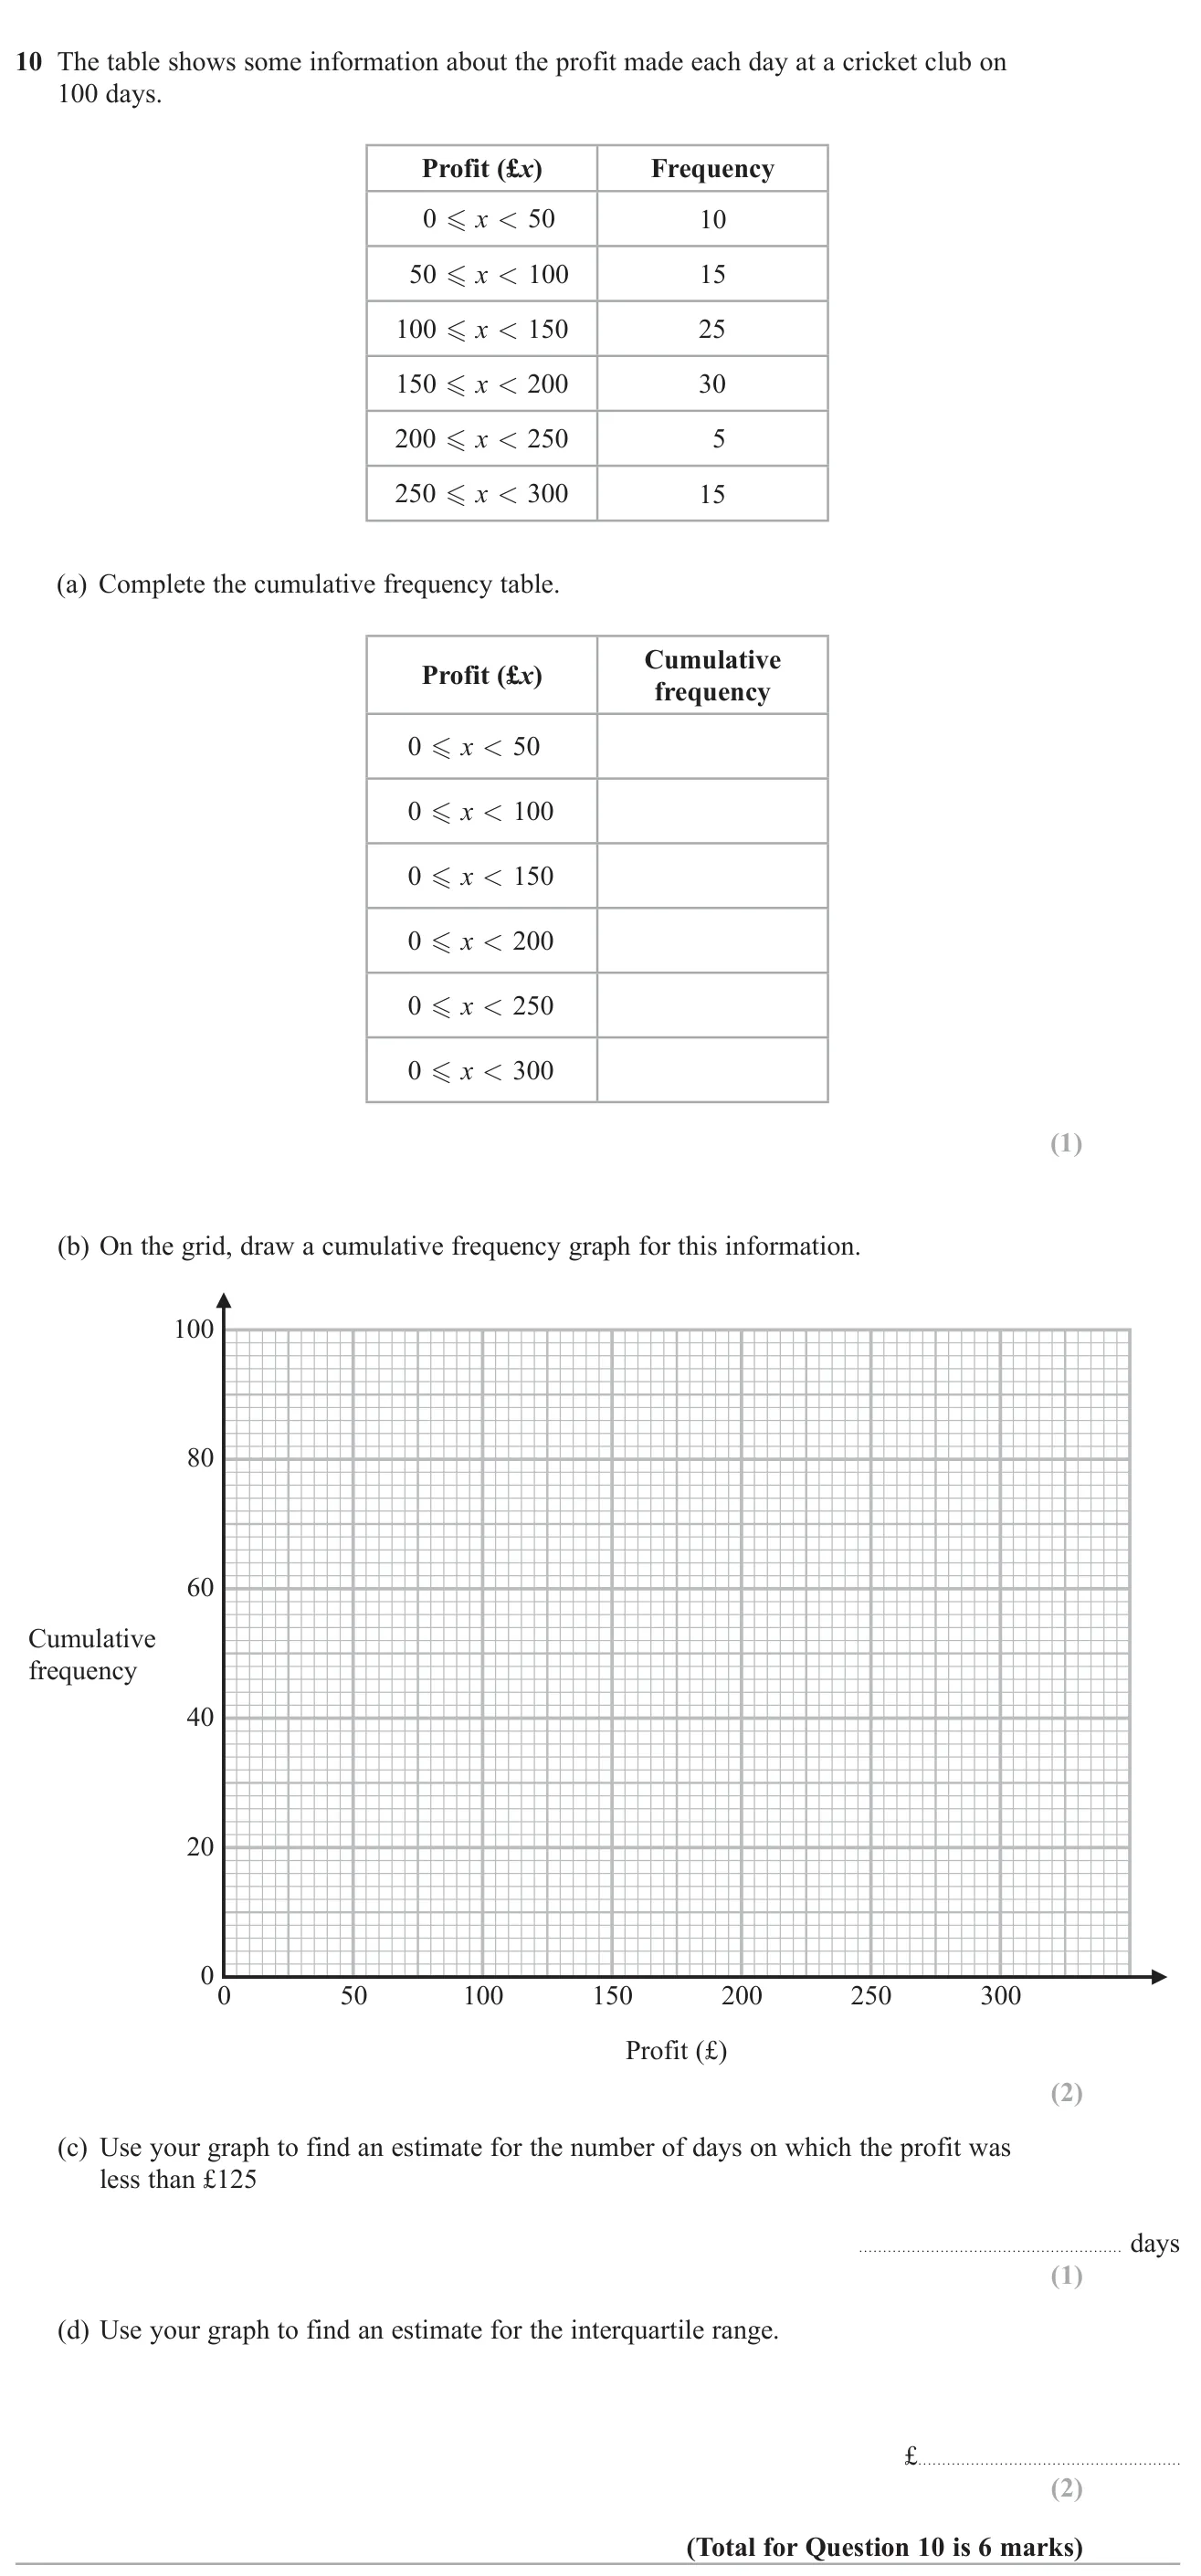
Cumulative frequency6 marksGrade 6No calculatorHigher
June 2022 · Paper 1 Higher · Q10
Build a cumulative frequency table and graph for daily profits, then estimate a count and the interquartile range.

© Pearson Education Ltd. June 2022 Paper 1 (Higher, non-calculator), question 10.

Show answer
(a)10, 25, 50, 80, 85, 1001 mark
(b)Points at (50,10),(100,25),(150,50),(200,80),(250,85),(300,100)(50,10), (100,25), (150,50), (200,80), (250,85), (300,100) joined2 marks
(c)About 37 days (35 to 39)1 mark
(d)About £89 (85 to 93)2 marks

Worked solution Checked against the mark scheme

(a) Running totals: 10, 25, 50, 80, 85, 100

(b) Plot each total at the top of its class (50, 100, …, 300) and join.

(c) Read up from £125: about 37 days.

(d) Lower quartile (25th value) =£100= £100; upper quartile (75th value) ≈£190\approx £190

IQR ≈190−100=£90\approx 190 - 100 = £90

Watch out: Plotting points at class midpoints instead of upper class boundaries.

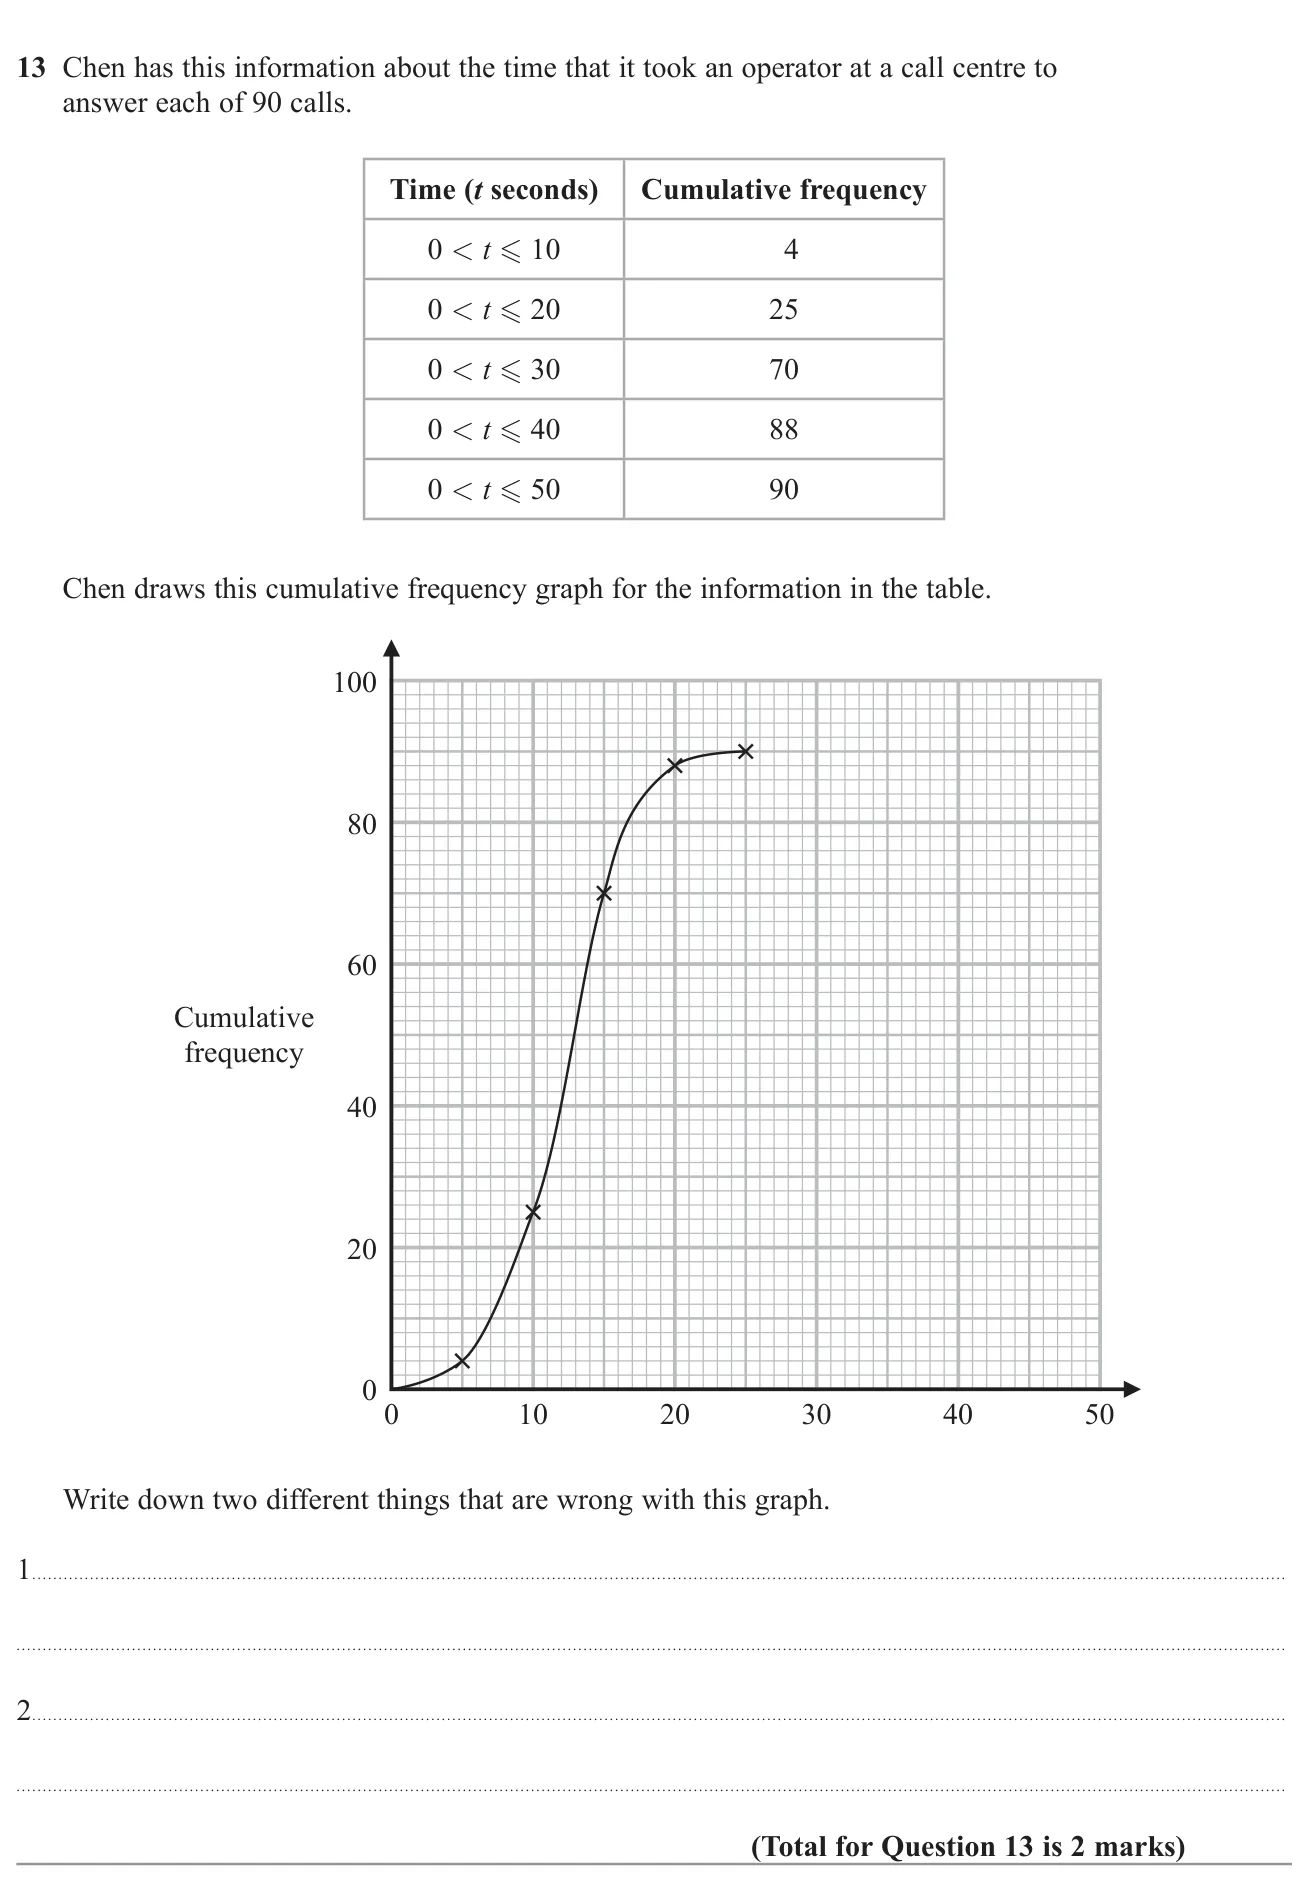
Cumulative frequency2 marksGrade 6CalculatorHigher
November 2022 · Paper 3 Higher · Q13
Identify two faults in a drawn cumulative frequency graph.

© Pearson Education Ltd. November 2022 Paper 3 (Higher, calculator), question 13.

Show answer
Answer1. The horizontal axis has no label. 2. The points are plotted at the middle of each class instead of at the upper end2 marks

Worked solution Checked against the mark scheme

Check the axes: the time axis has no label (it should say time in seconds).

Check the points: cumulative frequency is plotted at the upper end of each class (10, 20, 30, …), but these are plotted at 5, 15, 25, …

Watch out: Saying the curve should be joined with straight lines, which is not wrong.

Cumulative frequency3 marksGrade 6No calculatorHigher
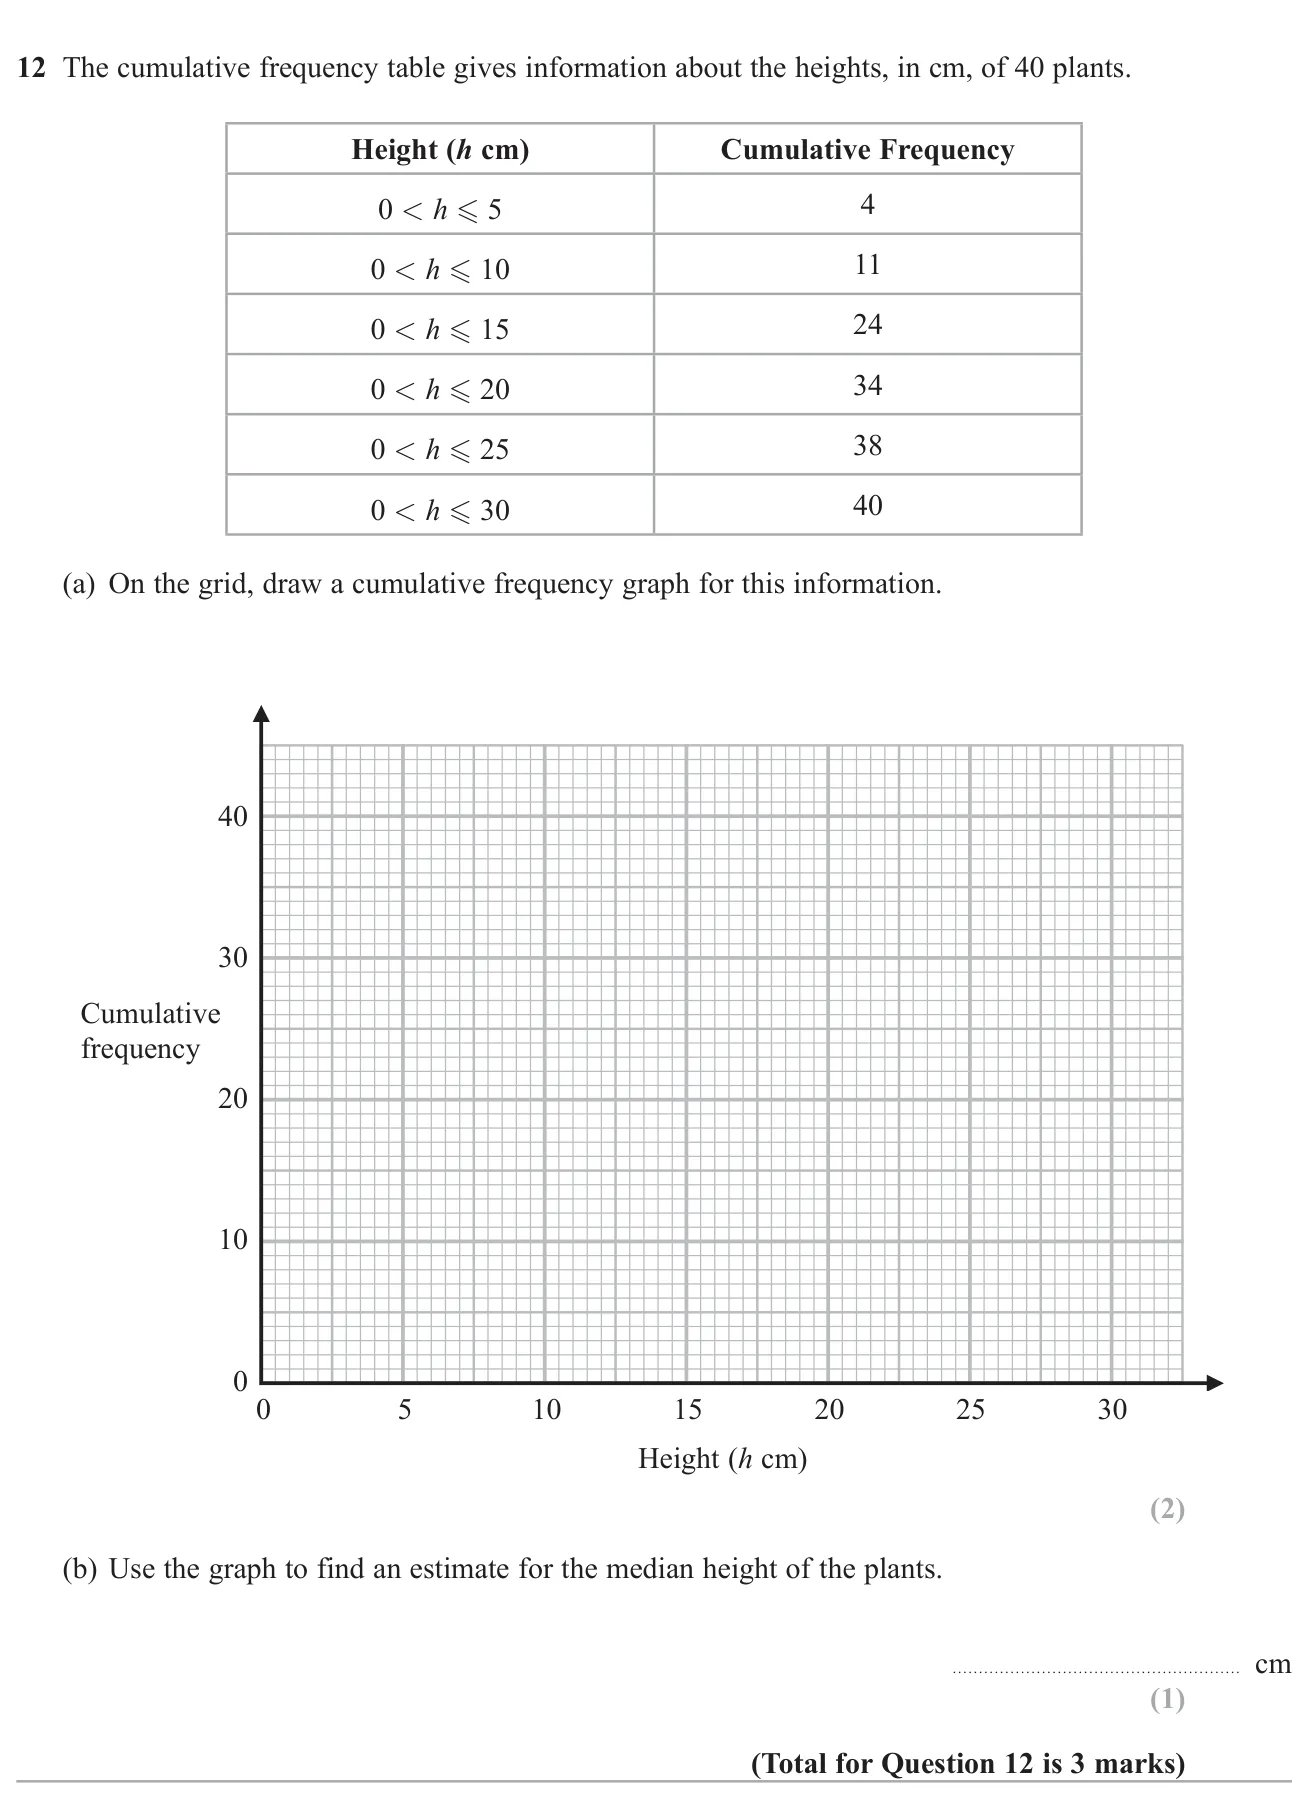
November 2021 · Paper 1 Higher · Q12
Plot a cumulative frequency curve for plant heights and read off the median.

© Pearson Education Ltd. November 2021 Paper 1 (Higher, non-calculator), question 12.

Show answer
(a)Points (5, 4), (10, 11), (15, 24), (20, 34), (25, 38), (30, 40) joined with a smooth curve or straight lines2 marks
(b)Between 1313 and 1414 cm1 mark

Worked solution Checked against the mark scheme

(a) Plot each cumulative frequency at the upper end of its interval: (5, 4), (10, 11), (15, 24), (20, 34), (25, 38), (30, 40). Start at (0, 0) and join with a smooth curve.

(b) The median is at half of 40, which is 20. Read across from 20 to the curve and down: about 13.513.5 cm.

Watch out: Plotting points at the midpoints of the intervals instead of the upper ends.

Cumulative frequency1 markGrade 6CalculatorHigher
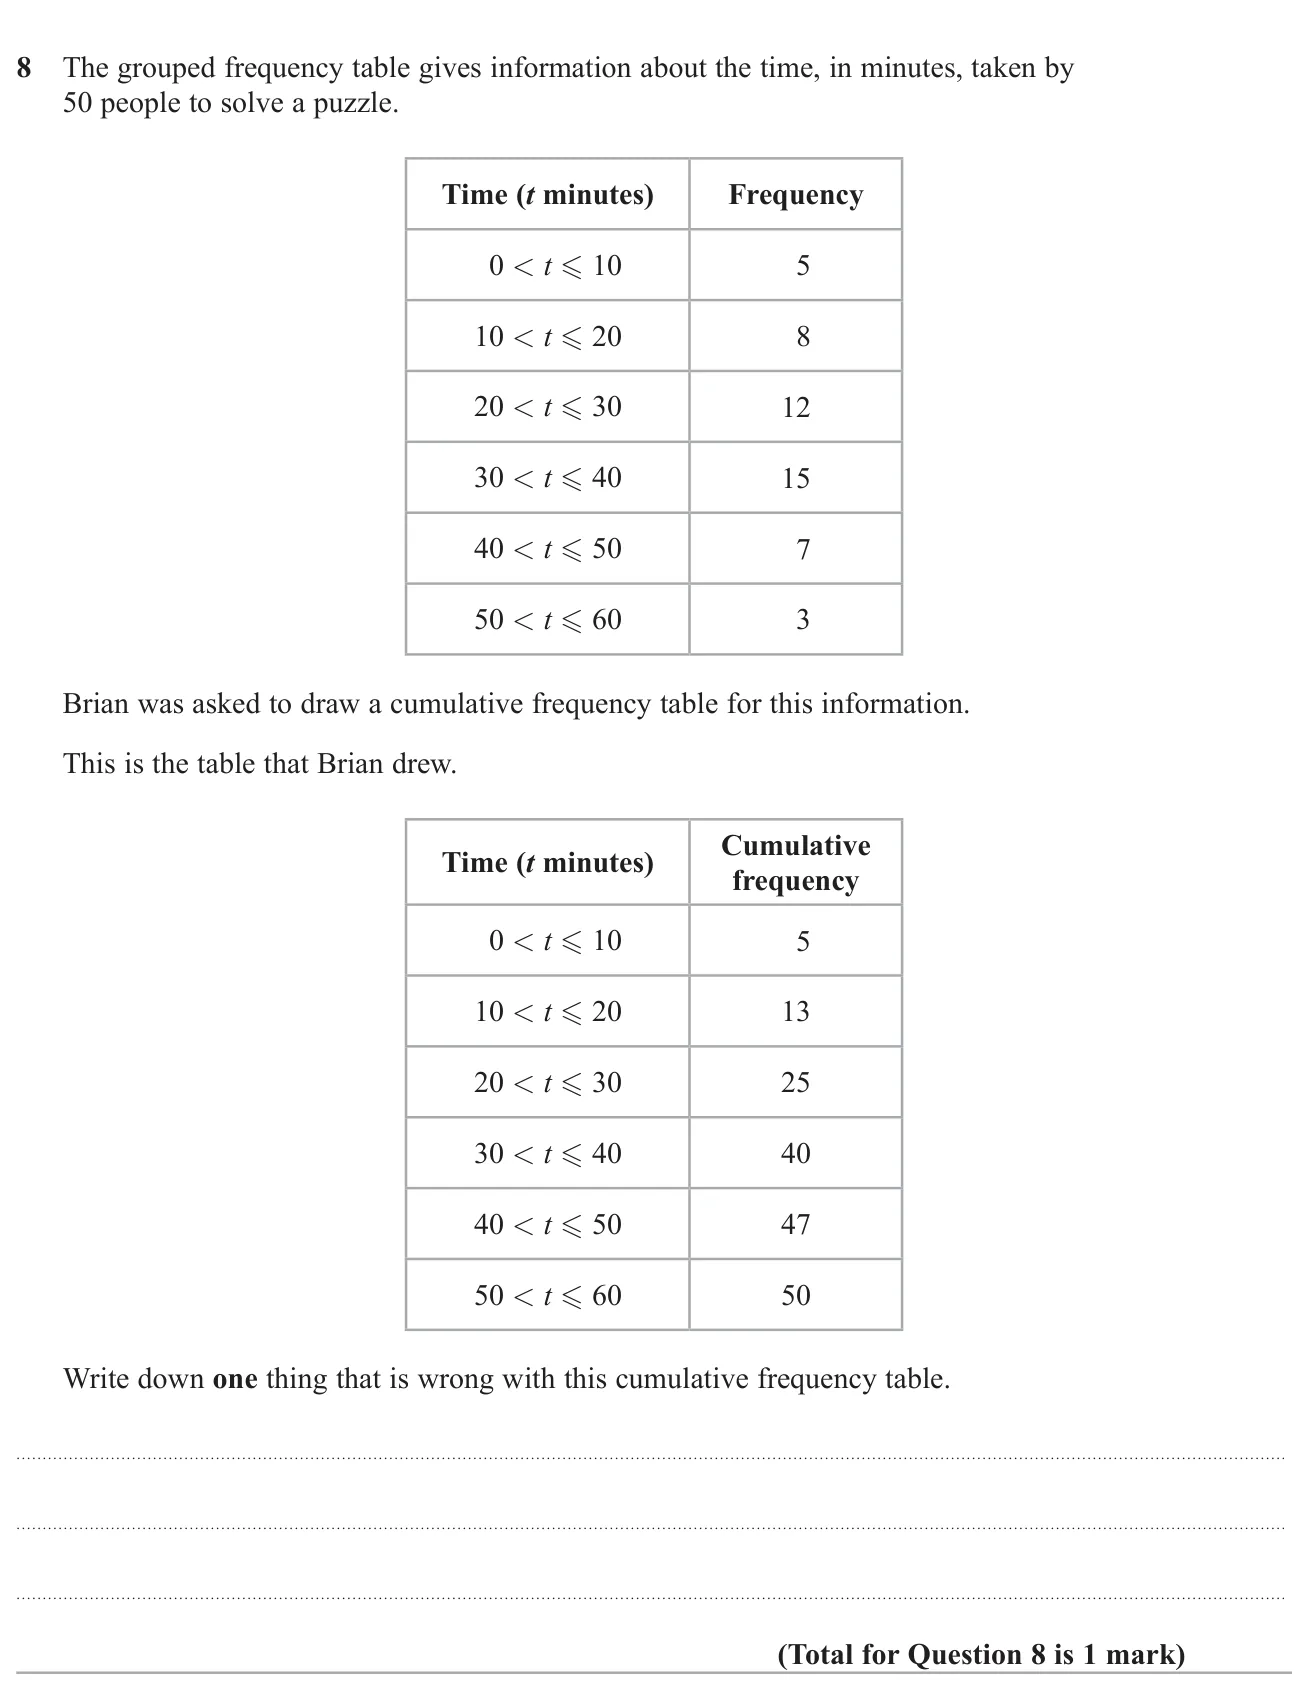
November 2021 · Paper 2 Higher · Q8
Spot what is wrong with a cumulative frequency table built from grouped data.

© Pearson Education Ltd. November 2021 Paper 2 (Higher, calculator), question 8.

Show answer
AnswerThe class intervals are wrong: each should start at 0, e.g. 0<t≤200 < t \le 20 not 10<t≤2010 < t \le 201 mark

Worked solution Checked against the mark scheme

Cumulative frequency counts everyone up to the end of each class.

So 13 is the number with t≤20t \le 20, which covers 0<t≤200 < t \le 20, not just 10<t≤2010 < t \le 20.

The running totals are right, but every interval after the first should start at 0.

Watch out: Saying the totals have been added wrongly, when the totals are correct.

Cumulative frequency6 marksGrade 6No calculatorHigher
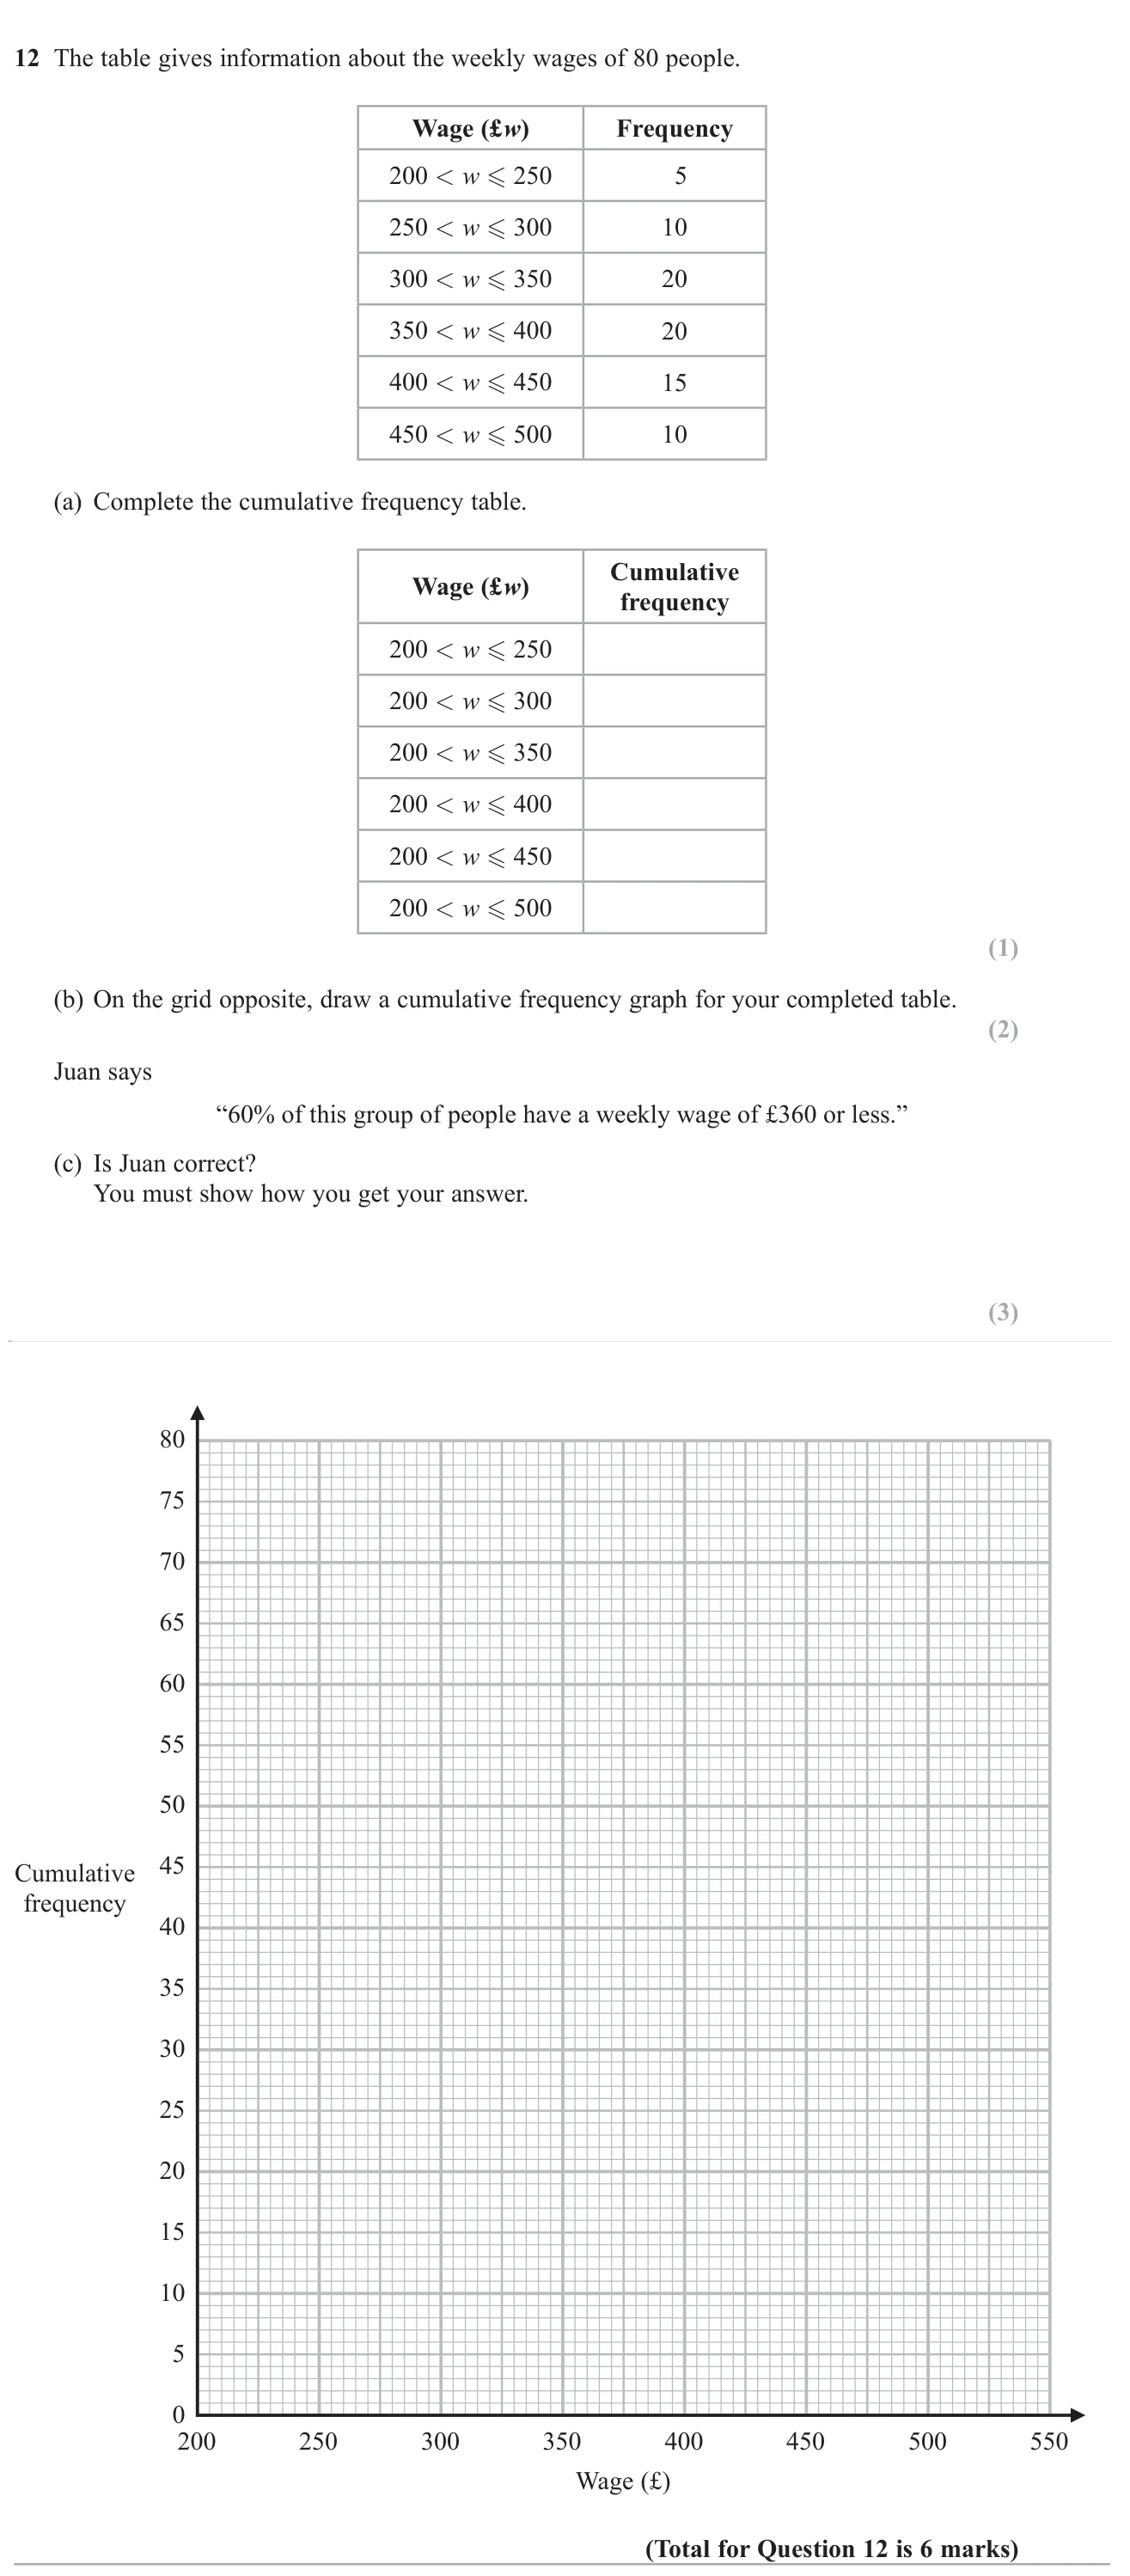
November 2020 · Paper 1 Higher · Q12
Complete a cumulative frequency table for wages, draw the graph, and use it to test a claim about 60% of people.

© Pearson Education Ltd. November 2020 Paper 1 (Higher, non-calculator), question 12.

Show answer
(a)5, 15, 35, 55, 70, 801 mark
(b)Points plotted at (250, 5), (300, 15), (350, 35), (400, 55), (450, 70), (500, 80), joined with a smooth curve or straight segments2 marks
(c)No: 60% is 48 people, but only about 40 people earn £360 or less (about 50%)3 marks

Worked solution Checked against the mark scheme

(a) Add the frequencies as you go: 5, 15, 35, 55, 70, 80

(b) Plot each total at the top of its class (250, 300, ..., 500) and join the points.

(c) 60% of 80 =0.6×80=48= 0.6 \times 80 = 48 people.

Reading the graph at £360 gives about 40 people, which is 4080=50%\frac{40}{80} = 50\%.

So Juan is wrong: only about 50% earn £360 or less.

Watch out: Plotting the points at the midpoints of the classes instead of the upper boundaries.

Cumulative frequency6 marksGrade 6No calculatorHigher
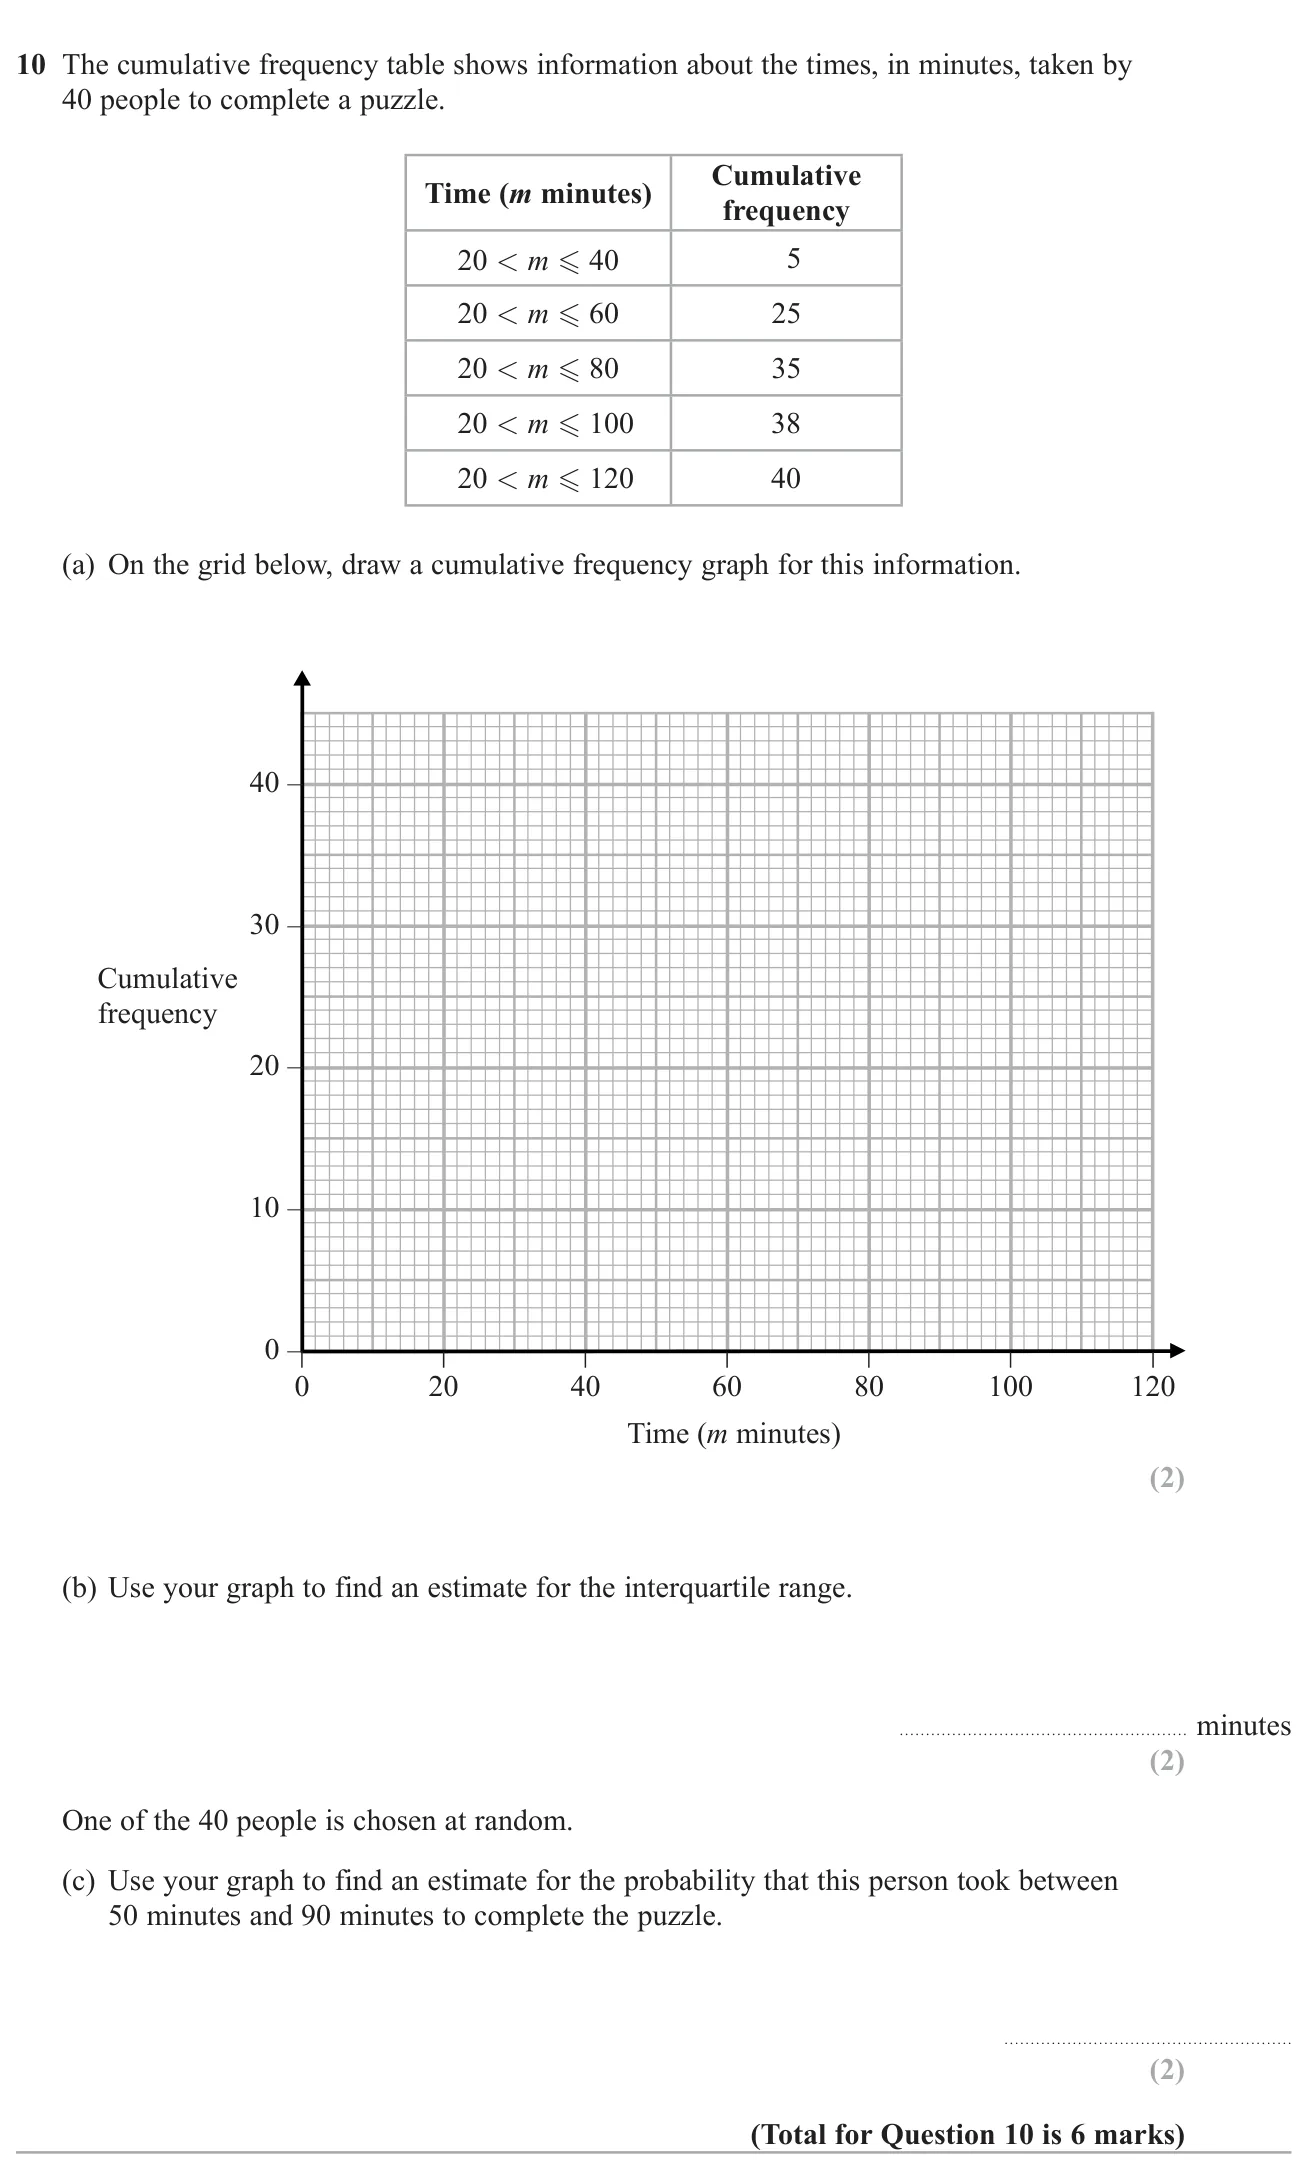
November 2019 · Paper 1 Higher · Q10
Draw a cumulative frequency graph, then use it to estimate the interquartile range and a probability.

© Pearson Education Ltd. November 2019 Paper 1 (Higher, non-calculator), question 10.

Show answer
(a)Graph through (40, 5), (60, 25), (80, 35), (100, 38), (120, 40)2 marks
(b)About 25 minutes (21 to 28)2 marks
(c)About 21.540\frac{21.5}{40} (between 1940\frac{19}{40} and 2440\frac{24}{40})2 marks

Worked solution Checked against the mark scheme

(a) Plot each cumulative frequency at the end of its interval and join with a smooth curve or straight lines, starting at (20, 0).

(b) LQ at cf=10cf = 10: about 45; UQ at cf=30cf = 30: about 70

IQR ≈70−45=25\approx 70 - 45 = 25 minutes

(c) At 90: cf≈36.5cf \approx 36.5; at 50: cf≈15cf \approx 15

36.5−15=21.536.5 - 15 = 21.5, so probability ≈21.540≈0.54\approx \frac{21.5}{40} \approx 0.54

Watch out: Plotting points at the middle of each interval instead of the upper end.

Cumulative frequency6 marksGrade 6CalculatorHigher
June 2019 · Paper 2 Higher · Q11
Build a cumulative frequency table for journey times, plot the curve, and use it to estimate the percentage taking over 90 minutes.

© Pearson Education Ltd. June 2019 Paper 2 (Higher, calculator), question 11.

Show answer
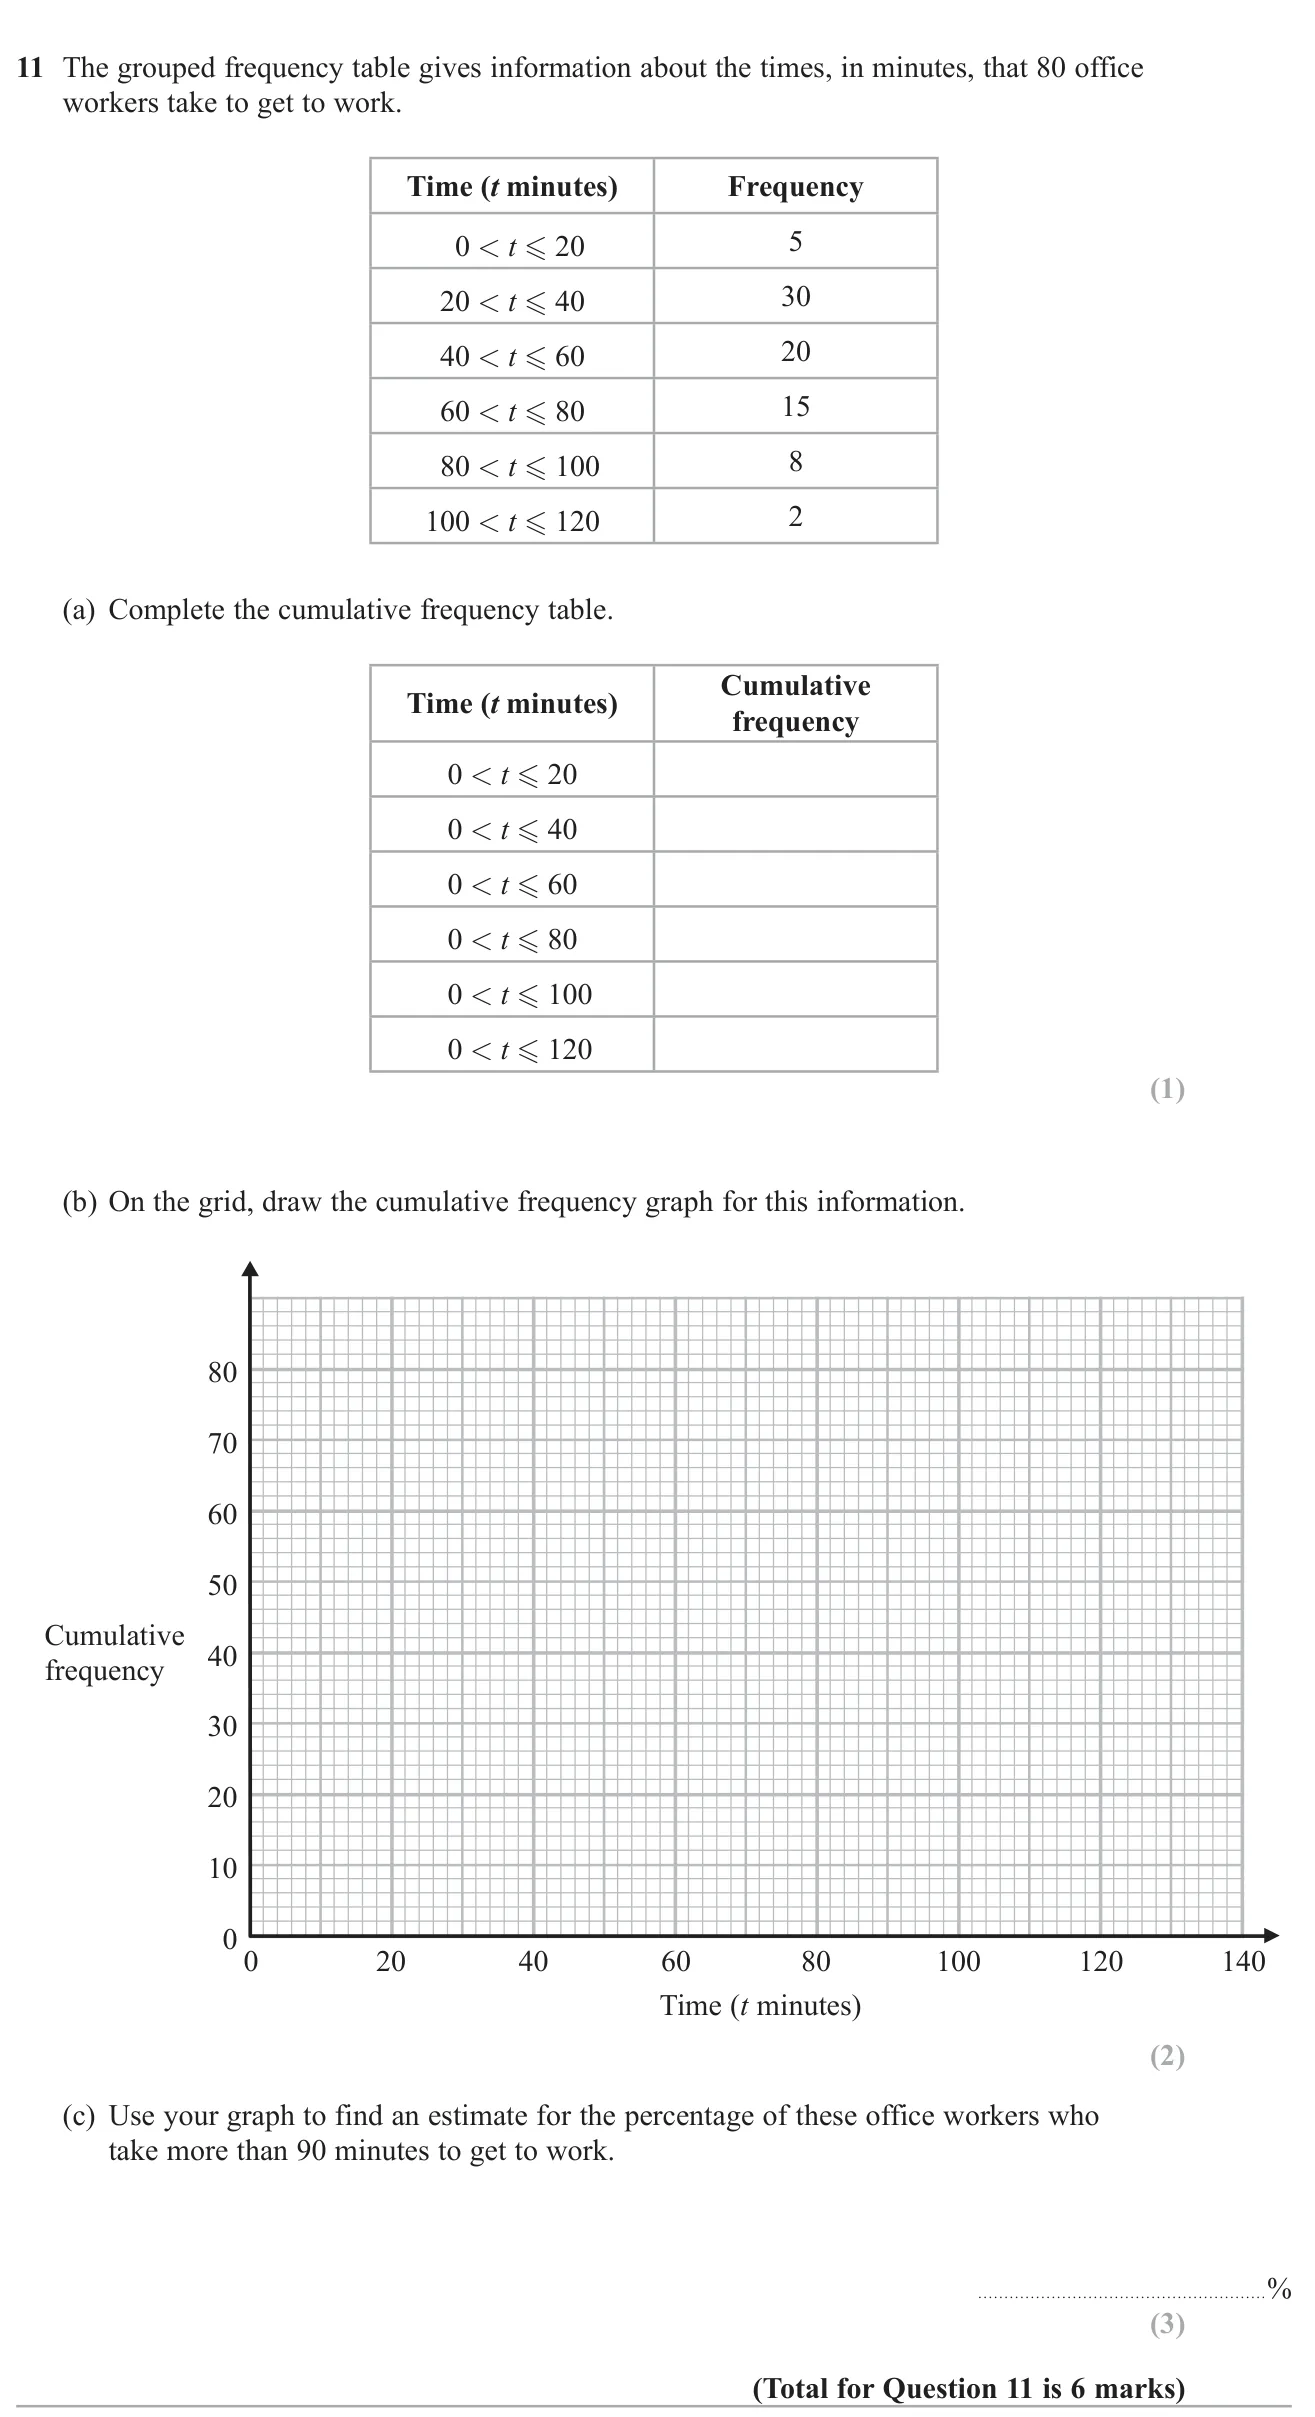
(a)5,35,55,70,78,805, 35, 55, 70, 78, 801 mark
(b)Cumulative frequency graph through (20,5),(40,35),(60,55),(80,70),(100,78),(120,80)(20,5), (40,35), (60,55), (80,70), (100,78), (120,80)2 marks
(c)7.5%7.5\% (5% to 10% from the reading)3 marks

Worked solution Checked against the mark scheme

(a) Add the frequencies as you go: 5,5+30=35,55,70,78,805, 5+30=35, 55, 70, 78, 80.

(b) Plot each total at the top of its interval, e.g. (40,35)(40, 35), and join with a smooth curve.

(c) At t=90t = 90 the graph reads about 74, so 80−74=680 - 74 = 6 workers take longer.

680×100=7.5%\frac{6}{80} \times 100 = 7.5\%

Watch out: Plotting points at the middle of each interval instead of the upper end.

Also tested in these questions

Their main topic is different, but part of each one tests this topic.