Statistics

Histograms

13 past-paper questions, easiest first. Try each one, then reveal the answer.

Higher only

Revision guide by The Full Marks

Histograms: what you need to know

A histogram looks like a bar chart but the area of each bar, not its height, shows the frequency. This lets you draw classes of different widths fairly. It is a Higher-only topic worth several marks.

Key facts

  • Frequency density =frequencyclass width= \frac{\text{frequency}}{\text{class width}}.
  • Frequency == frequency density ×\times class width (the area of the bar).
  • The vertical axis is labelled 'frequency density', never 'frequency'.
  • Bars touch, and there are no gaps, because the data is continuous.

Drawing a histogram

  1. Work out each class width.
  2. Divide each frequency by its class width to get the frequency density.
  3. Draw bars with the class boundaries as edges and frequency density as heights.

Finding frequencies from a histogram

  1. Read the frequency density of the bar.
  2. Multiply by the class width.
  3. For part of a bar, multiply by just the width of the part you need.

Estimating the median or a quartile

  1. Work out its position, e.g. the median is about the n2\frac{n}{2}th value.
  2. Add up the bar frequencies from the left until you reach the bar it lies in.
  3. Go into that bar the right fraction of its width.

Worked examples

Example 1 Higher · grade 6

Find the frequency densities for this table of heights, hh cm:
0<h≤100 < h \le 10: 15
10<h≤1510 < h \le 15: 20
15<h≤2515 < h \le 25: 30
25<h≤4525 < h \le 45: 16

Show the solution

Class widths: 10, 5, 10, 20
15 ÷ 10 = 1.5
20 ÷ 5 = 4
30 ÷ 10 = 3
16 ÷ 20 = 0.8

Example 2 Higher · grade 7

On a histogram, the bar for 20<x≤3020 < x \le 30 has frequency density 2.4 and the bar for 30<x≤5030 < x \le 50 has frequency density 1.5. Estimate how many values are between 25 and 40.

Show the solution

Frequency for 20<x≤3020 < x \le 30: 2.4×10=242.4 \times 10 = 24
Frequency for 30<x≤5030 < x \le 50: 1.5×20=301.5 \times 20 = 30
25 to 30 is half of the first bar: 24 ÷ 2 = 12
30 to 40 is half of the second bar: 30 ÷ 2 = 15
Estimate = 12 + 15 = 27

Example 3 Higher · grade 7

Use the table of heights in the first example (81 people) to estimate the median height.

Show the solution

Median position: 81÷2=40.581 \div 2 = 40.5
The first two classes hold 15+20=3515 + 20 = 35 people, so the median is 5.55.5 people into the 15<h≤2515 < h \le 25 class.
That class holds 30 people across 10 cm: 5.530×10=1.83…\frac{5.5}{30} \times 10 = 1.83\ldots
Median ≈15+1.83=16.8\approx 15 + 1.83 = 16.8 cm

Common mistakes

  • Plotting frequency instead of frequency density on the vertical axis.
  • Reading a bar's height as its frequency. Multiply by the width.
  • Using the wrong class width, for example 10 instead of 20 for 25<h≤4525 < h \le 45.

Exam tips

  • If the scale on the vertical axis is not labelled, use one bar with a known frequency to work it out.
  • Add a frequency density column to the table: it earns method marks and keeps your working tidy.

Questions people ask

How do you calculate frequency density?

Divide the frequency by the class width. For example, 30 values in a class 10 wide gives a frequency density of 3.

What is the difference between a histogram and a bar chart?

In a bar chart the height shows the frequency. In a histogram the area of the bar shows the frequency, so classes can have different widths.

Exam questions: Histograms (13, easiest first)

Histograms3 marksGrade 6No calculatorHigher
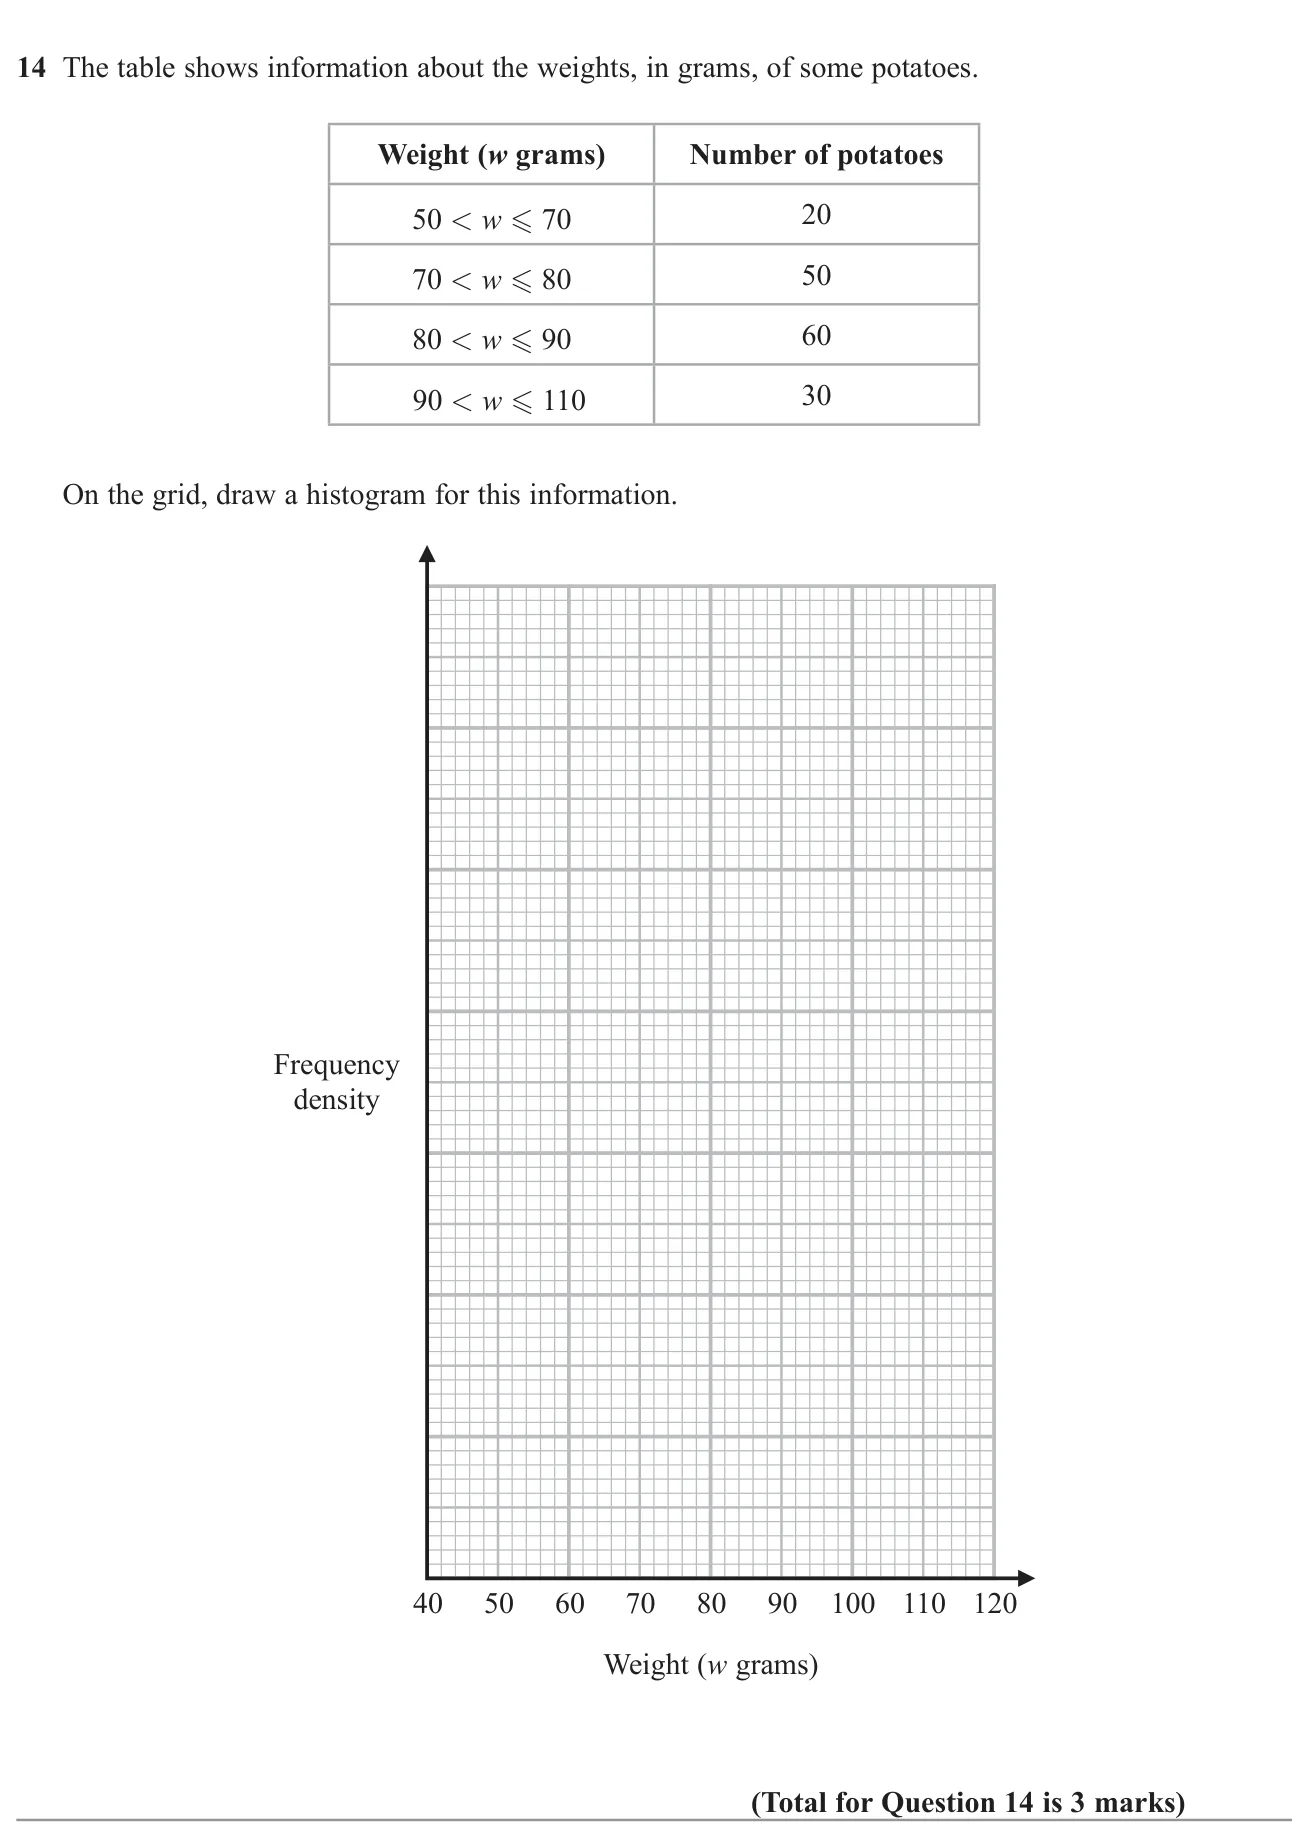
November 2022 · Paper 1 Higher · Q14
Draw a histogram from a grouped frequency table with unequal class widths.

© Pearson Education Ltd. November 2022 Paper 1 (Higher, non-calculator), question 14.

Show answer
AnswerBars with frequency densities 1, 5, 6 and 1.53 marks

Worked solution Checked against the mark scheme

Frequency density = frequency ÷ class width

5050–7070: 20÷20=120 \div 20 = 1

7070–8080: 50÷10=550 \div 10 = 5

8080–9090: 60÷10=660 \div 10 = 6

9090–110110: 30÷20=1.530 \div 20 = 1.5

Draw bars of these heights with the correct widths.

Watch out: Plotting the frequencies as bar heights.

Histograms4 marksGrade 6CalculatorHigher
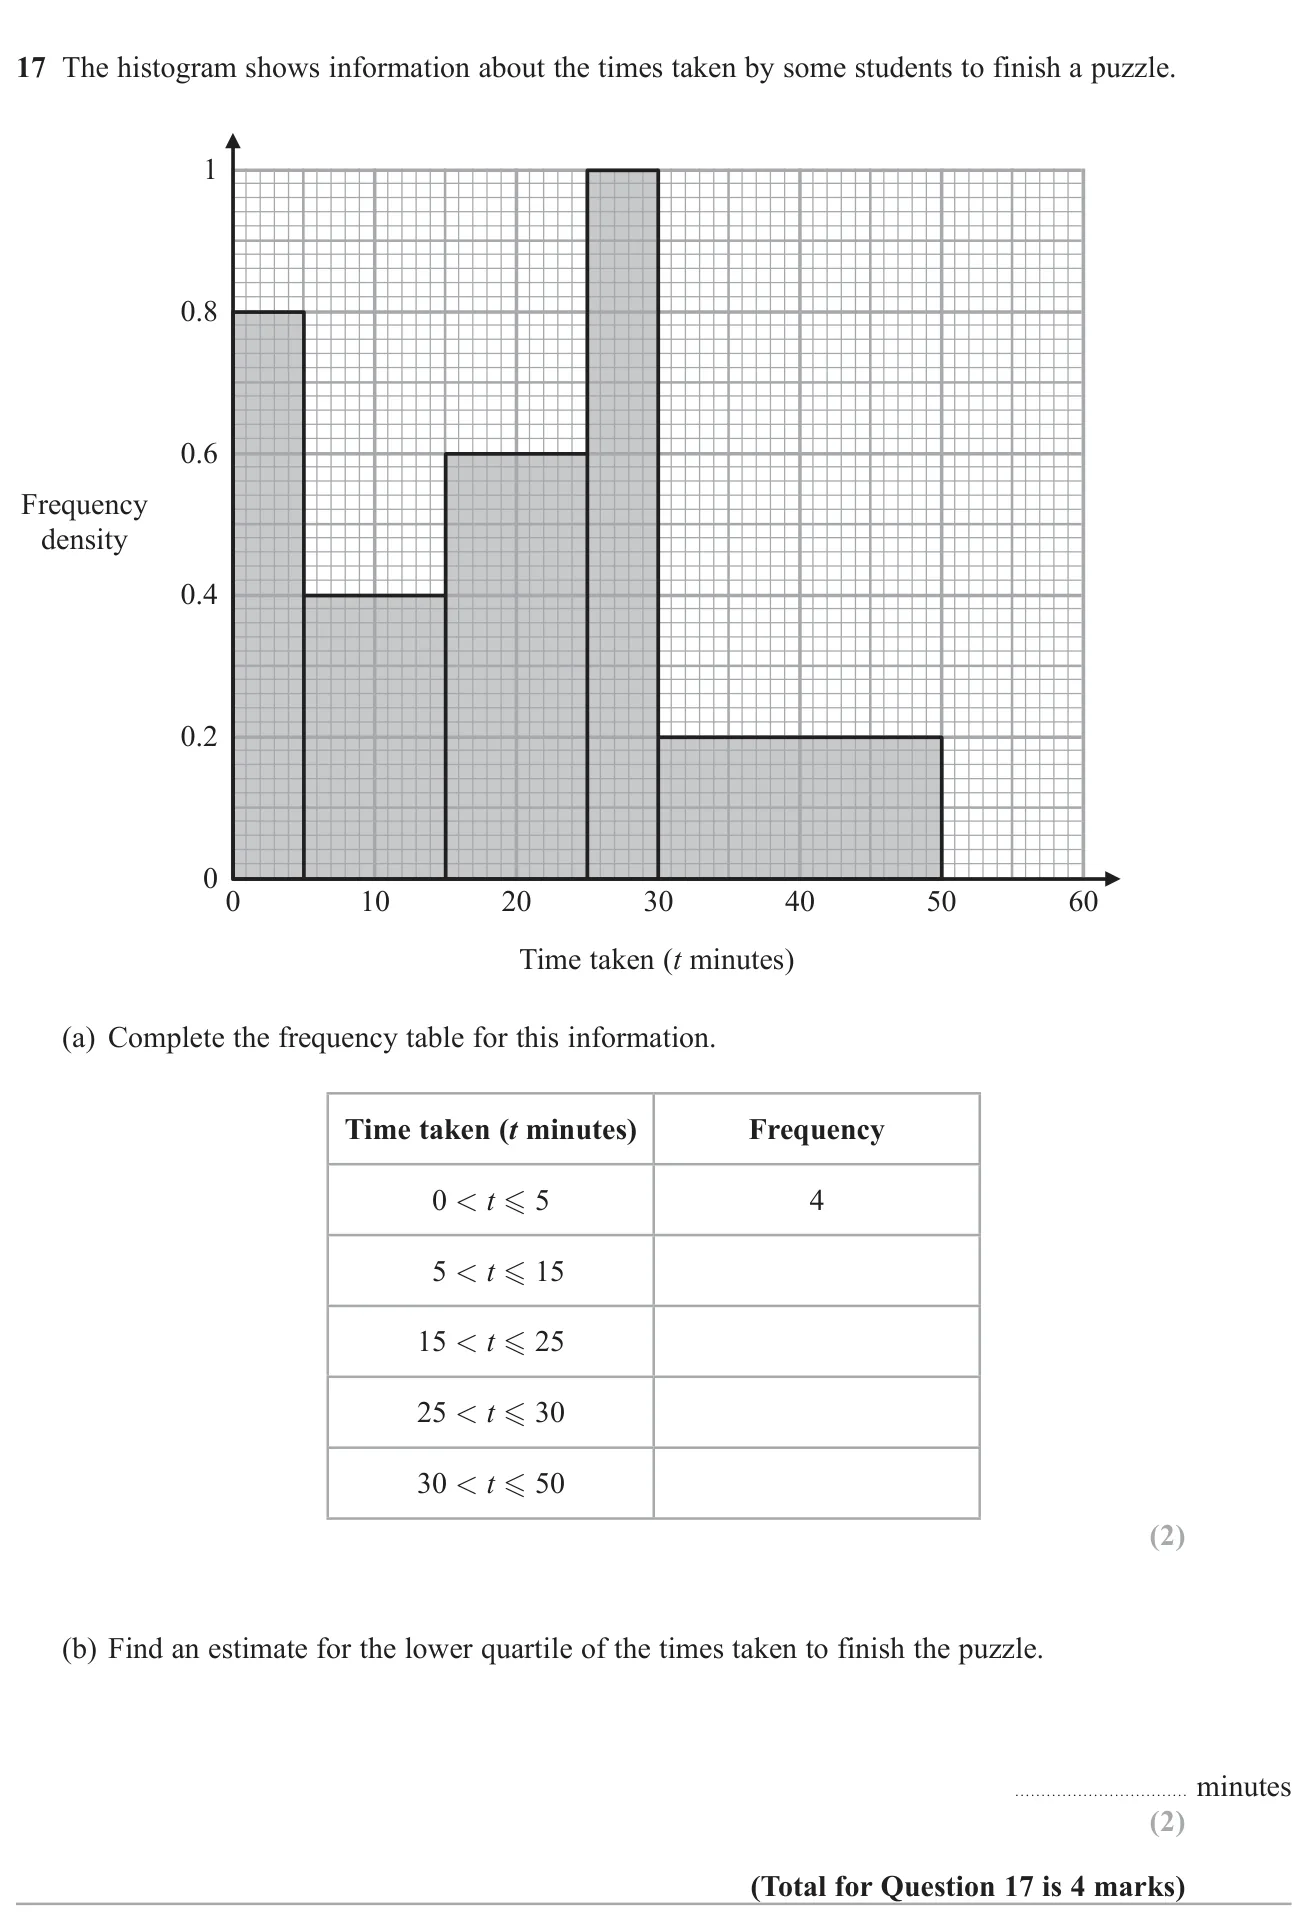
June 2018 · Paper 2 Higher · Q17
Read frequencies from a histogram with unequal class widths and estimate the lower quartile.

© Pearson Education Ltd. June 2018 Paper 2 (Higher, calculator), question 17.

Show answer
(a)4,6,5,44, 6, 5, 4 (for 5<t≤155<t\le15, 15<t≤2515<t\le25, 25<t≤3025<t\le30, 30<t≤5030<t\le50)2 marks
(b)1010 minutes2 marks

Worked solution Checked against the mark scheme

(a) Frequency = class width × frequency density:

10×0.4=410 \times 0.4 = 4, 10×0.6=610 \times 0.6 = 6, 5×1=55 \times 1 = 5, 20×0.2=420 \times 0.2 = 4

(b) Total =4+4+6+5+4=23= 4 + 4 + 6 + 5 + 4 = 23, so the lower quartile is the 23+14=6\frac{23+1}{4} = 6th value.

The first class holds 4 values, so we need 2 more from the 5<t≤155 < t \le 15 class, which holds 4 values over 10 minutes.

Lower quartile =5+24×10=10= 5 + \frac{2}{4} \times 10 = 10 minutes

Watch out: Reading the bar height as the frequency.

Histograms3 marksGrade 6CalculatorHigher
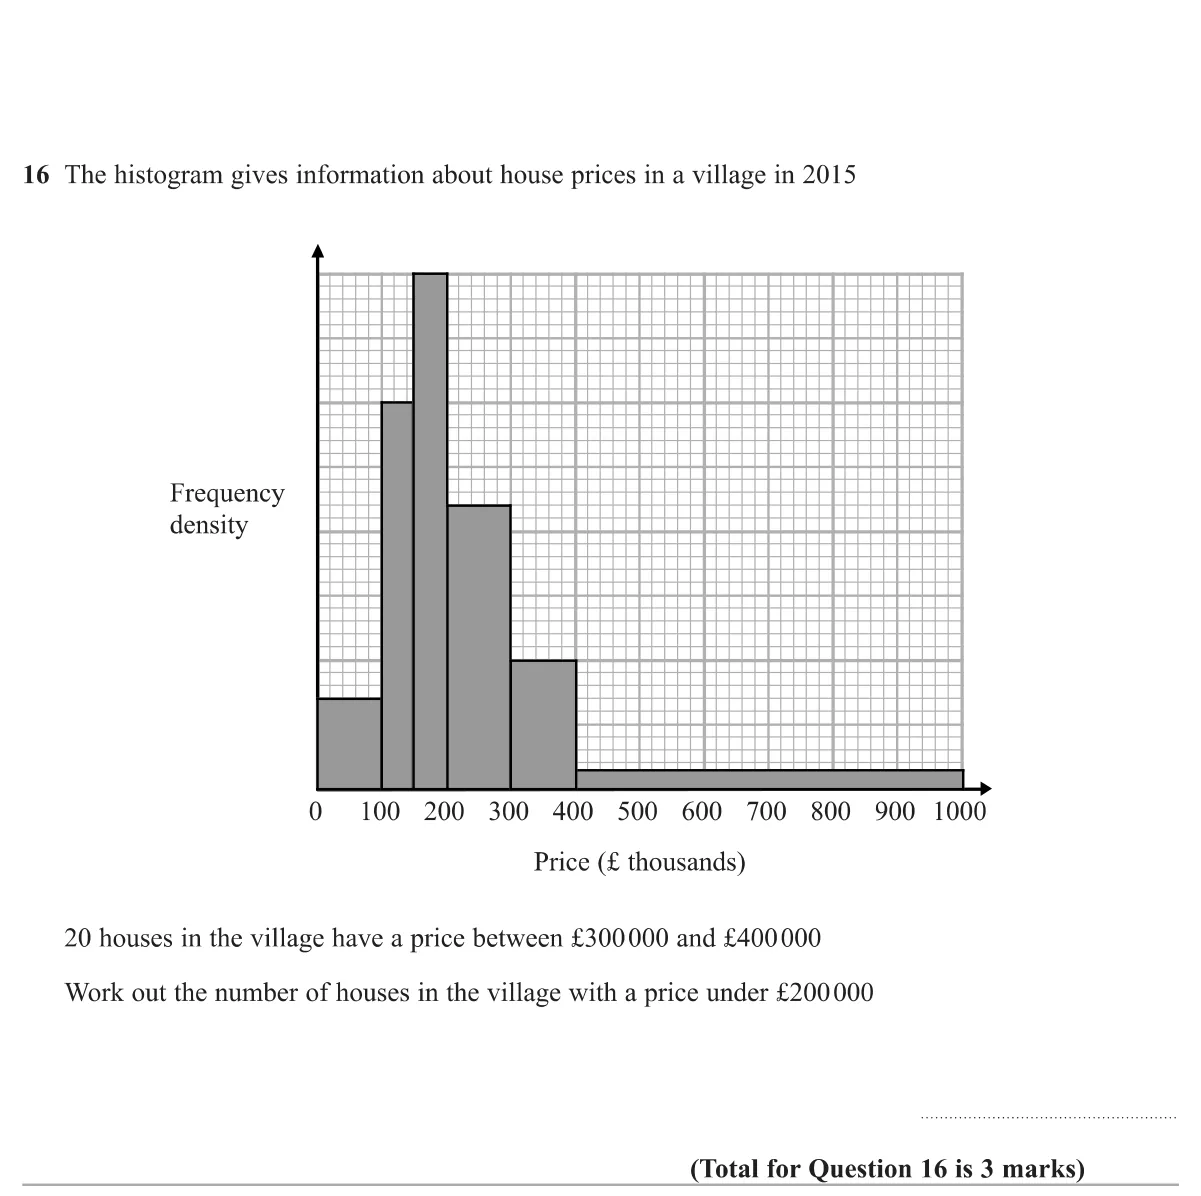
Specimen · Paper 2 Higher · Q16
Use one known bar of a histogram to set the scale and find how many houses cost under £200 000.

© Pearson Education Ltd. Specimen Paper 2 (Higher, calculator), question 16.

Show answer
Answer843 marks

Worked solution Checked against the mark scheme

The £300k–£400k bar holds 20 houses over a width of 100, so its height stands for 0.2 per £1000.

That sets the scale: the bar is 2 large squares tall, so each large square up is 0.1.

0–100: 0.14×100=140.14 \times 100 = 14

100–150: 0.6×50=300.6 \times 50 = 30

150–200: 0.8×50=400.8 \times 50 = 40

Total =14+30+40=84= 14 + 30 + 40 = 84

Watch out: Reading bar heights as frequencies, ignoring the different bar widths.

Histograms5 marksGrade 7No calculatorHigher
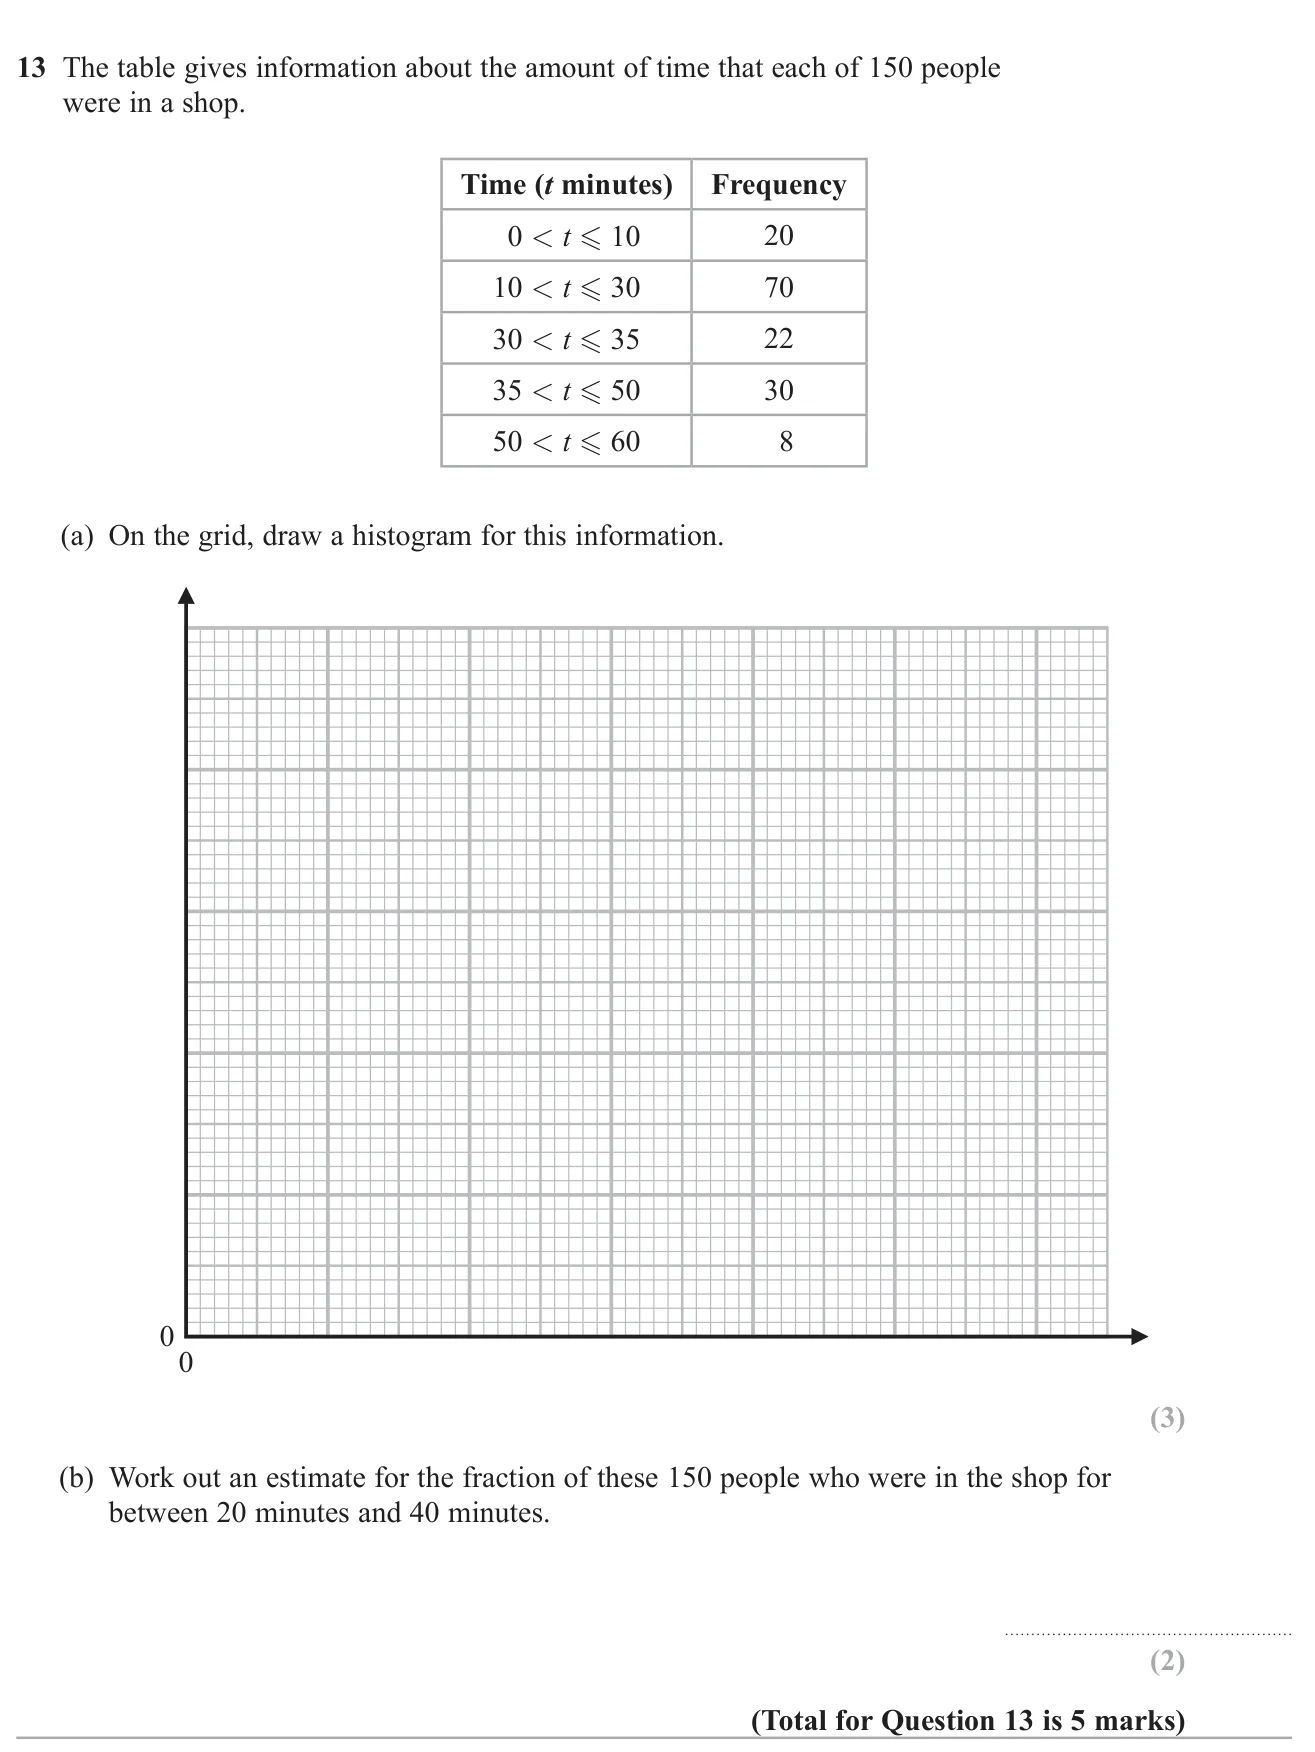
June 2024 · Paper 1 Higher · Q13
Draw a histogram from a grouped frequency table and use it to estimate the fraction of people in a time interval.

© Pearson Education Ltd. June 2024 Paper 1 (Higher, non-calculator), question 13.

Show answer
(a)Histogram with frequency densities 2, 3.5, 4.4, 2, 0.83 marks
(b)67150\frac{67}{150}2 marks

Worked solution Checked against the mark scheme

(a) Frequency density = frequency ÷ class width:

20÷10=220 \div 10 = 2, 70÷20=3.570 \div 20 = 3.5, 22÷5=4.422 \div 5 = 4.4, 30÷15=230 \div 15 = 2, 8÷10=0.88 \div 10 = 0.8

Draw bars of these heights with no gaps; label the vertical axis 'frequency density'.

(b) 20 to 30: half of 70 = 35; 30 to 35: 22; 35 to 40: 515\frac{5}{15} of 30 = 10

Total =35+22+10=67= 35 + 22 + 10 = 67, so the fraction is 67150\frac{67}{150}

Watch out: Plotting frequency instead of frequency density on the vertical axis.

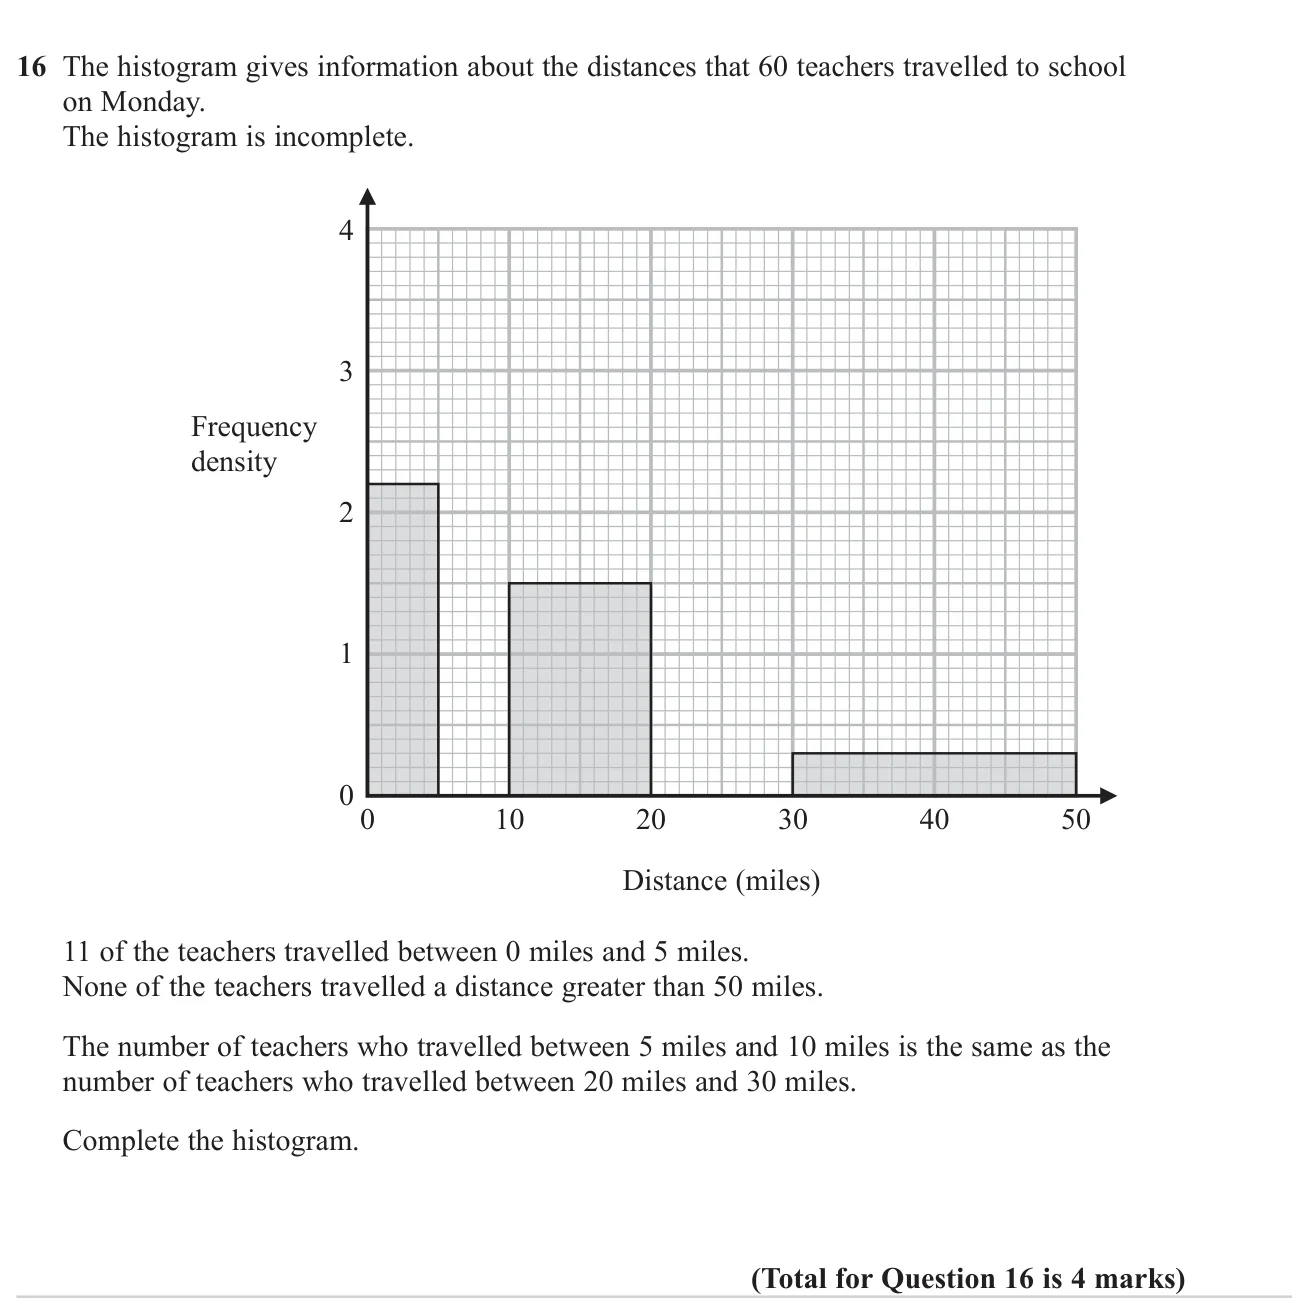
Histograms4 marksGrade 7CalculatorHigher
November 2024 · Paper 2 Higher · Q16
Use frequency densities and given facts about the totals to fill in the missing bars of a histogram.

© Pearson Education Ltd. November 2024 Paper 2 (Higher, calculator), question 16.

Show answer
AnswerBar 5–10 at frequency density 2.8 and bar 20–30 at frequency density 1.44 marks

Worked solution Checked against the mark scheme

Known frequencies: 0–5: 11; 10–20: 10×1.5=1510 \times 1.5 = 15; 30–50: 20×0.3=620 \times 0.3 = 6

Left: 60−11−15−6=2860 - 11 - 15 - 6 = 28, shared equally: 14 each.

5–10: 14÷5=2.814 \div 5 = 2.8; 20–30: 14÷10=1.414 \div 10 = 1.4

Watch out: Drawing bar heights as frequencies rather than frequency densities.

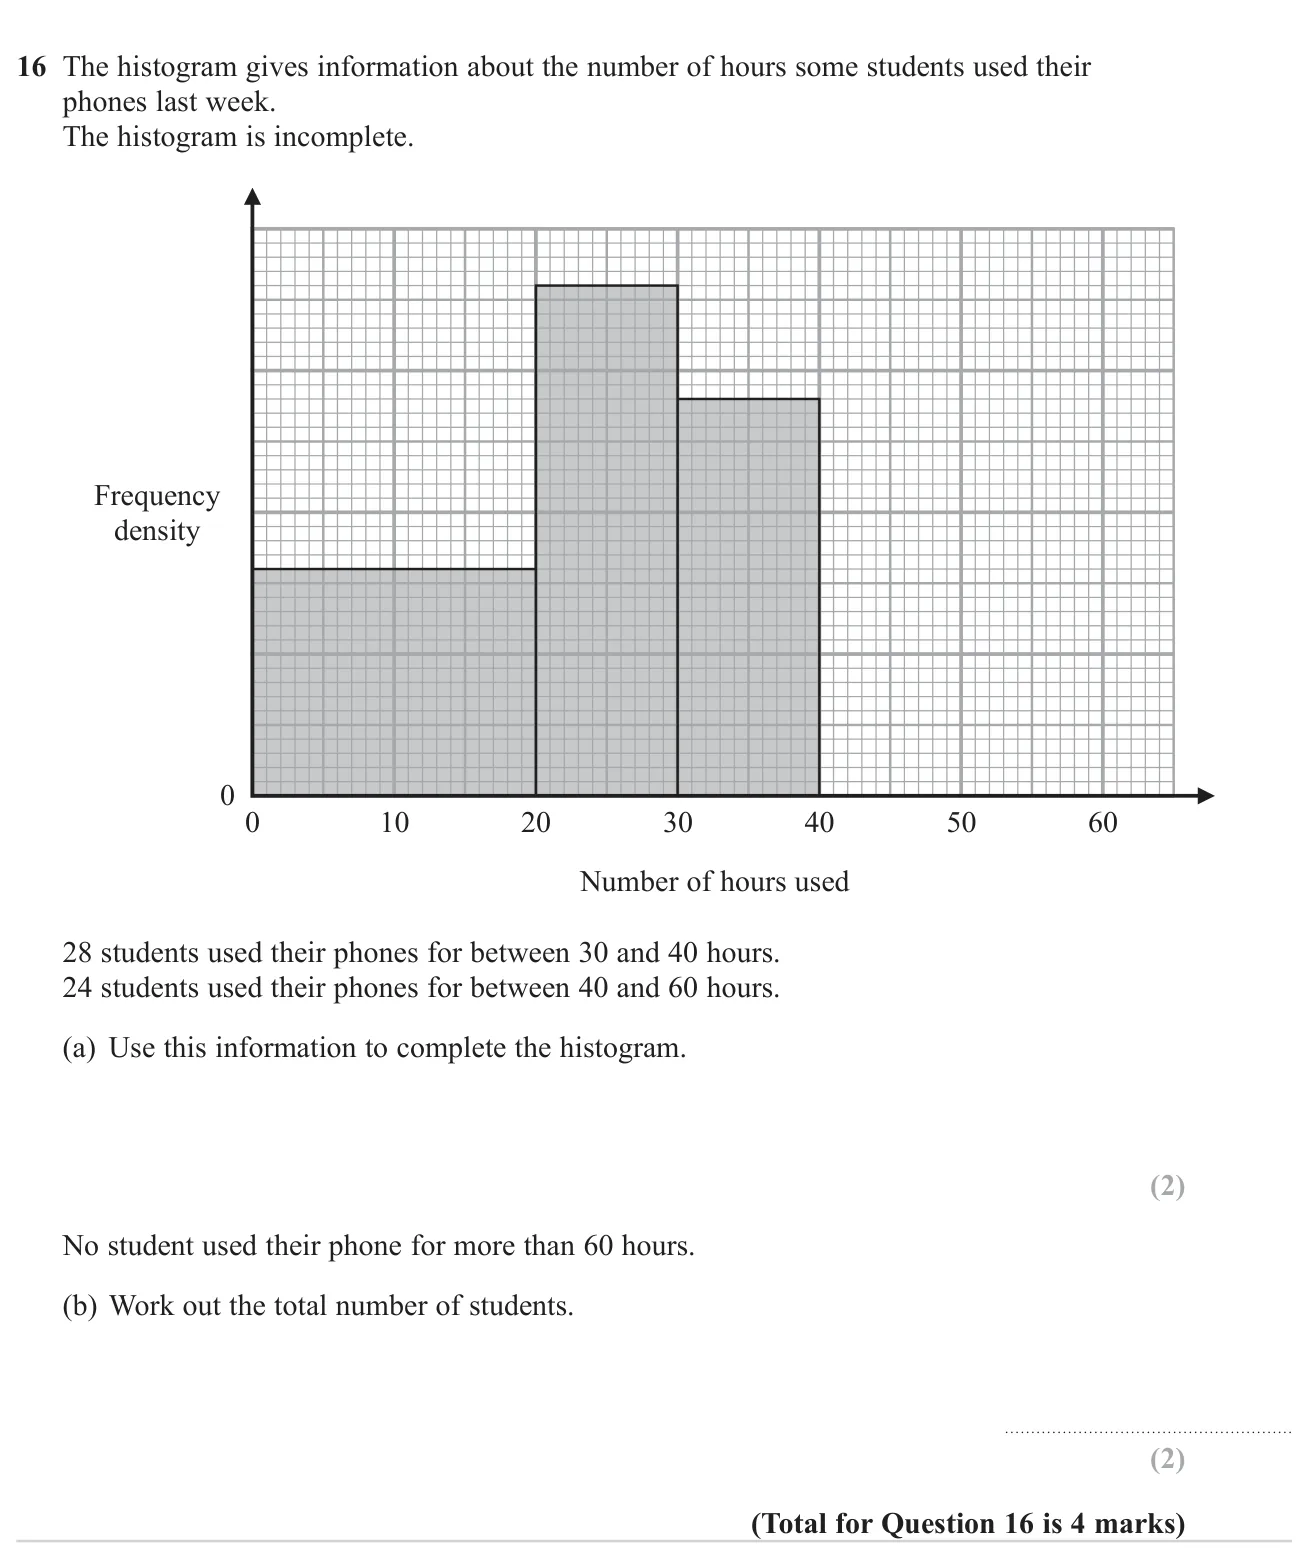
Histograms4 marksGrade 7CalculatorHigher
June 2023 · Paper 2 Higher · Q16
Use frequency density to add a missing bar to a histogram, then find the total frequency from all the bars.

© Pearson Education Ltd. June 2023 Paper 2 (Higher, calculator), question 16.

Show answer
(a)Bar from 40 to 60 at frequency density 1.21.22 marks
(b)1201202 marks

Worked solution Checked against the mark scheme

(a) The 30–40 bar holds 28 students, so its fd is 28÷10=2.828 \div 10 = 2.8: this sets the vertical scale.

For 40–60: fd =24÷20=1.2= 24 \div 20 = 1.2, so draw a bar of height 1.2 from 40 to 60.

(b) 0–20: fd 1.6, so 1.6×20=321.6 \times 20 = 32. 20–30: fd 3.6, so 3.6×10=363.6 \times 10 = 36.

Total =32+36+28+24=120= 32 + 36 + 28 + 24 = 120

Watch out: Drawing the 40–60 bar with height 24 instead of dividing by the class width.

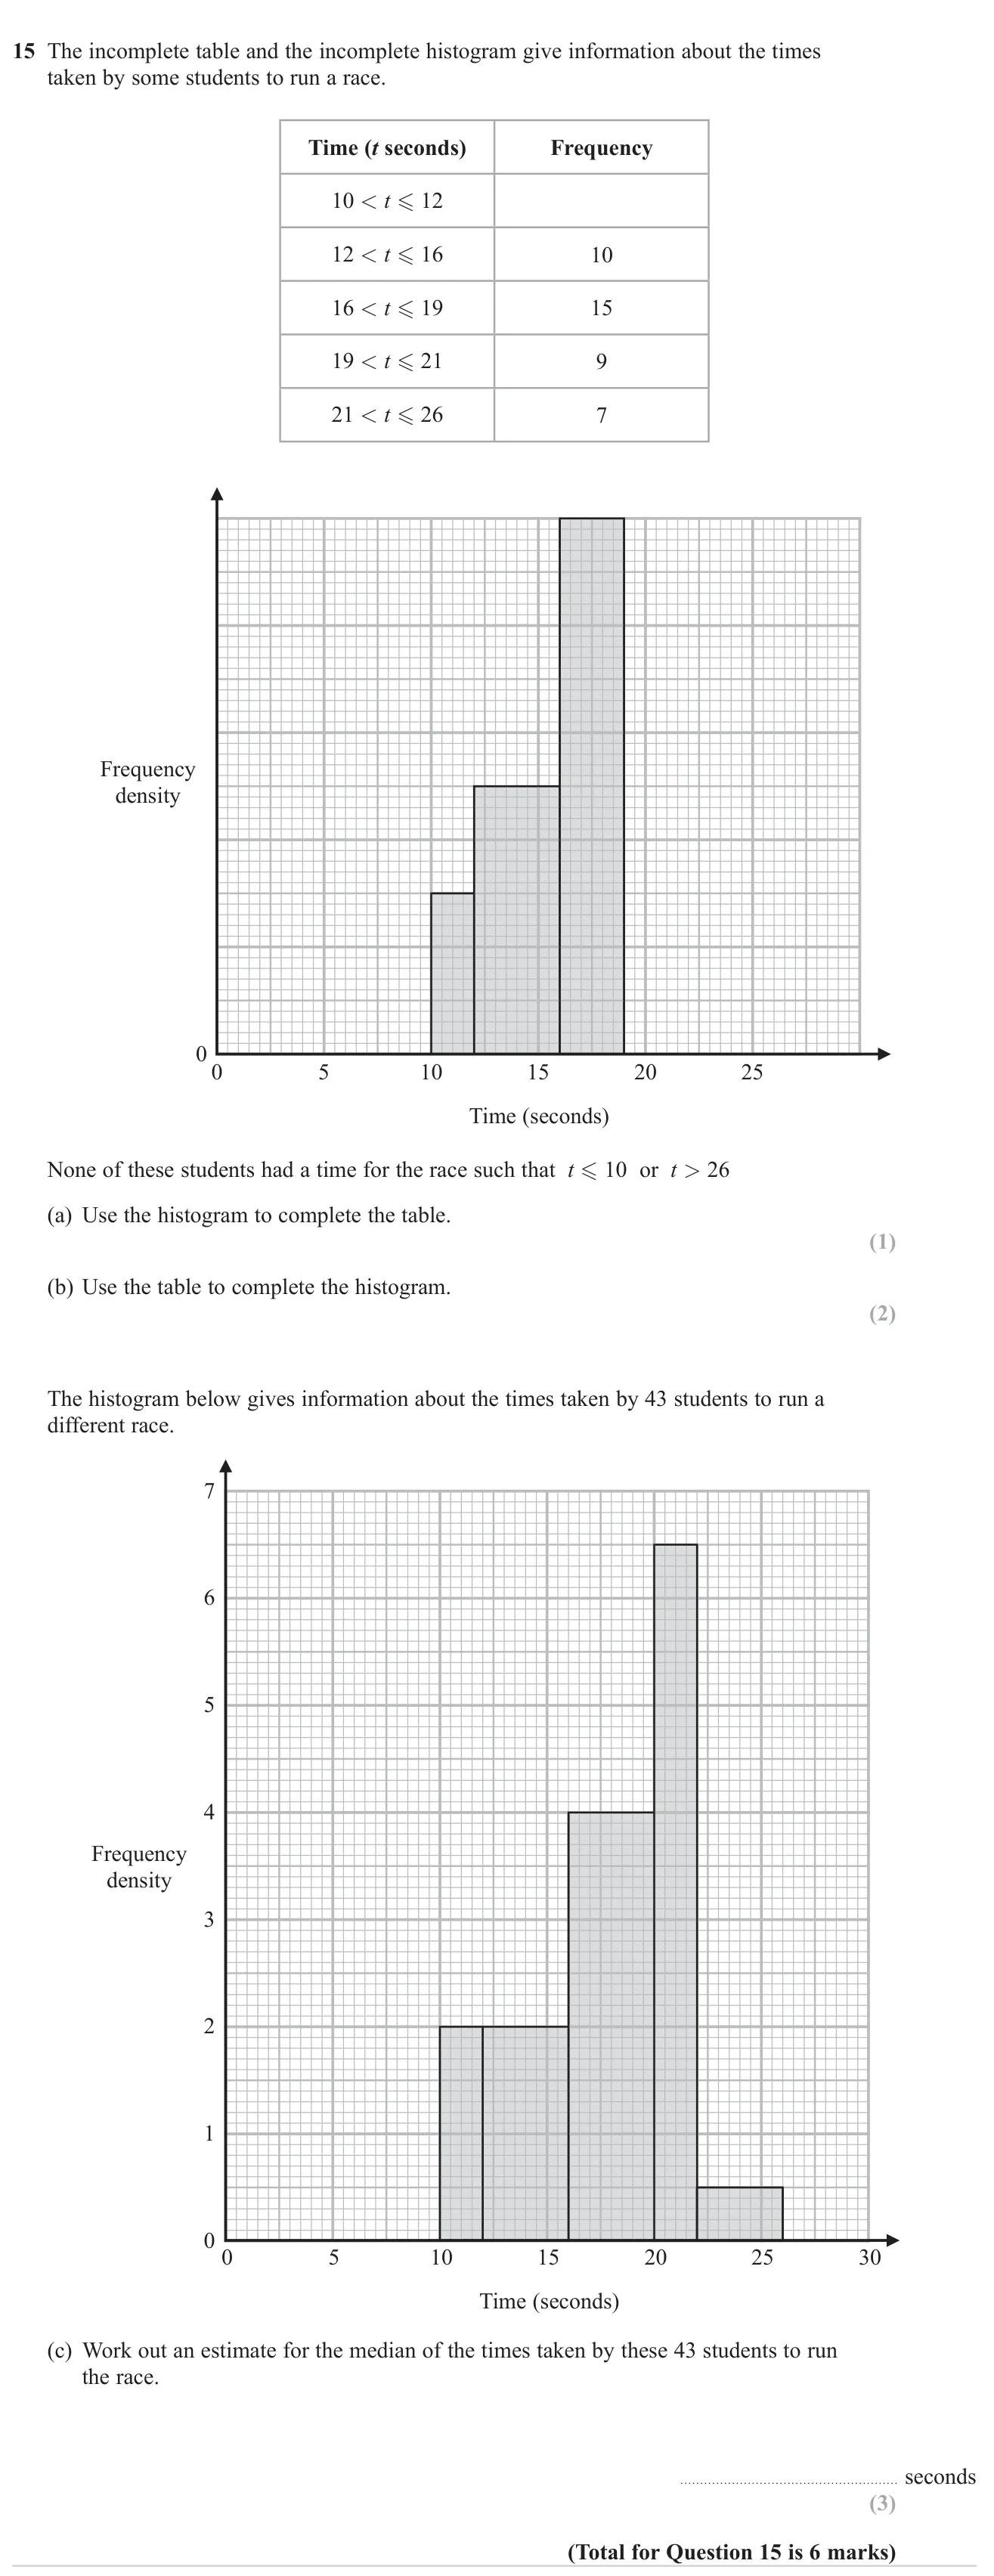
Histograms6 marksGrade 7CalculatorHigher
November 2023 · Paper 2 Higher · Q15
Complete a frequency table and histogram from each other, then estimate a median from a second histogram.

© Pearson Education Ltd. November 2023 Paper 2 (Higher, calculator), question 15.

Show answer
(a)331 mark
(b)Bars of frequency density 4.5 for 19<t≤2119 < t \le 21 and 1.4 for 21<t≤2621 < t \le 262 marks
(c)18.518.5 seconds3 marks

Worked solution Checked against the mark scheme

(a) The 12–16 bar has frequency 10 and width 4, so its frequency density is 2.5. The 10–12 bar is 1.5 high, so its frequency is 1.5×2=31.5 \times 2 = 3.

(b) 9÷2=4.59 \div 2 = 4.5 and 7÷5=1.47 \div 5 = 1.4, so draw bars of those heights.

(c) Frequencies: 4,8,16,13,24, 8, 16, 13, 2 (total 43). The median is the 22nd value. After 16 s there are 12 students, so we need 10 more of the 16 in the 16–20 class: 16+1016×4=18.516 + \frac{10}{16} \times 4 = 18.5 seconds.

Watch out: Using bar heights as frequencies instead of frequency density × class width.

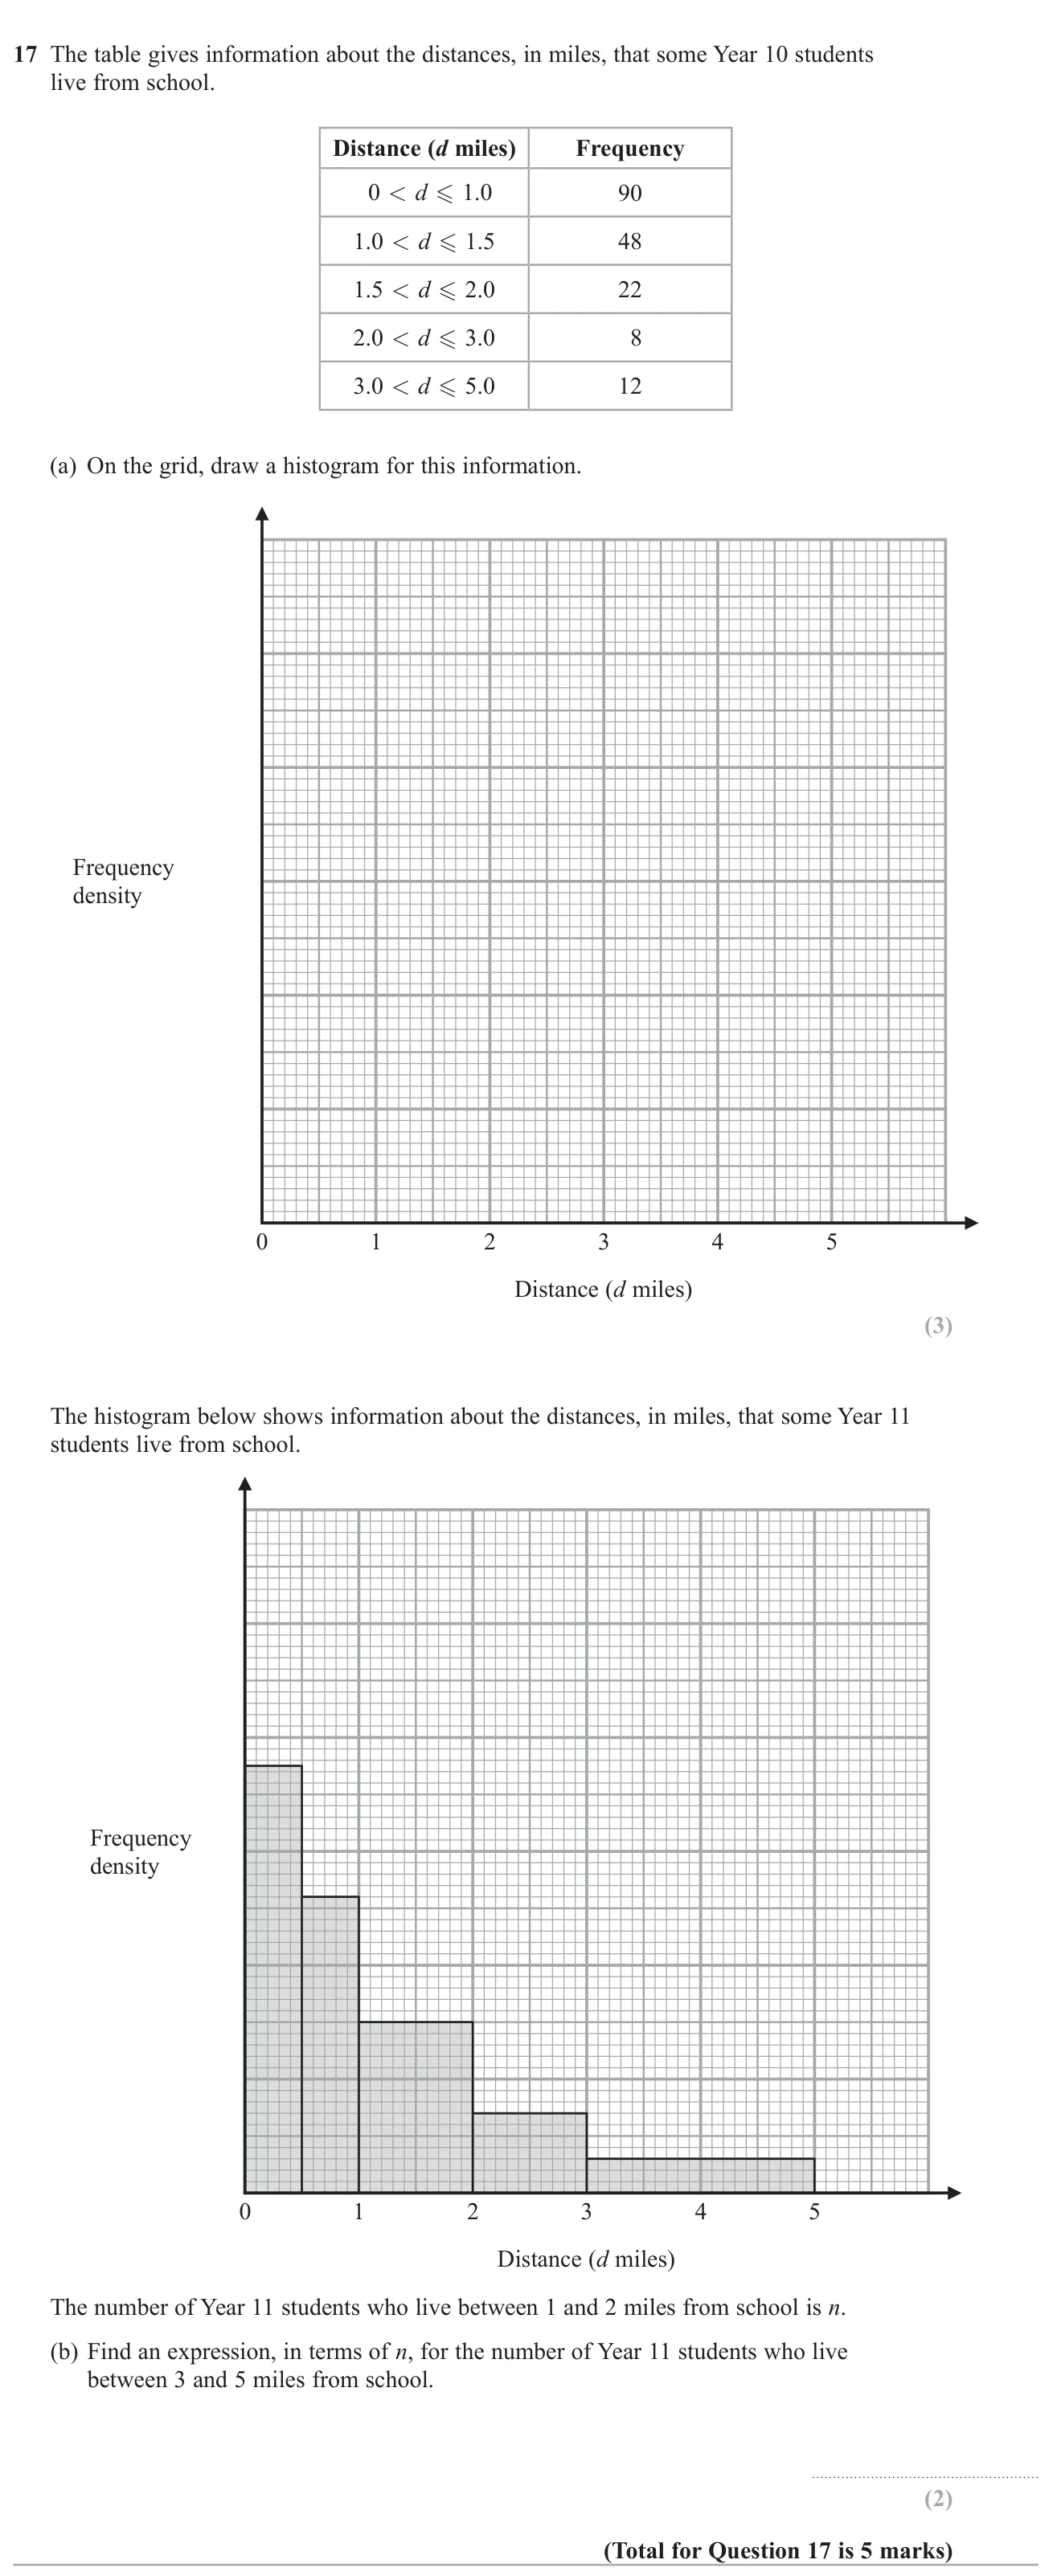
Histograms5 marksGrade 7CalculatorHigher
June 2022 · Paper 3 Higher · Q17
Draw a histogram from grouped data with unequal widths, then use a given histogram to express one class frequency in terms of another.

© Pearson Education Ltd. June 2022 Paper 3 (Higher, calculator), question 17.

Show answer
(a)Bars with frequency densities 90, 96, 44, 8 and 6 over the correct class widths3 marks
(b)0.4n0.4n2 marks

Worked solution Checked against the mark scheme

(a) Frequency density = frequency ÷ class width:

90÷1=9090\div1 = 90, 48÷0.5=9648\div0.5 = 96, 22÷0.5=4422\div0.5 = 44, 8÷1=88\div1 = 8, 12÷2=612\div2 = 6

(b) On the grid, the 1–2 bar is 5 times as tall as the 3–5 bar, but the 3–5 bar is twice as wide.

Area ratio =5×1:1×2=5:2= 5\times1 : 1\times2 = 5 : 2

So the number is 25n=0.4n\frac{2}{5}n = 0.4n

Watch out: Drawing bar heights equal to the frequencies instead of the frequency densities.

Histograms4 marksGrade 7CalculatorHigher
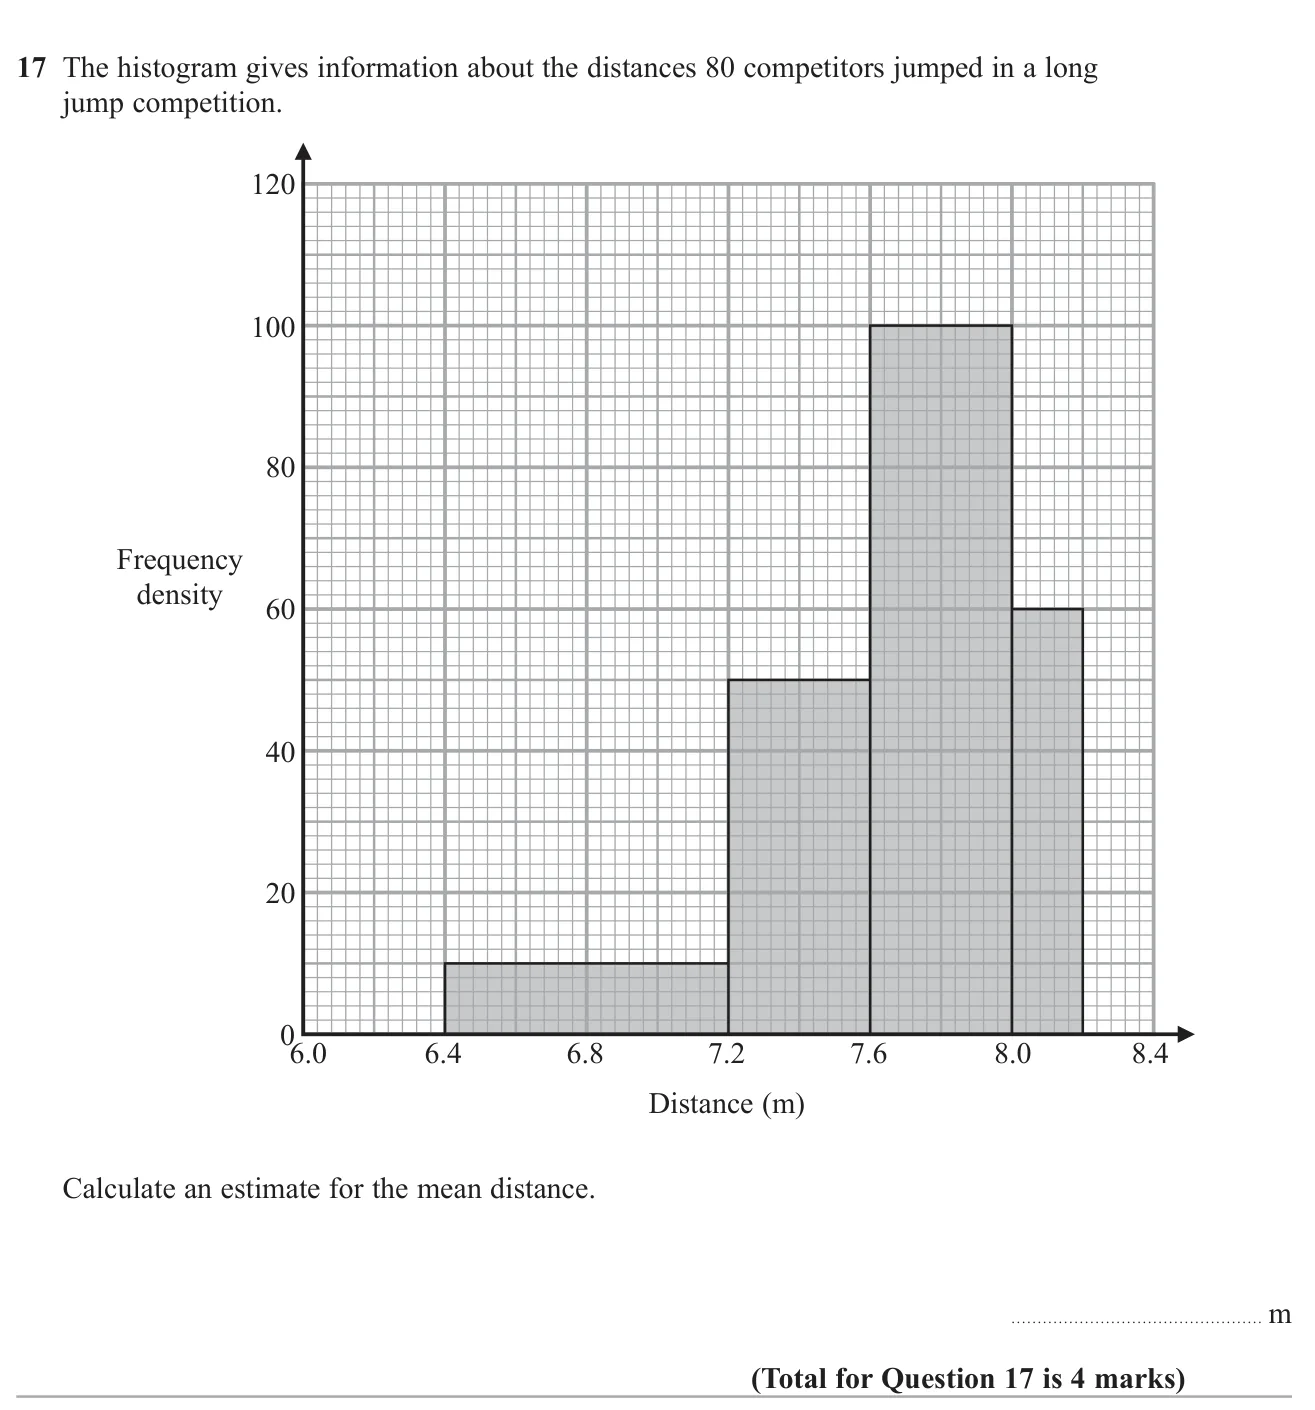
November 2020 · Paper 3 Higher · Q17
Work out class frequencies from a histogram and use midpoints to estimate the mean long-jump distance.

© Pearson Education Ltd. November 2020 Paper 3 (Higher, calculator), question 17.

Show answer
Answer7.6457.645 m (accept 7.65)4 marks

Worked solution Checked against the mark scheme

Frequencies = width × density:

0.8×10=80.8 \times 10 = 8, 0.4×50=200.4 \times 50 = 20, 0.4×100=400.4 \times 100 = 40, 0.2×60=120.2 \times 60 = 12 (total 80)

Mean =6.8×8+7.4×20+7.8×40+8.1×1280=611.680=7.645= \frac{6.8 \times 8 + 7.4 \times 20 + 7.8 \times 40 + 8.1 \times 12}{80} = \frac{611.6}{80} = 7.645 m

Watch out: Using the frequency densities as frequencies.

Histograms3 marksGrade 7CalculatorHigher
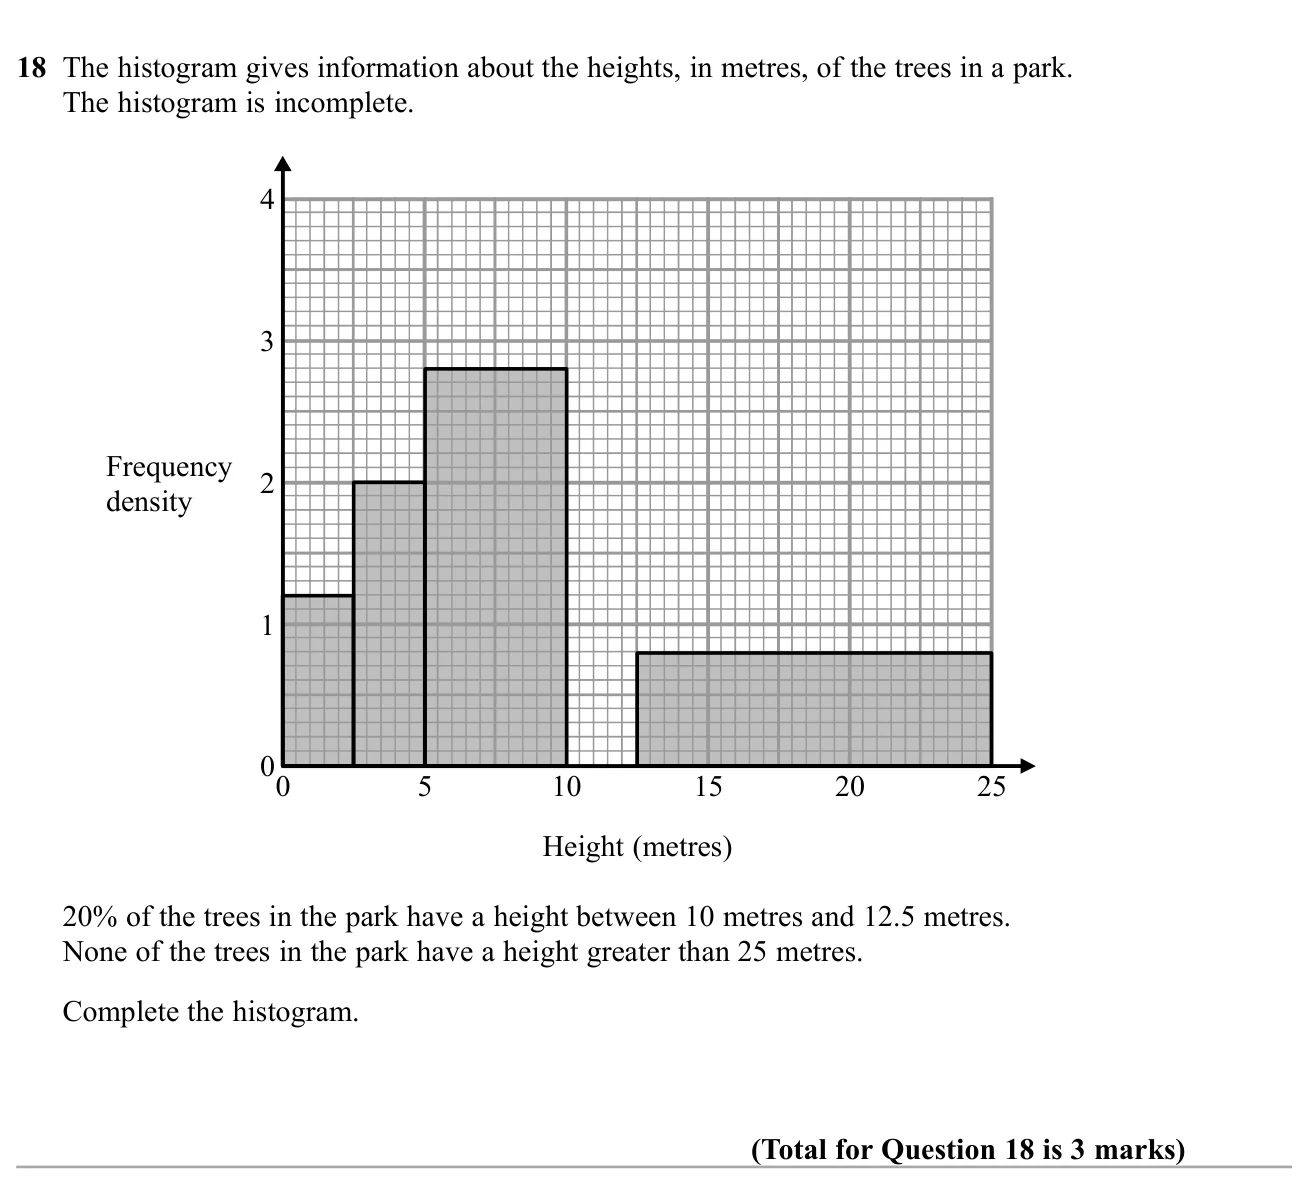
November 2019 · Paper 2 Higher · Q18
Complete a histogram by using a percentage to find the missing bar's frequency density.

© Pearson Education Ltd. November 2019 Paper 2 (Higher, calculator), question 18.

Show answer
AnswerA bar from 10 to 12.5 m with frequency density 3.23 marks

Worked solution Checked against the mark scheme

Frequencies from the bars (width × height): 2.5×1.2=32.5 \times 1.2 = 3, 2.5×2=52.5 \times 2 = 5, 5×2.8=145 \times 2.8 = 14, 12.5×0.8=1012.5 \times 0.8 = 10

Known total =32= 32, which is 80% of the trees, so there are 32÷0.8=4032 \div 0.8 = 40 trees.

Missing class: 20% of 40 =8= 8 trees.

Frequency density =8÷2.5=3.2= 8 \div 2.5 = 3.2, so draw a bar of height 3.2 from 10 to 12.5.

Watch out: Drawing the bar height as the frequency (8) instead of the frequency density.

Histograms4 marksGrade 7CalculatorHigher
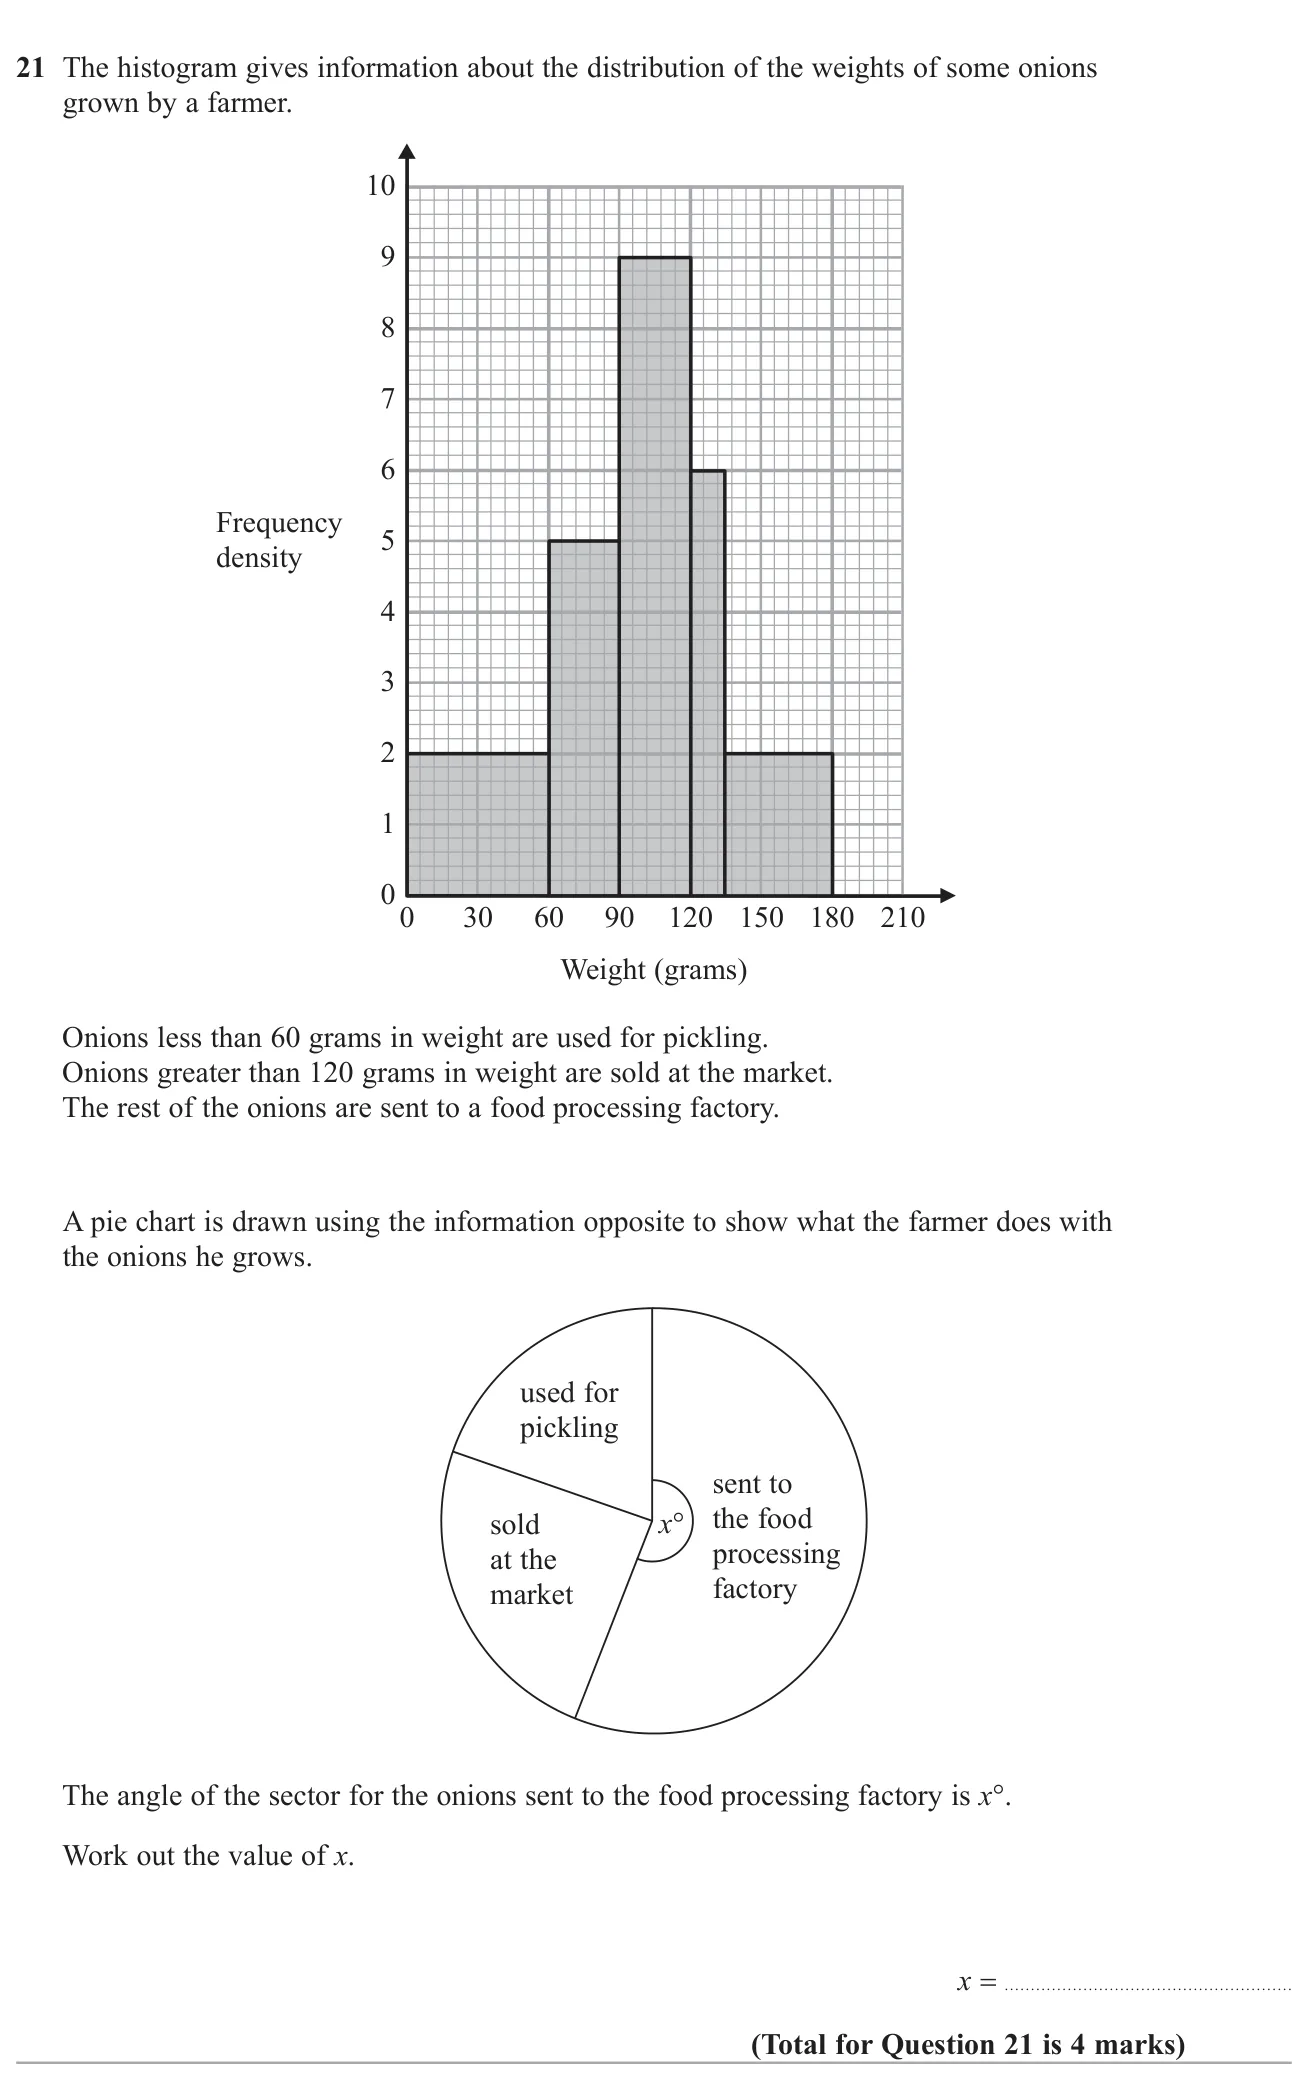
June 2019 · Paper 3 Higher · Q21
Read frequencies from a histogram, then find the pie-chart angle for the onions between 60 g and 120 g.

© Pearson Education Ltd. June 2019 Paper 3 (Higher, calculator), question 21.

Show answer
Answerx=210x = 2104 marks

Worked solution Checked against the mark scheme

Frequency = frequency density × width:

0–60: 2×60=1202 \times 60 = 120; 60–90: 5×30=1505 \times 30 = 150; 90–120: 9×30=2709 \times 30 = 270; 120–135: 6×15=906 \times 15 = 90; 135–180: 2×45=902 \times 45 = 90

Total =720= 720. Factory (60–120 g): 150+270=420150 + 270 = 420

x=420720×360=210x = \frac{420}{720} \times 360 = 210

Watch out: Using the bar heights as frequencies.

Histograms5 marksGrade 7CalculatorHigher
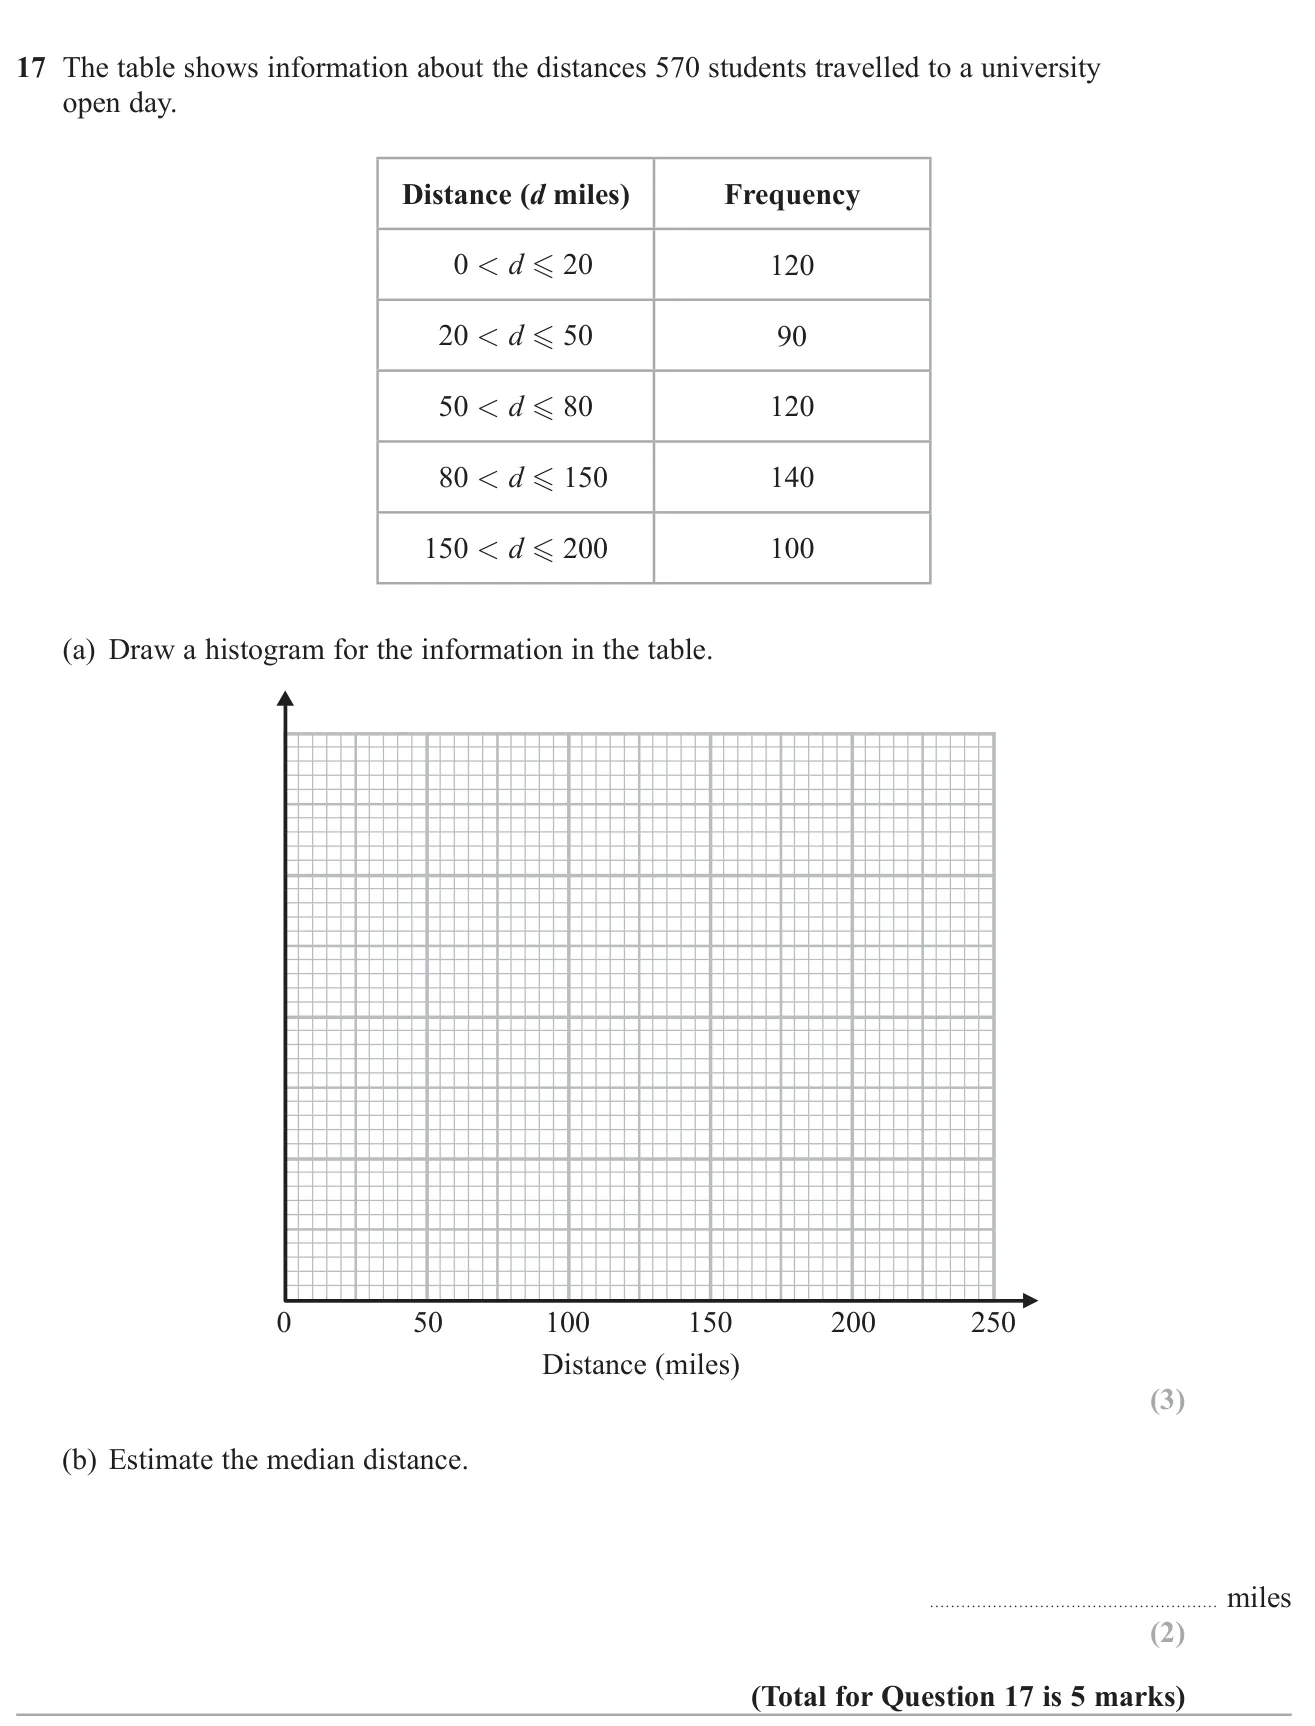
November 2018 · Paper 3 Higher · Q17
Draw a histogram from unequal class widths and estimate the median distance.

© Pearson Education Ltd. November 2018 Paper 3 (Higher, calculator), question 17.

Show answer
(a)Bars with frequency densities 6,3,4,2,26, 3, 4, 2, 23 marks
(b)About 6969 miles (accept 66 to 71)2 marks

Worked solution Checked against the mark scheme

(a) Frequency density = frequency ÷ class width:

120÷20=6120 \div 20 = 6, 90÷30=390 \div 30 = 3, 120÷30=4120 \div 30 = 4, 140÷70=2140 \div 70 = 2, 100÷50=2100 \div 50 = 2

(b) The median is the 285285th value. 120+90=210120 + 90 = 210, so it is 7575 into the 50–80 class.

50+75120×30=68.75≈6950 + \frac{75}{120} \times 30 = 68.75 \approx 69 miles

Watch out: Plotting frequency instead of frequency density on the vertical axis.

Histograms4 marksGrade 8CalculatorHigher
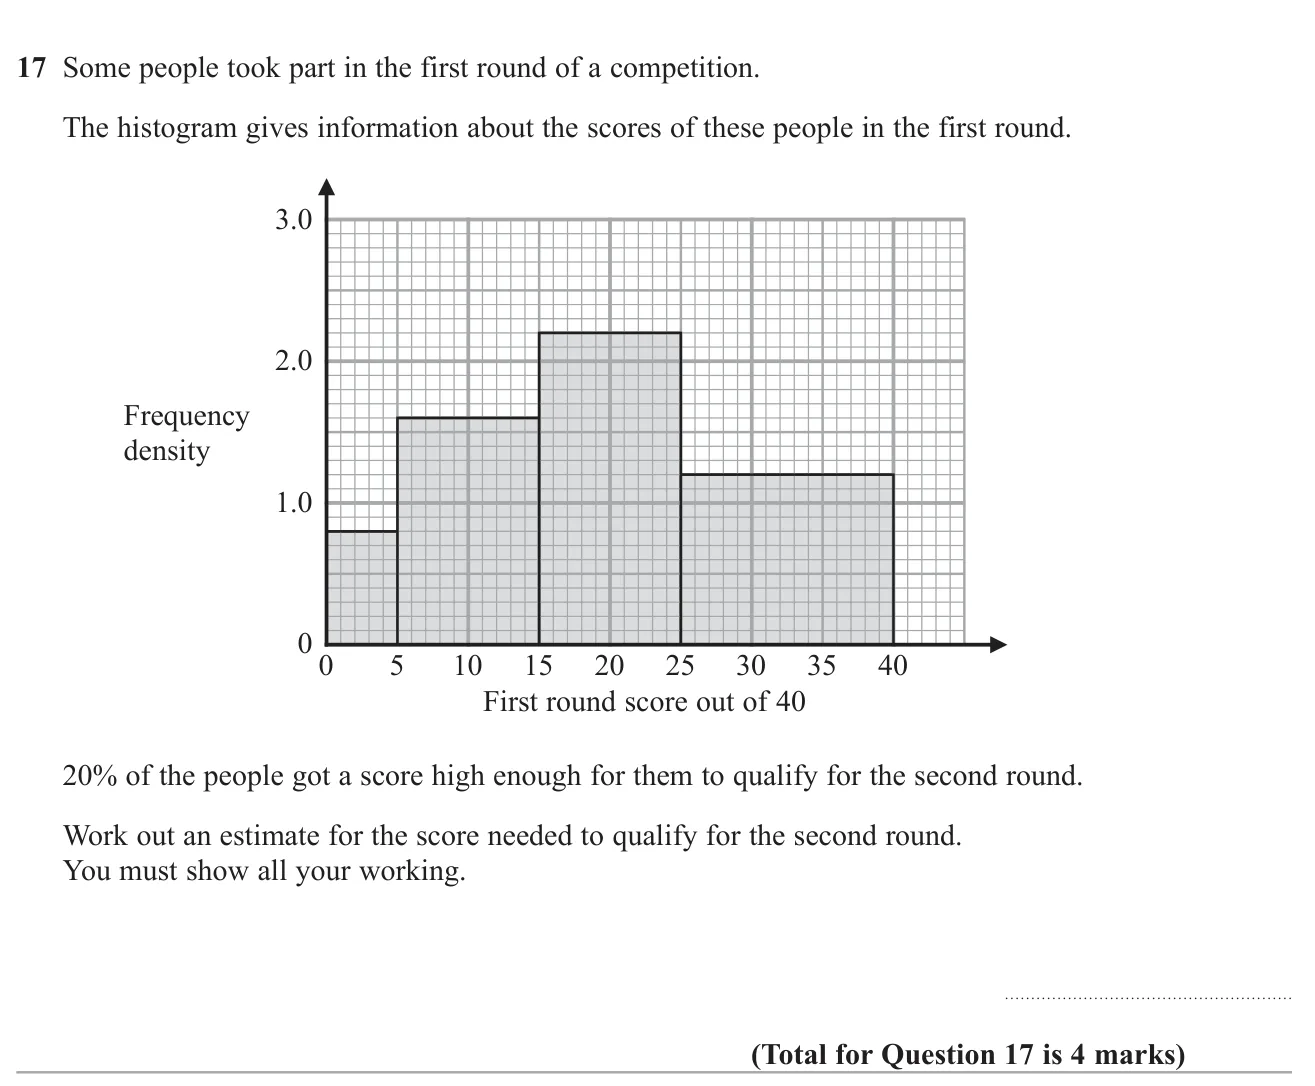
November 2021 · Paper 2 Higher · Q17
Use a histogram to find the score reached by the top fifth of competitors.

© Pearson Education Ltd. November 2021 Paper 2 (Higher, calculator), question 17.

Show answer
Answer30304 marks

Worked solution Checked against the mark scheme

Frequency = frequency density × class width:

0.8×5=40.8 \times 5 = 4, 1.6×10=161.6 \times 10 = 16, 2.2×10=222.2 \times 10 = 22, 1.2×15=181.2 \times 15 = 18. Total =60= 60.

20% of 60 =12= 12 people.

In the top class, 12 people cover 12÷1.2=1012 \div 1.2 = 10 marks, so the score is 40−10=3040 - 10 = 30.

Watch out: Reading frequency density as frequency, or counting 12 people up from 0 instead of down from 40.

Also tested in these questions

Their main topic is different, but part of each one tests this topic.