Probability

Relative frequency and expected outcomes

11 past-paper questions, easiest first. Try each one, then reveal the answer.

Foundation & Higher8 of 11 from Foundation papers

Revision guide by The Full Marks

Relative frequency and expected outcomes: what you need to know

Relative frequency is a probability estimated from an experiment rather than worked out in theory. You use it, and theoretical probability, to predict how many times something should happen, which is called the expected frequency.

Key facts

  • Relative frequency =number of times it happenedtotal number of trials= \frac{\text{number of times it happened}}{\text{total number of trials}}.
  • Expected frequency == probability ×\times number of trials.
  • The more trials you do, the more reliable a relative frequency is as an estimate. It gets closer to the true probability.
  • If results are far from what a fair dice or coin would give over many trials, it may be biased.
  • Frequency trees split a total into branches; the numbers on each pair of branches add up to the number before them.

Expected number of outcomes

  1. Find the probability (from theory, a table or a relative frequency).
  2. Multiply it by the number of trials.
  3. It is an estimate, so it does not have to be a whole number; do not round unless the question asks.

Estimating a probability from results

  1. Find the total number of trials.
  2. Divide the frequency of the outcome by that total.
  3. Use the largest experiment available: it is the most reliable.

Worked examples

Example 1 Foundation · grade 2

A fair dice is rolled 120 times. How many times would you expect it to land on 5?

Show the solution

P(5)=16P(5) = \frac{1}{6}
Expected number = 16×120=20\frac{1}{6} \times 120 = 20

Example 2 Foundation · grade 3

80 people are asked if they wear glasses. 35 are men. 12 of the men and 20 of the women wear glasses. (a) Complete a frequency tree. (b) One person is chosen at random. Find the probability they wear glasses.

Show the solution

(a) 80 splits into men 35 and women 80−35=4580 - 35 = 45
Men: glasses 12, no glasses 35−12=2335 - 12 = 23
Women: glasses 20, no glasses 45−20=2545 - 20 = 25
(b) Glasses: 12+20=3212 + 20 = 32, so P=3280=25P = \frac{32}{80} = \frac{2}{5}

Example 3 Foundation · grade 5

Priya spins a biased spinner 100 times. It lands on 1 eighteen times, 2 twenty-five times, 3 forty-two times and 4 fifteen times.
(a) Estimate the probability it lands on 3.
(b) She spins it 250 more times. Estimate how many times it lands on 3.
(c) Estimate the probability it lands on 3 on two spins in a row.

Show the solution

(a) Relative frequency = 42100=0.42\frac{42}{100} = 0.42
(b) 0.42×250=1050.42 \times 250 = 105 times
(c) The spins are independent, so multiply: 0.42×0.42=0.17640.42 \times 0.42 = 0.1764

Common mistakes

  • Using the theoretical probability (for example 14\frac{1}{4} for four sections) when the spinner is biased. Use the results instead.
  • Giving a probability when the question asks 'how many times'. Expected frequency is a count, not a fraction.
  • Saying 'do more trials' without saying why: more trials make the estimate more reliable.
  • Averaging two relative frequencies to combine experiments. Add the successes and add the trials instead, e.g. 7+3010+50=3760\frac{7 + 30}{10 + 50} = \frac{37}{60}.

Exam tips

  • When asked whose results are more reliable, pick the one with more trials and say that is the reason.
  • In frequency tree questions, check each pair of branches adds up to the total above it before you answer the probability part.

Questions people ask

What is the difference between relative frequency and probability?

Probability is what should happen in theory; relative frequency is what did happen in an experiment. With lots of trials they get close to each other.

How do you calculate expected frequency?

Multiply the probability of the outcome by the number of times the experiment is done. For example, 0.3×50=150.3 \times 50 = 15.

Exam questions: Relative frequency and expected outcomes (11, easiest first)

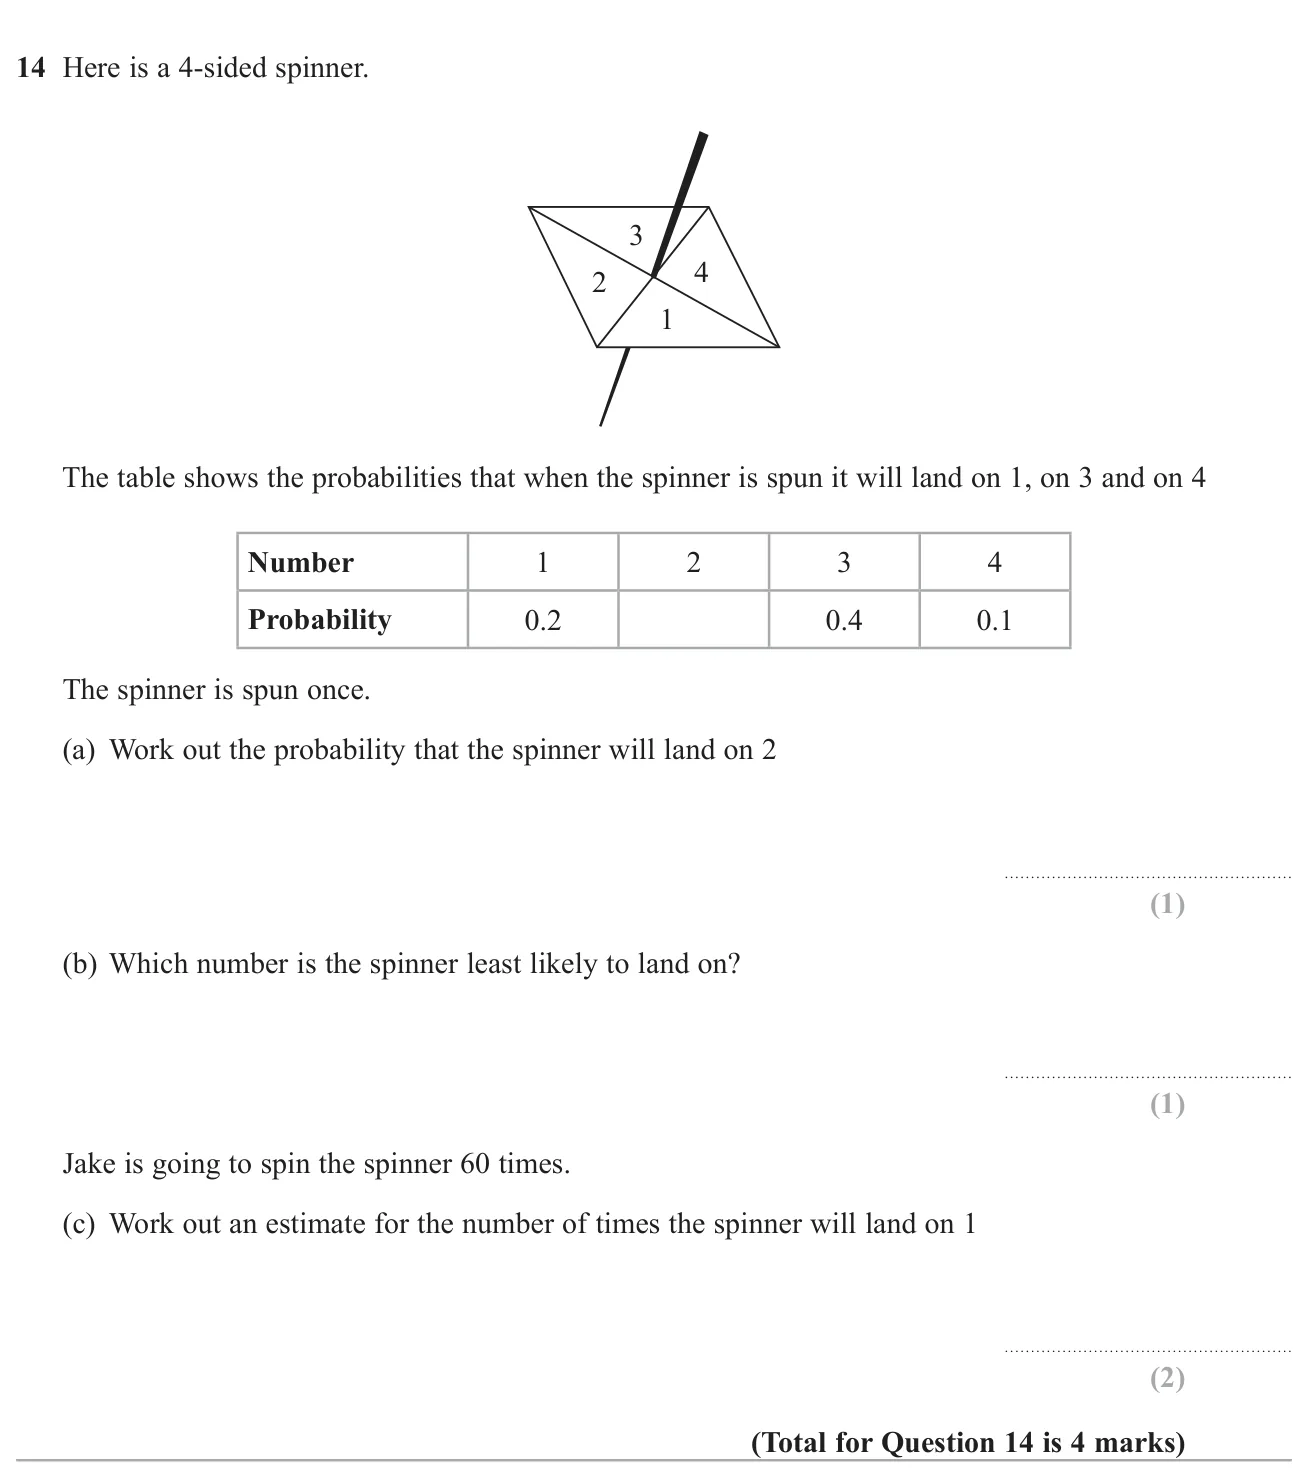
Relative frequency and expected outcomes4 marksGrade 2CalculatorFoundation
November 2018 · Paper 3 Foundation · Q14
Complete a probability table for a spinner, find the least likely outcome and estimate a frequency from 60 spins.

© Pearson Education Ltd. November 2018 Paper 3 (Foundation, calculator), question 14.

Show answer
(a)0.30.31 mark
(b)441 mark
(c)12122 marks

Worked solution Checked against the mark scheme

(a) Probabilities add to 1: 1−(0.2+0.4+0.1)=0.31 - (0.2 + 0.4 + 0.1) = 0.3

(b) The smallest probability is 0.1, which is for 4.

(c) Expected number of 1s: 0.2×60=120.2 \times 60 = 12

Watch out: In (b), writing the probability 0.1 instead of the number 4.
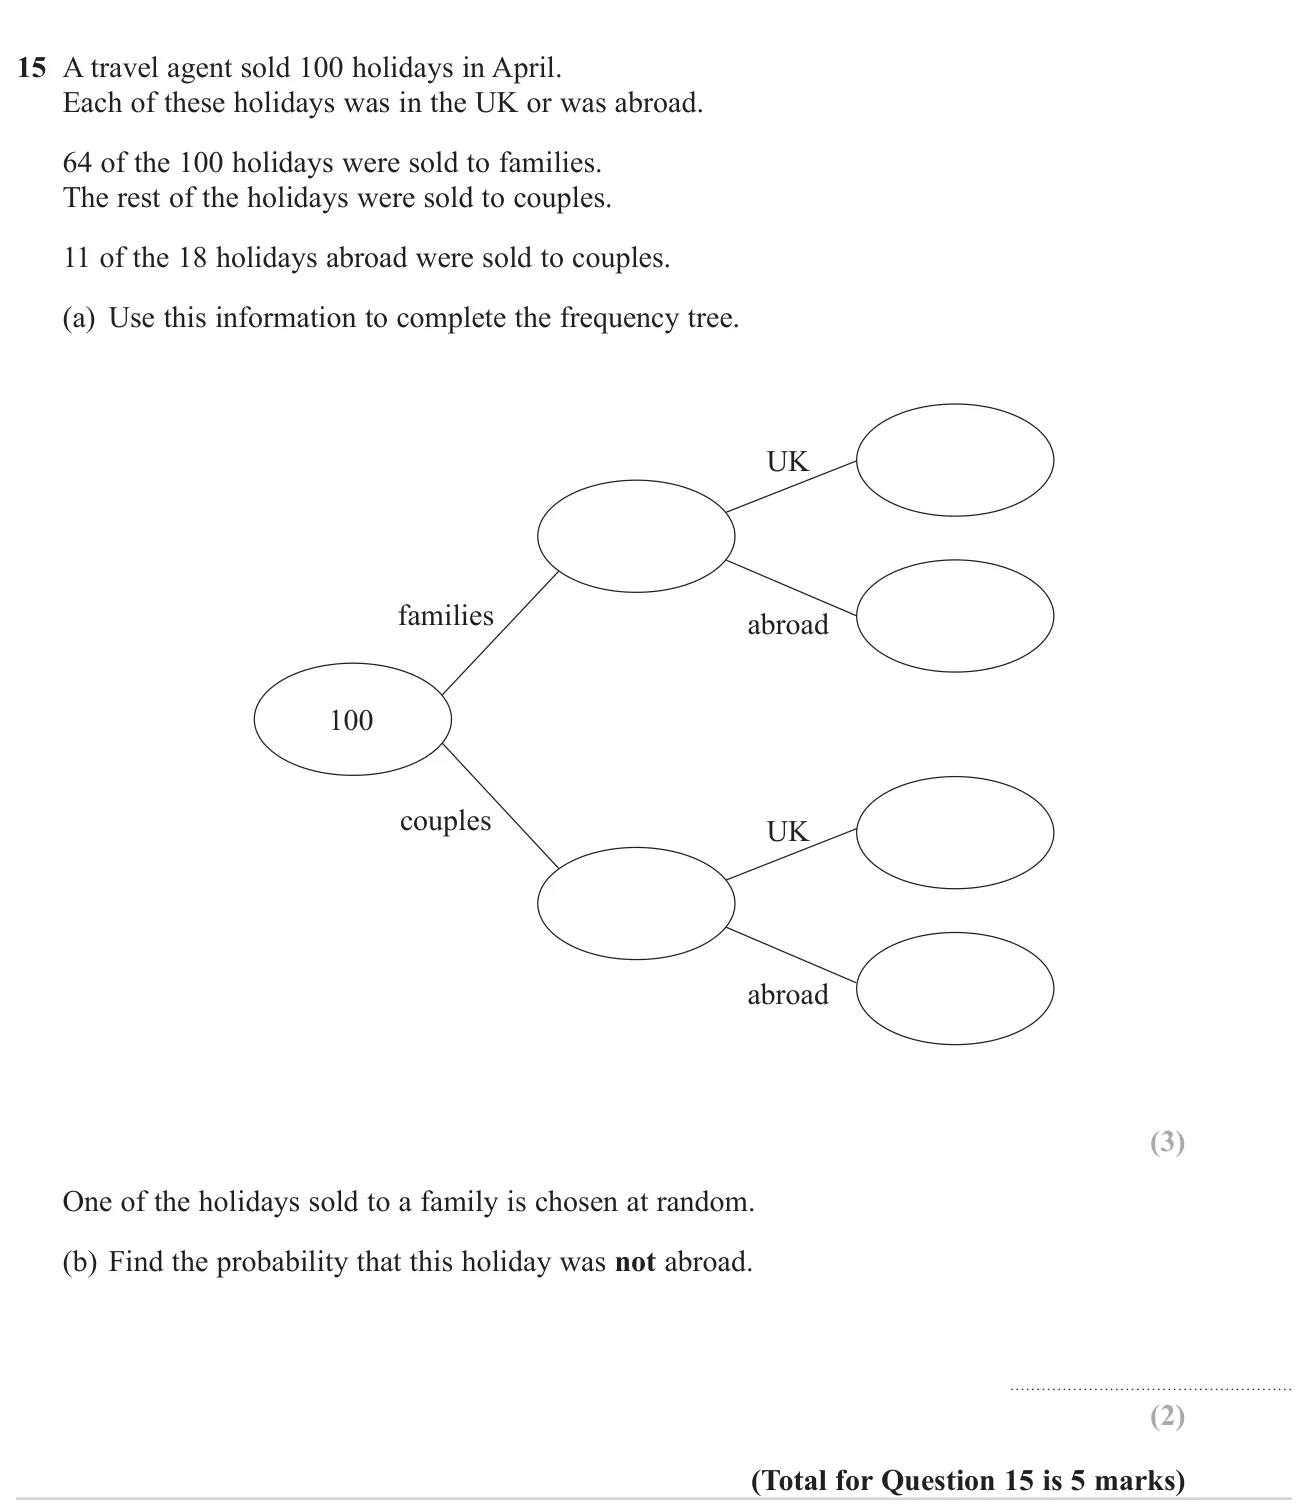
Relative frequency and expected outcomes5 marksGrade 3CalculatorFoundation
November 2023 · Paper 3 Foundation · Q15
Complete a frequency tree for holiday sales and find a probability from it.

© Pearson Education Ltd. November 2023 Paper 3 (Foundation, calculator), question 15.

Show answer
(a)Families 64 (UK 57, abroad 7); couples 36 (UK 25, abroad 11)3 marks
(b)5764\frac{57}{64}2 marks

Worked solution Checked against the mark scheme

(a) Couples =100−64=36= 100 - 64 = 36. Couples abroad =11= 11, so couples UK =36−11=25= 36 - 11 = 25.

Families abroad =18−11=7= 18 - 11 = 7, so families UK =64−7=57= 64 - 7 = 57.

(b) Not abroad means UK: 5764\frac{57}{64}

Watch out: In (b), dividing by 100 instead of by the 64 families.

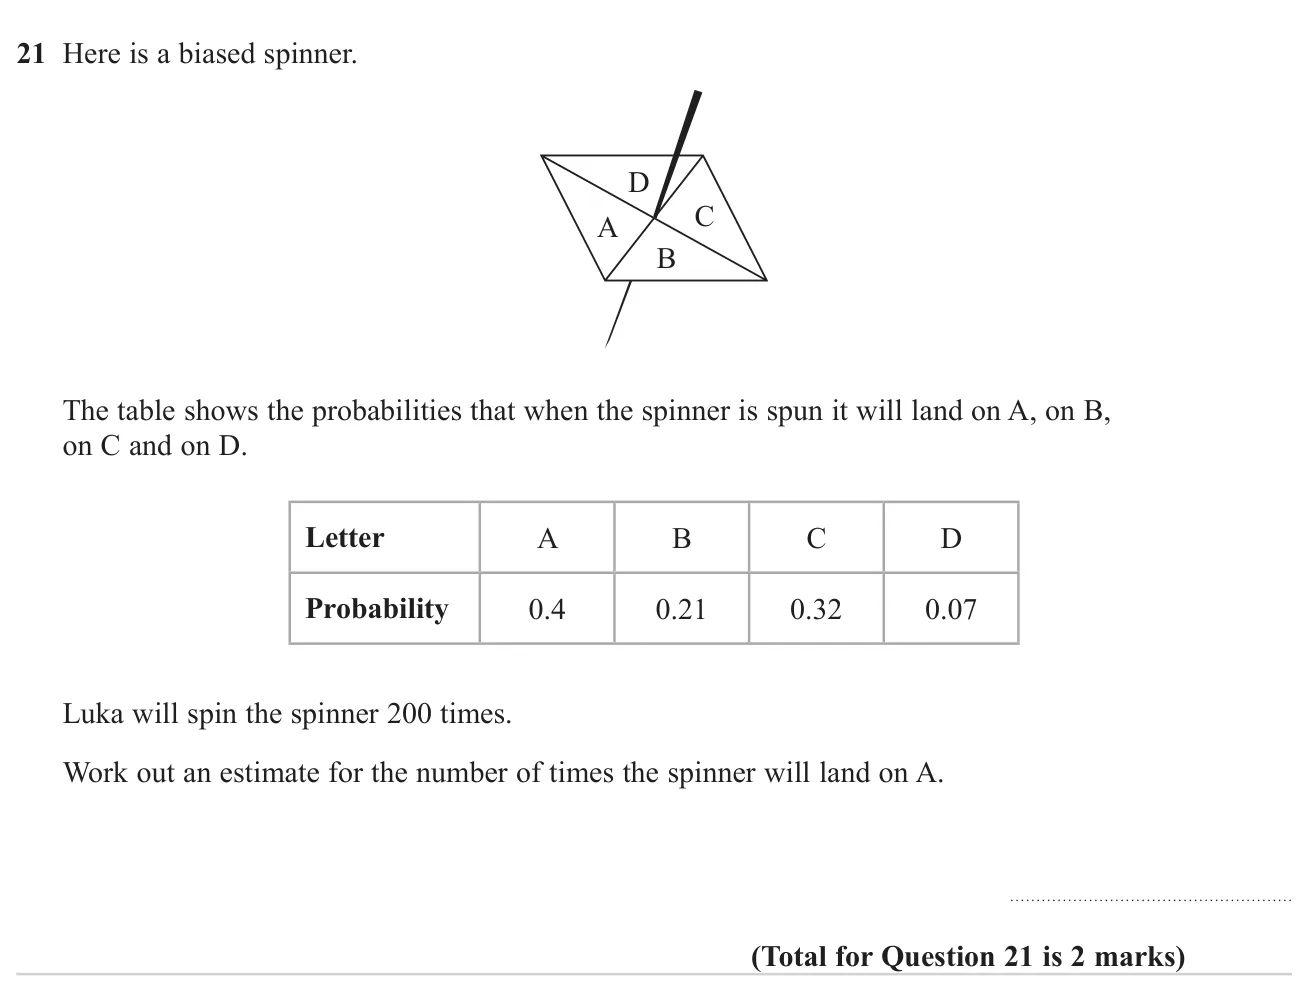
Relative frequency and expected outcomes2 marksGrade 3CalculatorOn both tiers
November 2023 · Paper 3 Foundation · Q21
Estimate how often a biased spinner lands on one letter over many spins.

© Pearson Education Ltd. November 2023 Paper 3 (Foundation, calculator), question 21.

Show answer
Answer802 marks

Worked solution Checked against the mark scheme

Expected number == probability × number of spins

0.4×200=800.4 \times 200 = 80

Watch out: Giving the answer as a probability, 80/200.

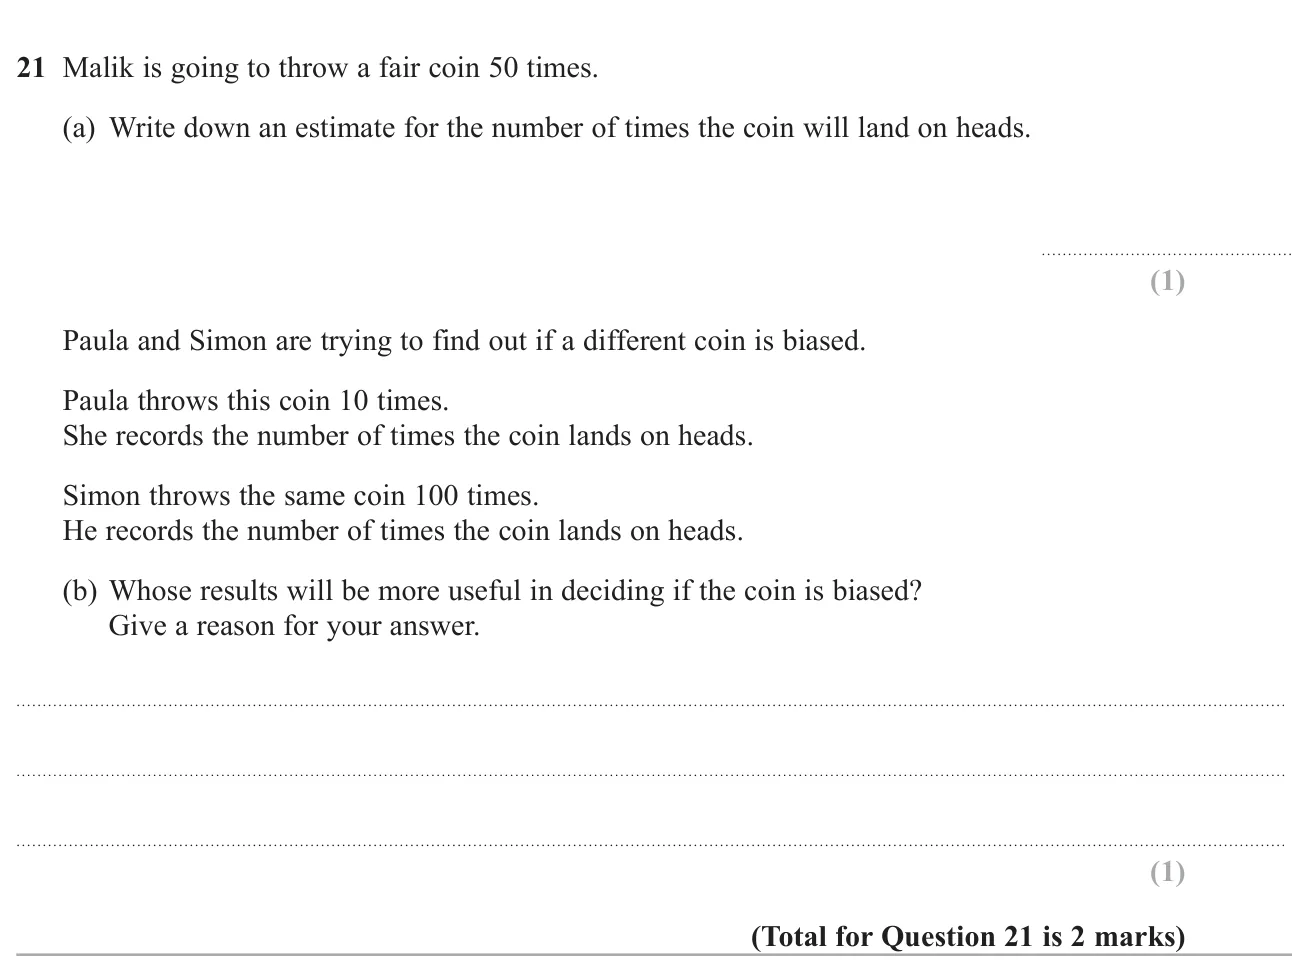
Relative frequency and expected outcomes2 marksGrade 3CalculatorFoundation
November 2020 · Paper 3 Foundation · Q21
Estimate the expected number of heads for a fair coin and say which of two experiments is more reliable.

© Pearson Education Ltd. November 2020 Paper 3 (Foundation, calculator), question 21.

Show answer
(a)251 mark
(b)Simon, because he made more throws1 mark

Worked solution Checked against the mark scheme

(a) P(heads)=12P(\text{heads}) = \frac{1}{2}, so 12×50=25\frac{1}{2} \times 50 = 25

(b) Simon: more trials give a more reliable estimate of the probability.

Watch out: In (b), just stating the number 100 without explaining why more throws helps.

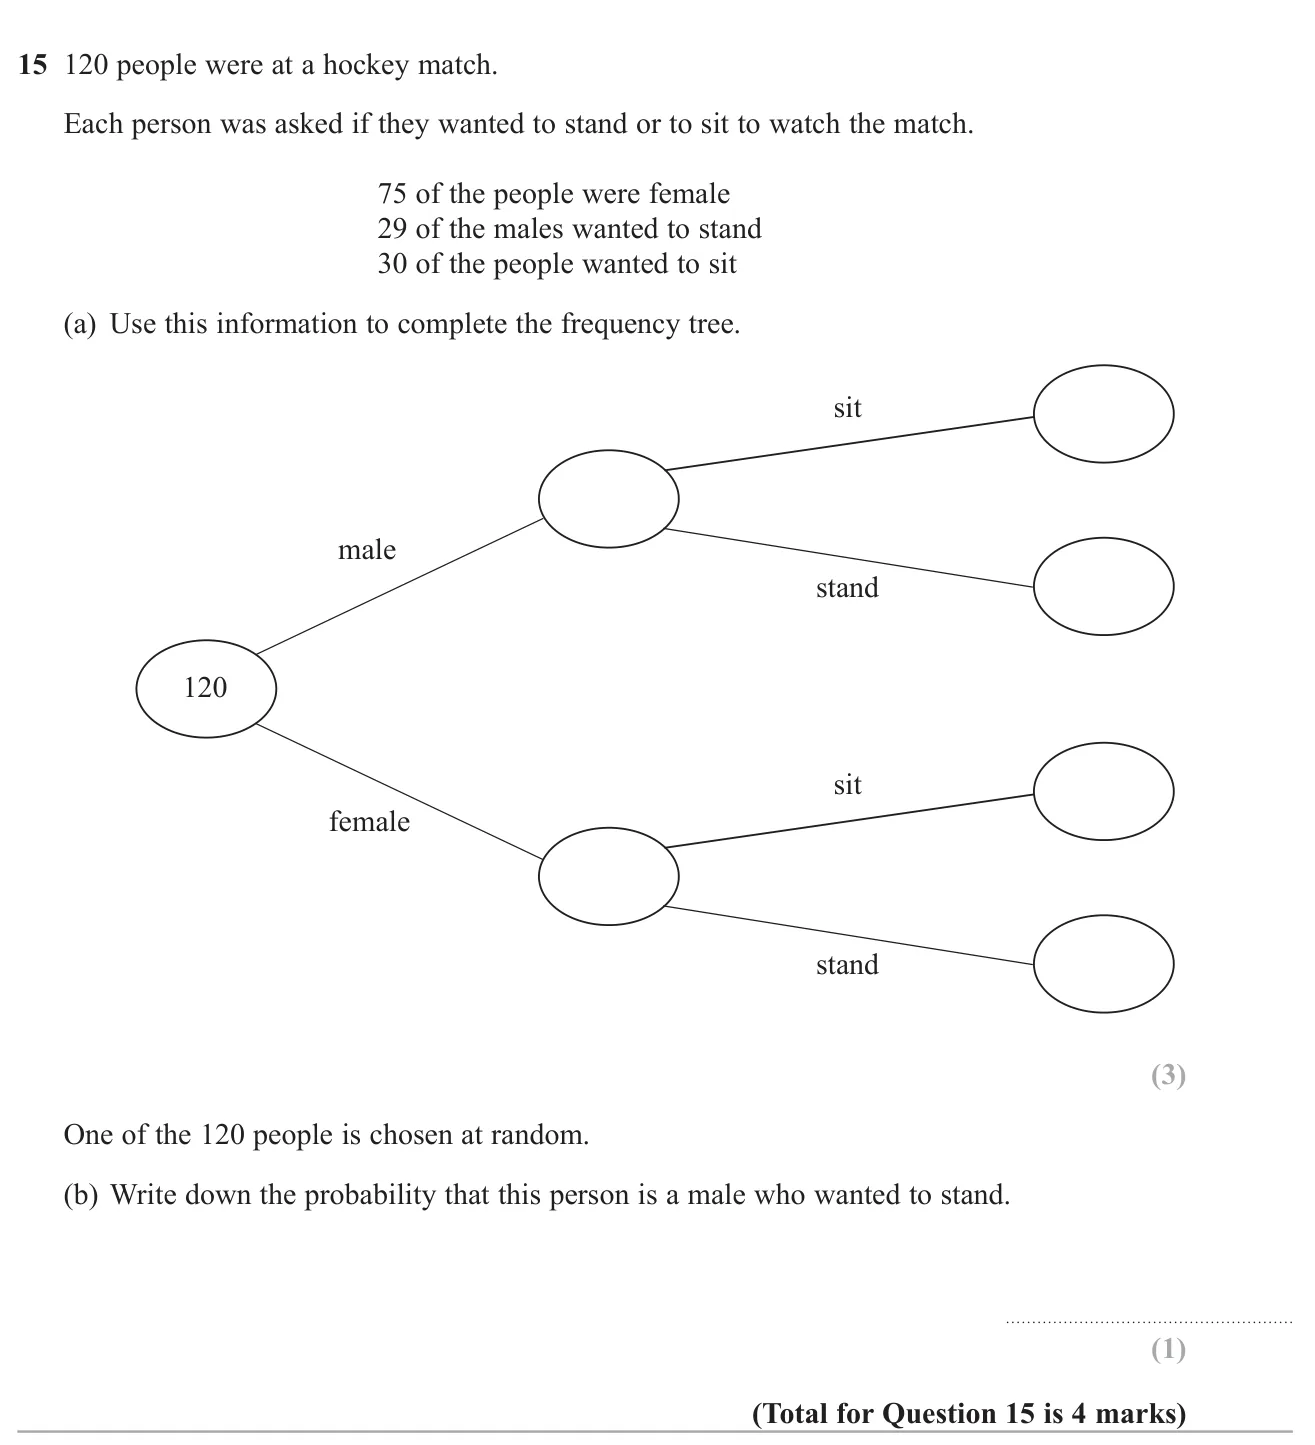
Relative frequency and expected outcomes4 marksGrade 3No calculatorFoundation
November 2019 · Paper 1 Foundation · Q15
Fill in a frequency tree from given facts about males, females, sitting and standing, then find a probability from it.

© Pearson Education Ltd. November 2019 Paper 1 (Foundation, non-calculator), question 15.

Show answer
(a)Male 45 (sit 16, stand 29); female 75 (sit 14, stand 61)3 marks
(b)29120\frac{29}{120}1 mark

Worked solution Checked against the mark scheme

(a) Males: 120−75=45120 - 75 = 45

Males sitting: 45−29=1645 - 29 = 16

Females sitting: 30−16=1430 - 16 = 14

Females standing: 75−14=6175 - 14 = 61

(b) 29 of the 120 people are males who stand, so the probability is 29120\frac{29}{120}.

Watch out: Putting all 30 sitters on the female branch.

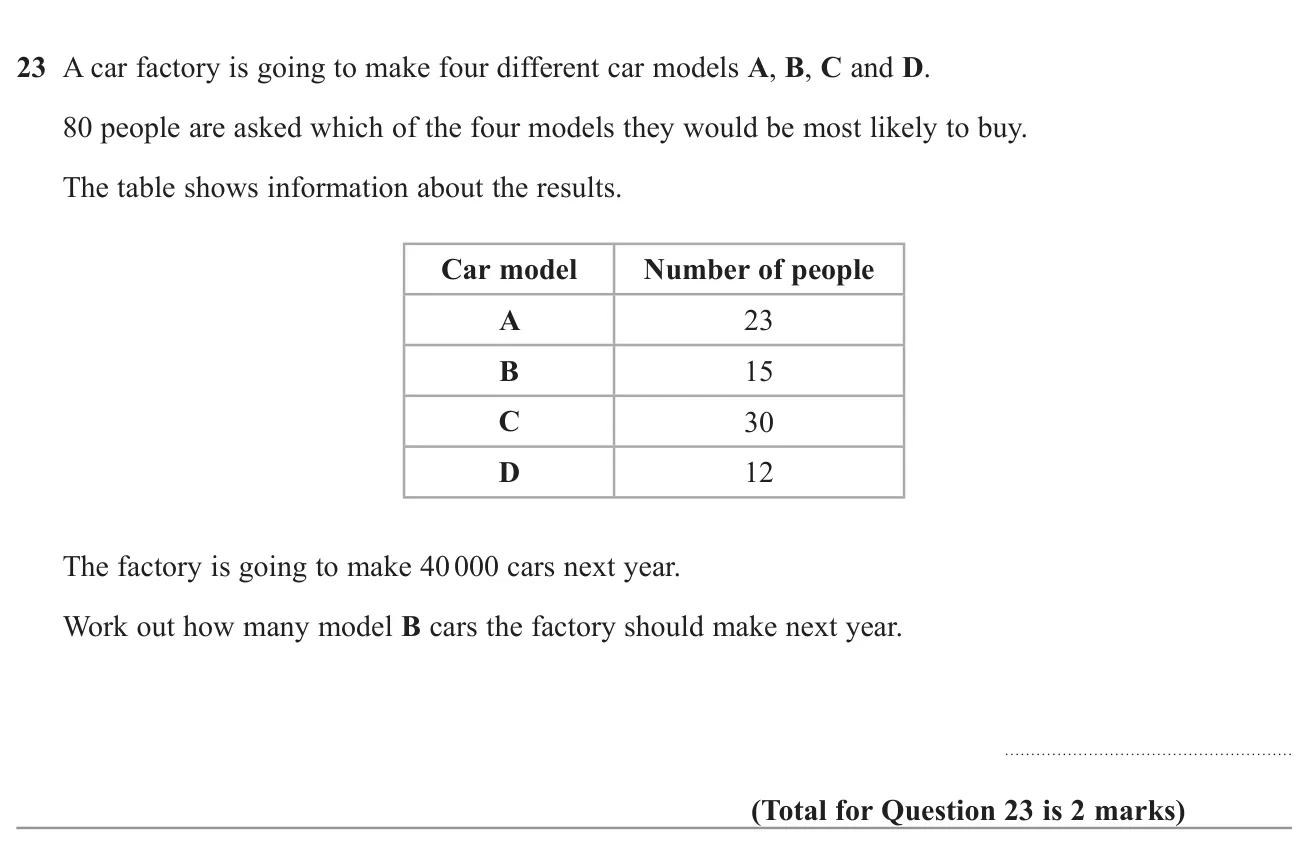
Relative frequency and expected outcomes2 marksGrade 4No calculatorOn both tiers
November 2022 · Paper 1 Foundation · Q23
Use survey results to estimate how many of one car model a factory should build.

© Pearson Education Ltd. November 2022 Paper 1 (Foundation, non-calculator), question 23.

Show answer
Answer750075002 marks

Worked solution Checked against the mark scheme

15 out of 80 people chose B.

1580×40 000=7500\frac{15}{80} \times 40\,000 = 7500

Watch out: Dividing 40 000 by 4 models.

Relative frequency and expected outcomes2 marksGrade 4No calculatorFoundation
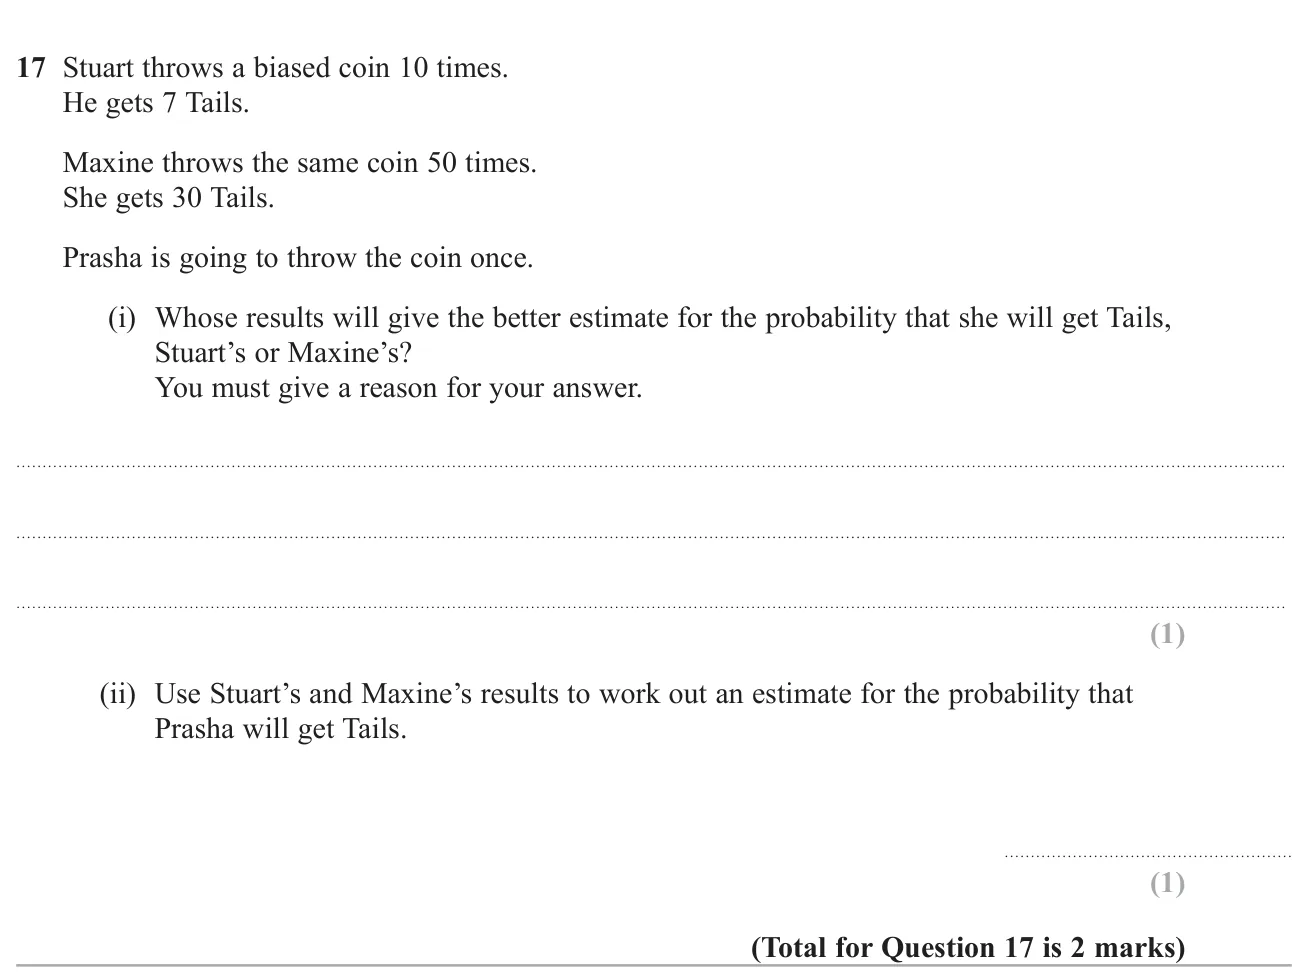
June 2019 · Paper 1 Foundation · Q17
Decide which of two sets of coin throws gives a better probability estimate and combine them into one estimate.

© Pearson Education Ltd. June 2019 Paper 1 (Foundation, non-calculator), question 17.

Show answer
((i))Maxine, because she threw the coin more times1 mark
((ii))3760\frac{37}{60}1 mark

Worked solution Checked against the mark scheme

(i) Maxine: she made more throws (50 against 10), and more trials give a more reliable estimate.

(ii) Combine all the results: 7+30=377 + 30 = 37 Tails out of 10+50=6010 + 50 = 60 throws.

Estimate =3760= \frac{37}{60}

Watch out: In (ii), averaging the two fractions 710\frac{7}{10} and 3050\frac{30}{50} instead of pooling the results.

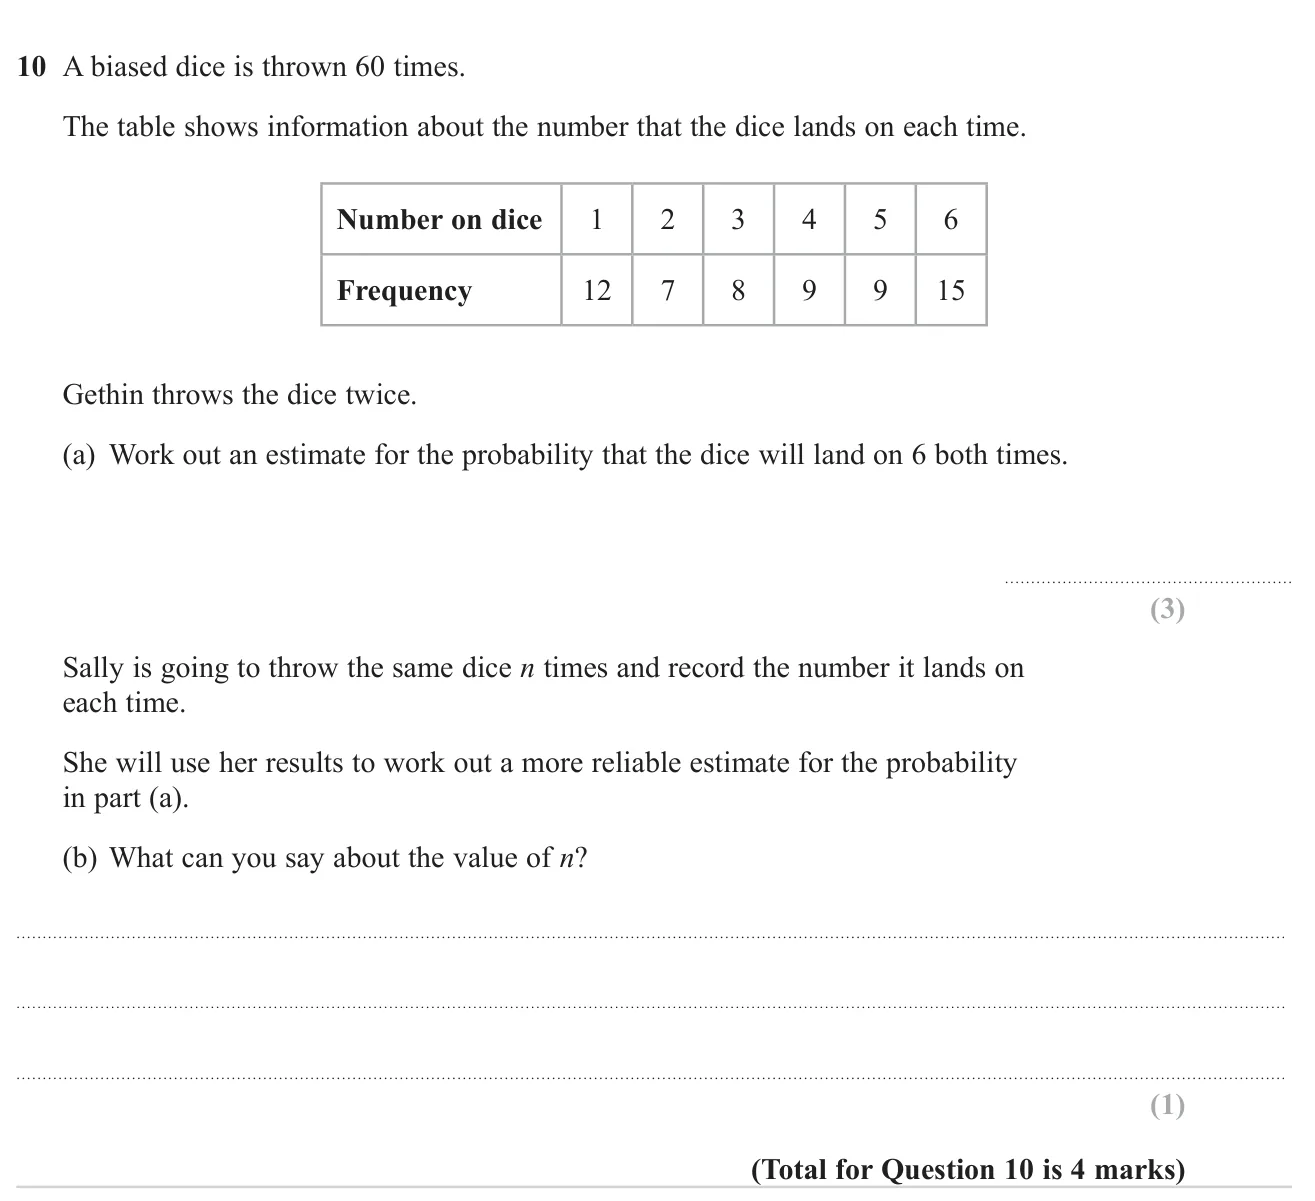
Relative frequency and expected outcomes4 marksGrade 5CalculatorHigher
June 2023 · Paper 2 Higher · Q10
Use relative frequency from a table to estimate the chance of two sixes in a row, and say how many throws would make the estimate more reliable.

© Pearson Education Ltd. June 2023 Paper 2 (Higher, calculator), question 10.

Show answer
(a)2253600=116\frac{225}{3600} = \frac{1}{16}3 marks
(b)nn must be greater than 601 mark

Worked solution Checked against the mark scheme

(a) P(6) ≈1560=14\approx \frac{15}{60} = \frac{1}{4}

P(6 both times) =14×14=116=0.0625= \frac{1}{4} \times \frac{1}{4} = \frac{1}{16} = 0.0625

(b) More throws give a more reliable estimate, so nn must be greater than 60.

Watch out: In (b), just saying 'n must be bigger' without comparing it to 60.

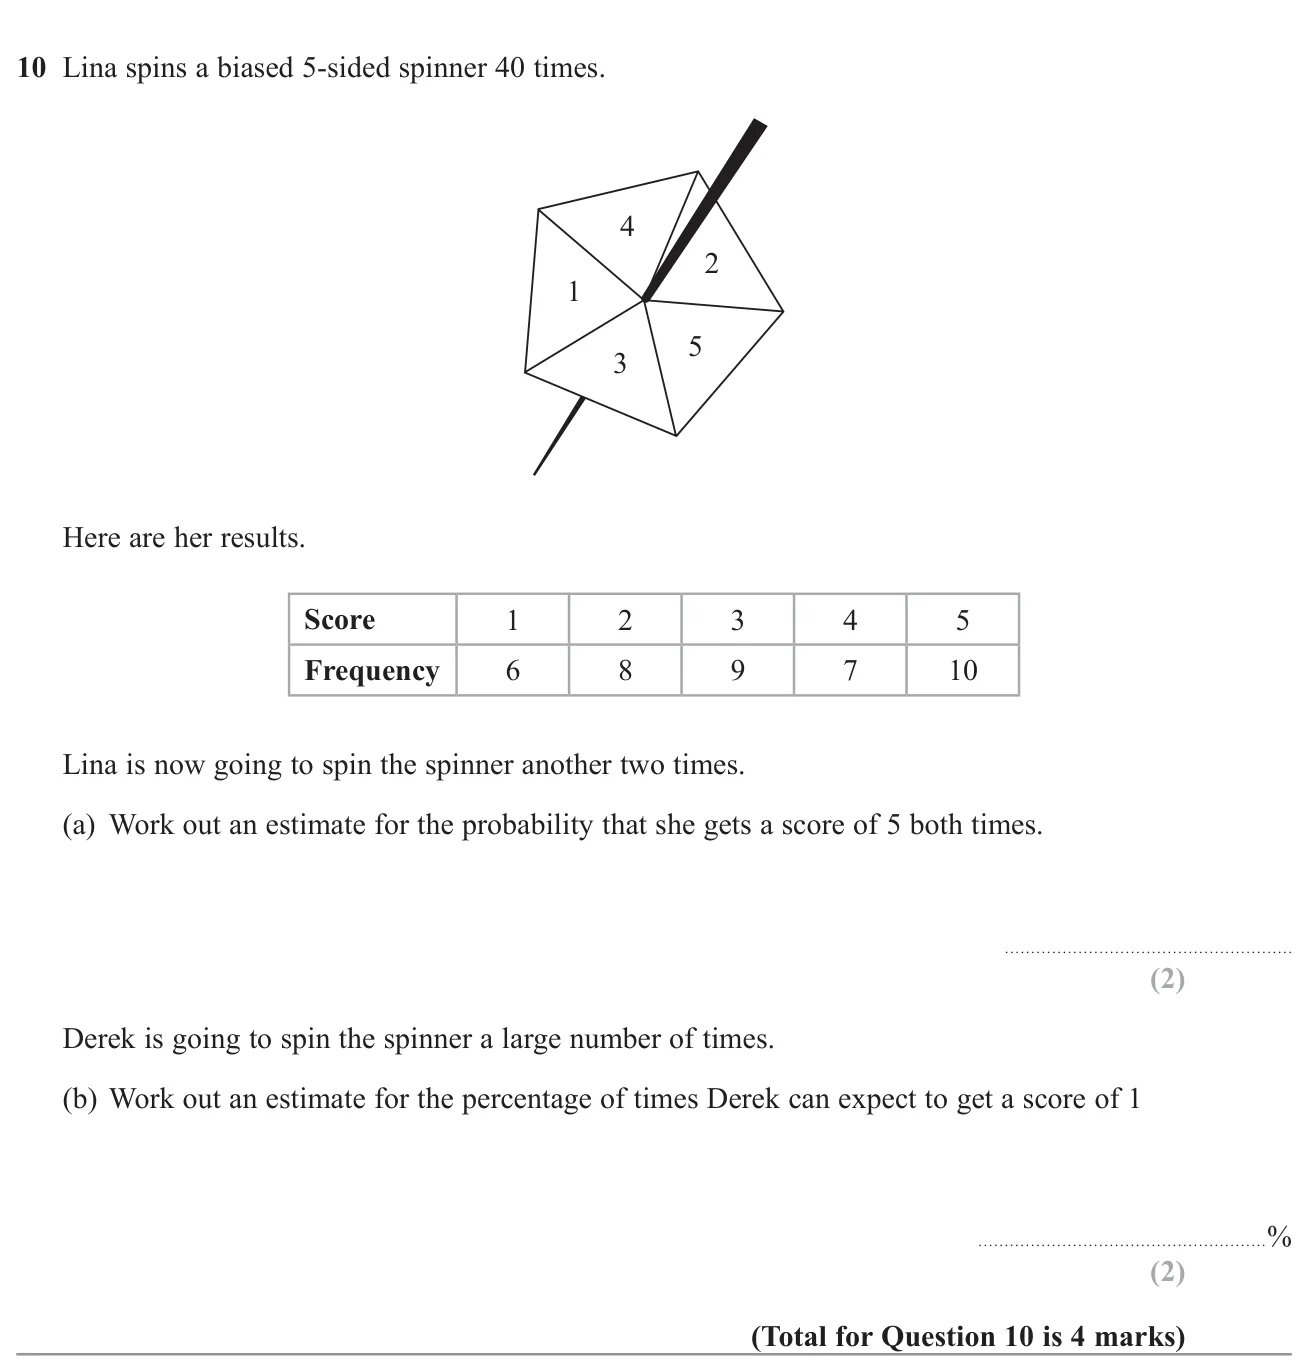
Relative frequency and expected outcomes4 marksGrade 5No calculatorHigher
November 2022 · Paper 1 Higher · Q10
Use a spinner's results to estimate the chance of two fives in a row and the percentage of ones expected over many spins.

© Pearson Education Ltd. November 2022 Paper 1 (Higher, non-calculator), question 10.

Show answer
(a)116\frac{1}{16}2 marks
(b)15%15\%2 marks

Worked solution Checked against the mark scheme

(a) A 5 came up 10 times out of 40, so P(5)≈1040=14P(5) \approx \frac{10}{40} = \frac{1}{4}

Two fives: 14×14=116\frac{1}{4} \times \frac{1}{4} = \frac{1}{16}

(b) A 1 came up 6 times out of 40: 640=0.15=15%\frac{6}{40} = 0.15 = 15\%

Watch out: Using 15\frac{1}{5} because the spinner has five sides, ignoring the bias.

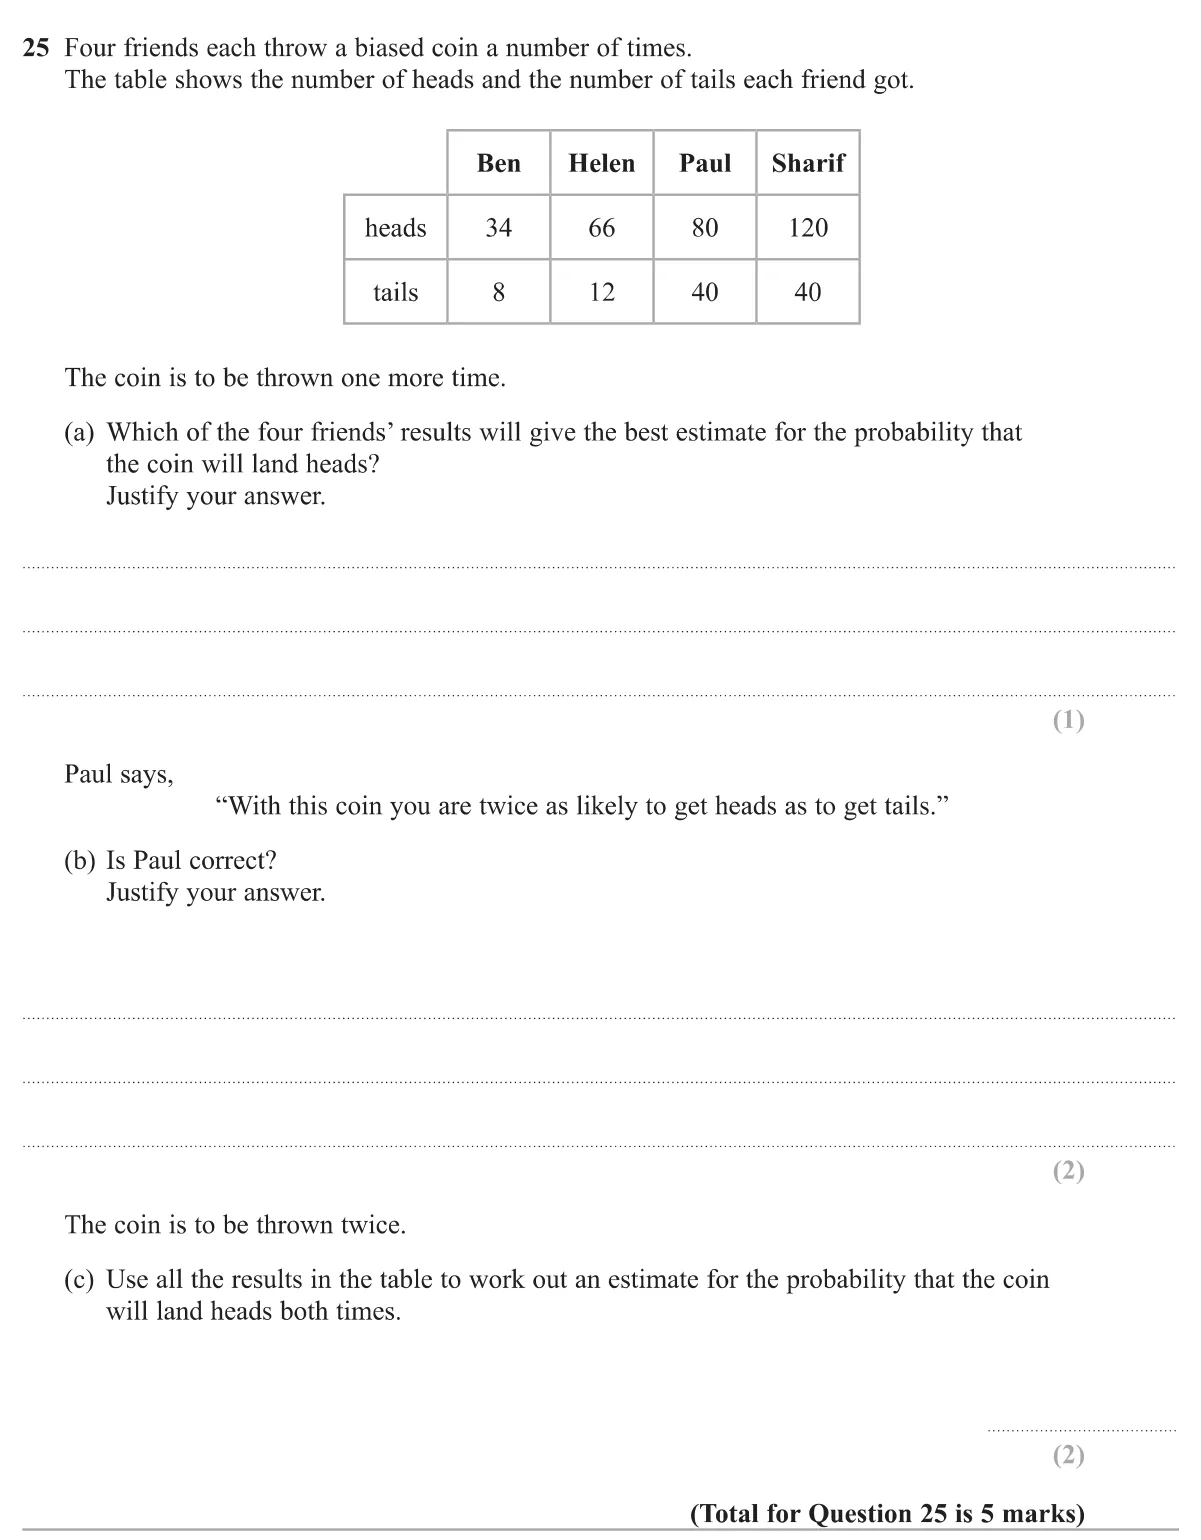
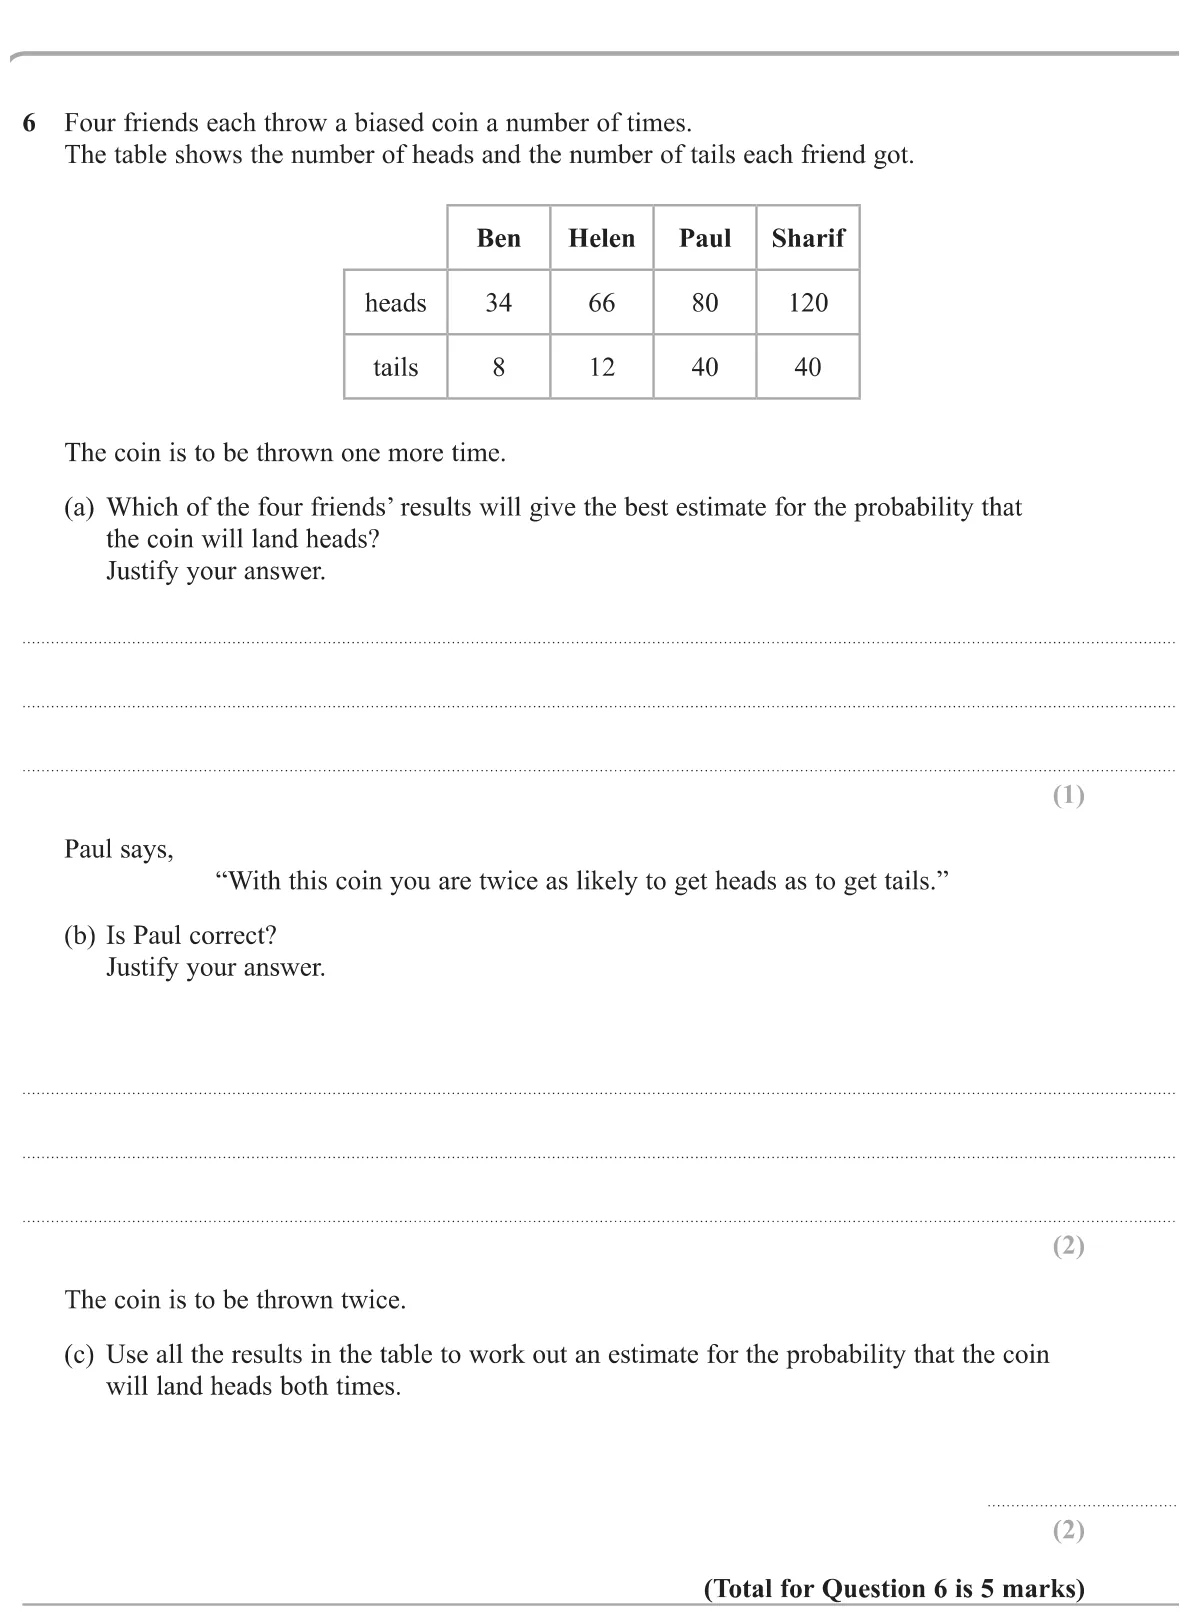
Relative frequency and expected outcomes5 marksGrade 5No calculatorFoundation
Specimen · Paper 1 Foundation · Q25
Judge which set of coin results gives the best probability estimate, test a claim about heads and tails, and estimate the chance of two heads.

© Pearson Education Ltd. Specimen Paper 1 (Foundation, non-calculator), question 25.

Show answer
(a)Sharif, because he threw the coin the most times1 mark
(b)No: Paul's own results give heads twice as often, but overall 300 heads to 100 tails is three times as likely2 marks
(c)916\frac{9}{16}2 marks

Worked solution Checked against the mark scheme

(a) Sharif threw 160 times, more than anyone else, so his results are the most reliable.

(b) Paul got 80:40=2:180 : 40 = 2 : 1, but all results together give 300300 heads and 100100 tails, 3:13 : 1. So heads is about three times as likely, not twice: Paul is not correct.

(c) P(heads) ≈300400=34\approx \frac{300}{400} = \frac34.

P(two heads) =34×34=916= \frac34 \times \frac34 = \frac{9}{16}

Watch out: In (c), adding 3/4 + 3/4 instead of multiplying.

Relative frequency and expected outcomes5 marksGrade 5No calculatorHigher
Specimen · Paper 1 Higher · Q6
Choose the most reliable set of coin results, test a claim about heads being twice as likely, and estimate the probability of two heads.

© Pearson Education Ltd. Specimen Paper 1 (Higher, non-calculator), question 6.

Show answer
(a)Sharif, because he threw the coin the most times1 mark
(b)No: over all the results heads is 3 times as likely as tails (300 heads, 100 tails); only Paul's own results give 2 to 12 marks
(c)916\frac{9}{16}2 marks

Worked solution Checked against the mark scheme

(a) Sharif threw the coin 160 times, more than anyone else, so his results are the most reliable.

(b) Altogether there were 300 heads and 100 tails, a ratio of 3 : 1. Heads is about three times as likely, not twice, so Paul is wrong.

(c) P(heads) ≈300400=34\approx \frac{300}{400} = \frac{3}{4}

P(two heads) =34×34=916= \frac{3}{4} \times \frac{3}{4} = \frac{9}{16}

Watch out: In (c), adding the probabilities instead of multiplying them.

Also tested in these questions

Their main topic is different, but part of each one tests this topic.