Revision guide by The Full Marks
Averages and spread: what you need to know Averages (mean, median, mode) tell you a typical value; the range and interquartile range tell you how spread out the data is. Questions often ask you to compare two groups using one of each.
Both tiers need mean, median, mode and range; quartiles and interquartile range are Higher only.
Key facts Mean = total of the values ÷ number of values, so total = mean × number of values. Median = middle value when the data is in order; for n n n n + 1 2 \frac{n+1}{2} 2 n + 1 Mode = most common value. Modal class = the class with the highest frequency. Range = largest − smallest. An outlier can make the range misleading. Higher: interquartile range (IQR) = upper quartile − lower quartile, the spread of the middle half of the data. Median and mean from a frequency table Total frequency n n n n + 1 2 \frac{n+1}{2} 2 n + 1 For the mean, multiply each value by its frequency, add them up and divide by n n n For grouped data, use midpoints and call the mean an estimate. The median is then a class, not a single value. Working back from a mean, or combining groups Turn each mean into a total: total = mean × number of values. Add or subtract totals to find what you need (a missing value, or the total for the whole group). Divide by the right number of values. Never just average two means. Comparing two data sets Compare an average: say which is higher and what it means in context. Compare a measure of spread: a smaller range or IQR means more consistent. Worked examples Example 1 Foundation · grade 3
Find the mean, median, mode and range of: 8, 2, 11, 5, 16, 9, 5.
Show the solution In order: 2, 5, 5, 8, 9, 11, 16
Example 2 Higher · grade 5
The ages of 11 people in a running club are: 12, 15, 17, 18, 21, 22, 24, 27, 29, 33, 40. (a) Find the median and interquartile range. (b) A cycling club has median age 26 and IQR 7. Compare the two clubs.
Show the solution (a) 11 values, already in order.
Common mistakes Dividing by the number of classes instead of the total frequency. Giving a frequency as the answer: the mode is the value with the highest frequency, not the frequency itself. Finding the median without putting the data in order first. Averaging two means to get an overall mean. Use totals instead. Comparing groups by just quoting both numbers. Say which is bigger and what that means. Exam tips In a comparison, make one point about an average and one about the spread, each saying which group is higher and what that means in context. Say 'estimate' for a grouped mean: you used midpoints, so it is not exact. Questions people ask How do you find the mean from a frequency table? Multiply each value (or midpoint) by its frequency, add them up, then divide by the total frequency.
Which average should I use? The median is best when there are outliers, the mode for the most popular choice, and the mean when you want to use every value.
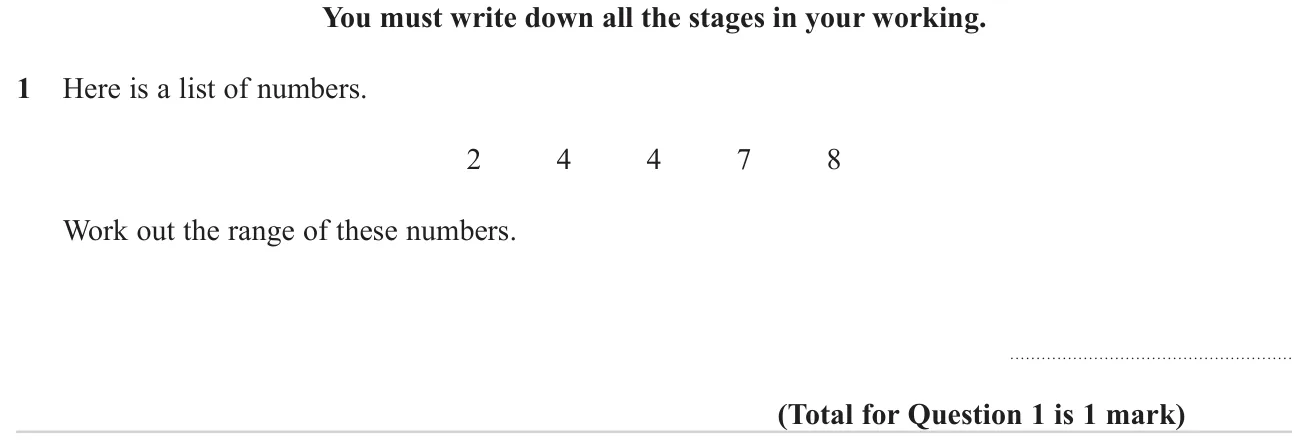
Exam questions: Averages and spread (41, easiest first) © Pearson Education Ltd. November 2023 Paper 1 (Foundation, non-calculator), question 1.
Worked solution Checked against the mark scheme
Range = largest − smallest.
8 − 2 = 6 8 - 2 = 6 8 − 2 = 6
Watch out: Giving the mode or the mean instead of the range.
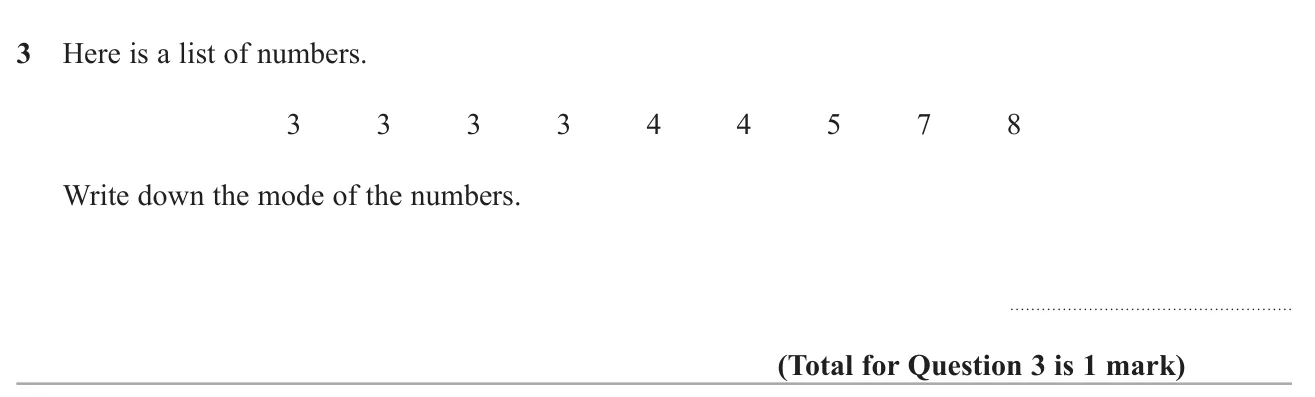
© Pearson Education Ltd. June 2022 Paper 2 (Foundation, calculator), question 3.
Worked solution Checked against the mark scheme
The mode is the value that appears most often.
3 appears four times, more than any other number, so the mode is 3.
Watch out: Giving the frequency 4 instead of the value 3.
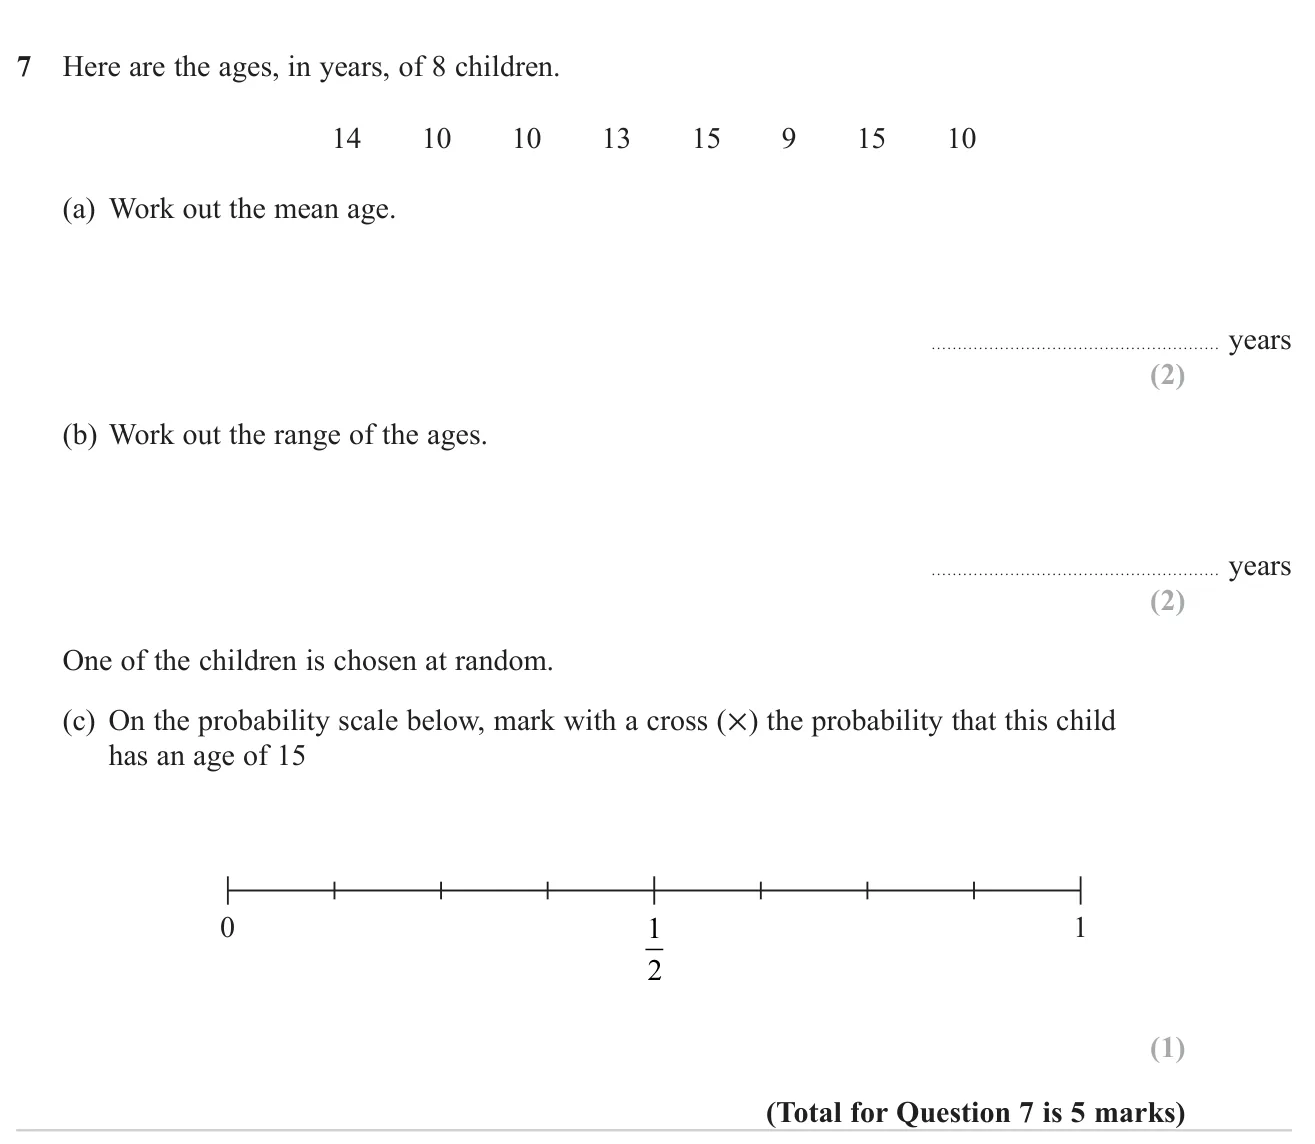
© Pearson Education Ltd. November 2024 Paper 2 (Foundation, calculator), question 7.
(a) 12 2 marks (b) 6 2 marks (c) Cross at 1 4 \frac{1}{4} 4 1 1 mark
Worked solution Checked against the mark scheme
(a) Total = 14 + 10 + 10 + 13 + 15 + 9 + 15 + 10 = 96 = 14+10+10+13+15+9+15+10 = 96 = 14 + 10 + 10 + 13 + 15 + 9 + 15 + 10 = 96 = 96 ÷ 8 = 12 = 96 \div 8 = 12 = 96 ÷ 8 = 12
(b) Range = 15 − 9 = 6 = 15 - 9 = 6 = 15 − 9 = 6
(c) Two of the 8 children are 15, so P = 2 8 = 1 4 P = \frac{2}{8} = \frac{1}{4} P = 8 2 = 4 1 1 2 \frac{1}{2} 2 1
Watch out: Giving the range as '9 to 15' or dividing the total by 7.
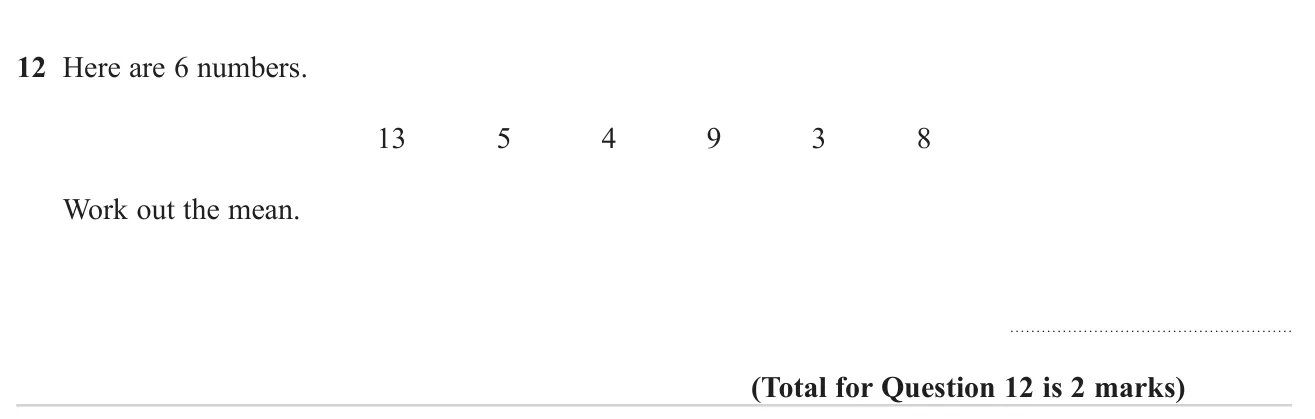
© Pearson Education Ltd. June 2023 Paper 1 (Foundation, non-calculator), question 12.
Worked solution Checked against the mark scheme
Add them: 13 + 5 + 4 + 9 + 3 + 8 = 42 13 + 5 + 4 + 9 + 3 + 8 = 42 13 + 5 + 4 + 9 + 3 + 8 = 42
Divide by how many there are: 42 ÷ 6 = 7 42 \div 6 = 7 42 ÷ 6 = 7
Watch out: Dividing by 5 or giving the median.
© Pearson Education Ltd. June 2023 Paper 2 (Foundation, calculator), question 11.
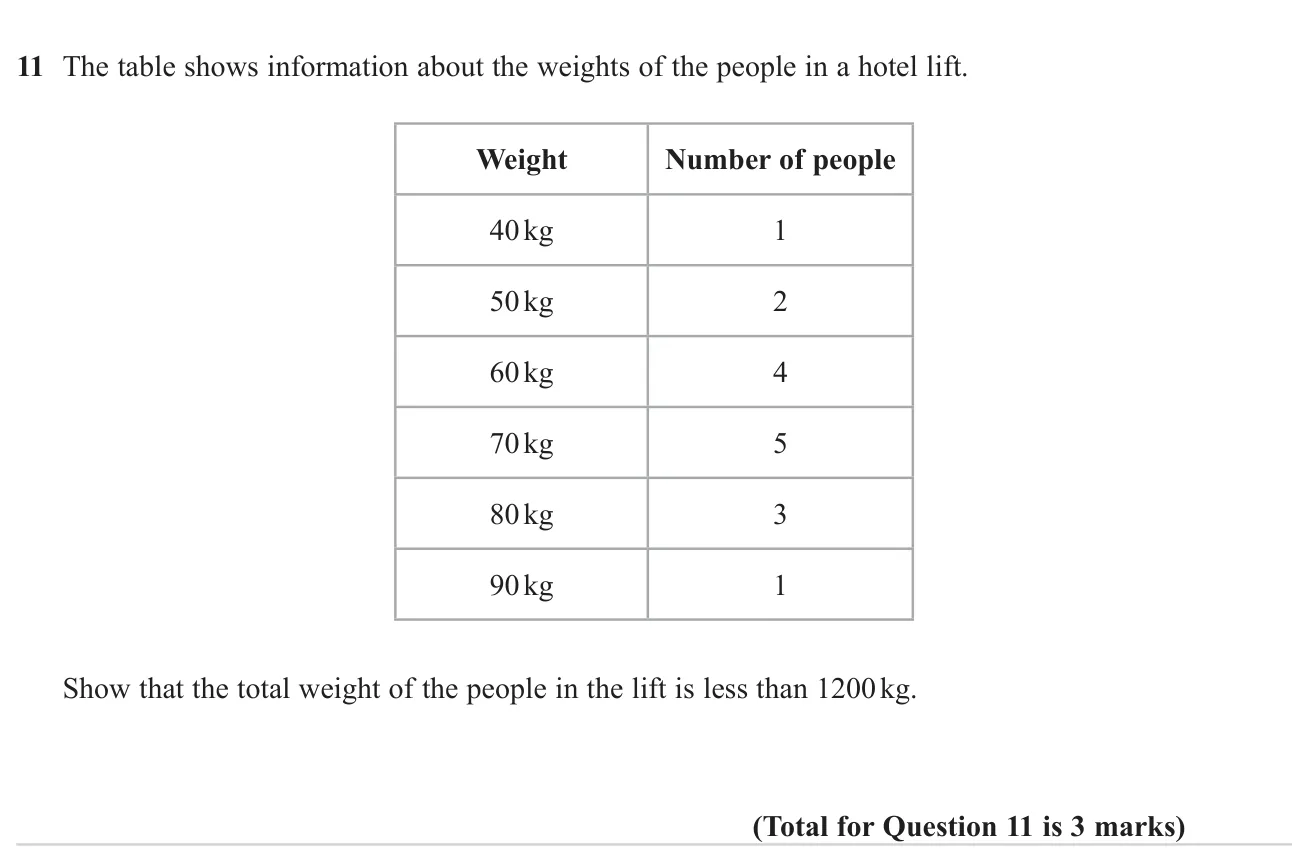
Answer Total is 1060 kg, which is less than 1200 kg 3 marks
Worked solution Checked against the mark scheme
Multiply each weight by how many people have it:
40 + 100 + 240 + 350 + 240 + 90 = 1060 40 + 100 + 240 + 350 + 240 + 90 = 1060 40 + 100 + 240 + 350 + 240 + 90 = 1060
1060 < 1200 1060 < 1200 1060 < 1200
Watch out: Adding the weights without multiplying by the number of people.
© Pearson Education Ltd. June 2023 Paper 3 (Foundation, calculator), question 9.
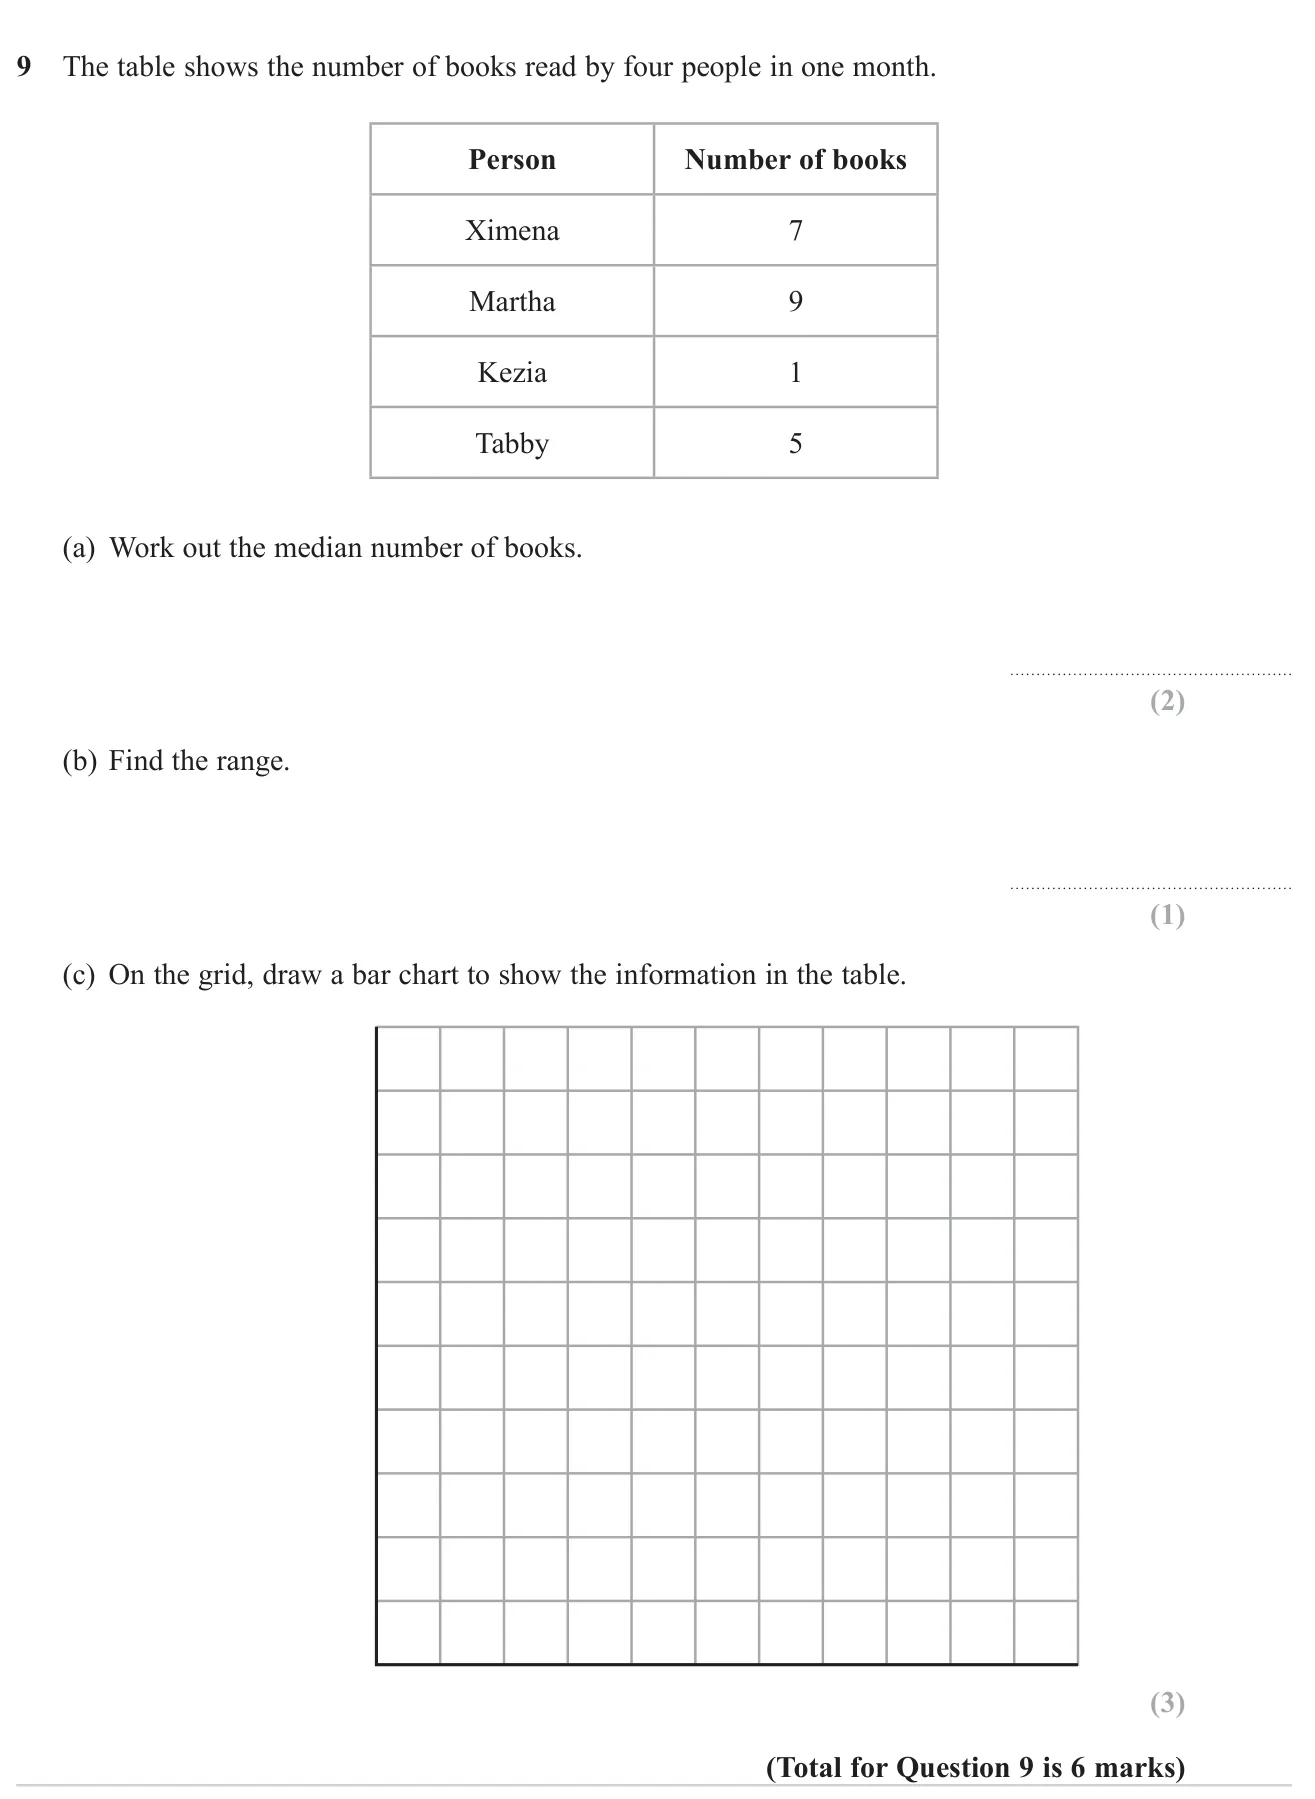
(a) 6 2 marks (b) 8 1 mark (c) Bar chart: Ximena 7, Martha 9, Kezia 1, Tabby 5 3 marks
Worked solution Checked against the mark scheme
(a) In order: 1, 5, 7, 9. The middle two are 5 and 7, so the median is ( 5 + 7 ) ÷ 2 = 6 (5 + 7) \div 2 = 6 ( 5 + 7 ) ÷ 2 = 6
(b) Range = 9 − 1 = 8 = 9 - 1 = 8 = 9 − 1 = 8
(c) Label each bar with a name, use an evenly spaced scale up the side, and draw bars of heights 7, 9, 1 and 5.
Watch out: In (a), not ordering first and taking the middle of 9 and 1.
© Pearson Education Ltd. November 2022 Paper 3 (Foundation, calculator), question 8.
Worked solution Checked against the mark scheme
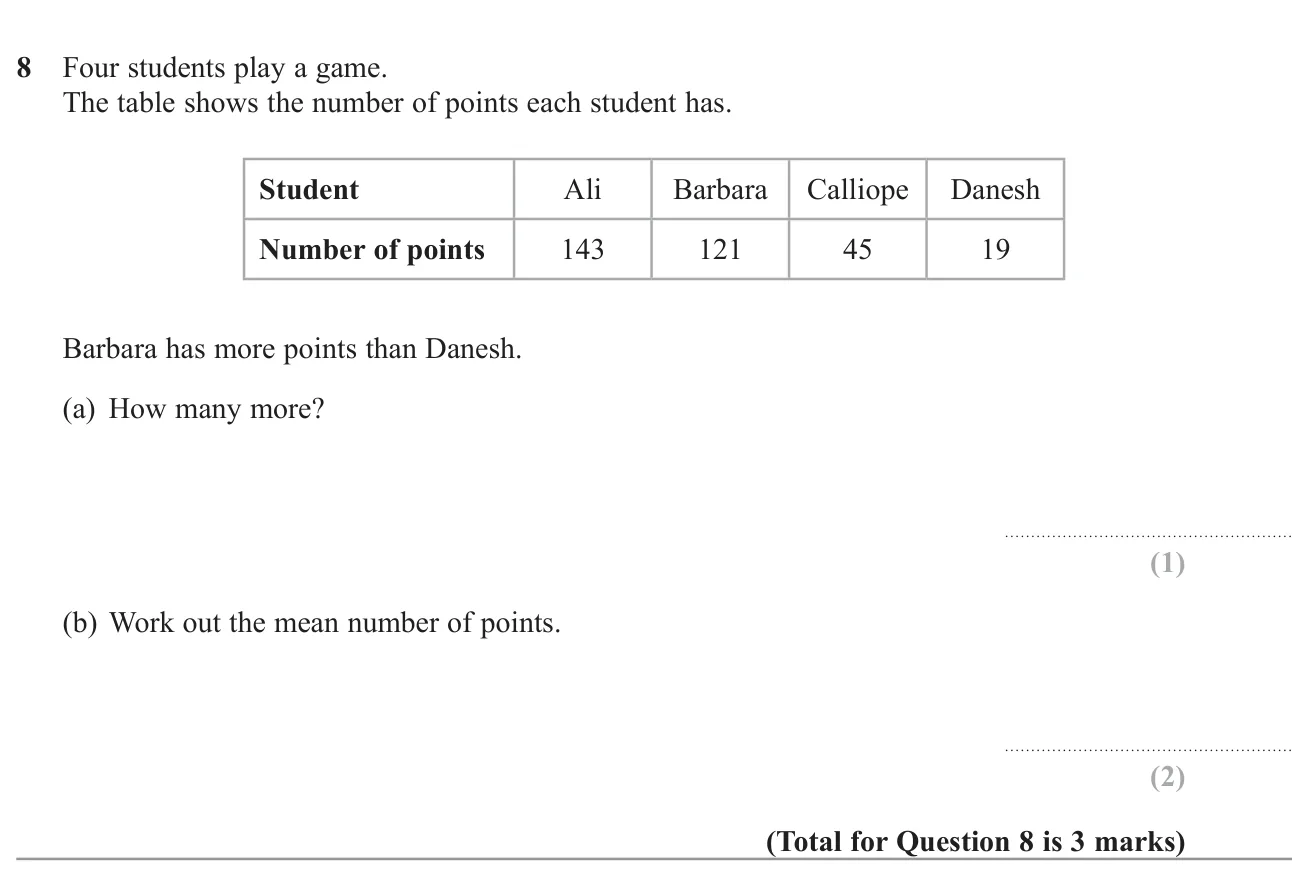
(a) 121 − 19 = 102 121 - 19 = 102 121 − 19 = 102
(b) Total = 143 + 121 + 45 + 19 = 328 = 143 + 121 + 45 + 19 = 328 = 143 + 121 + 45 + 19 = 328
Mean = 328 ÷ 4 = 82 = 328 \div 4 = 82 = 328 ÷ 4 = 82
Watch out: Dividing the total by a number other than 4.
© Pearson Education Ltd. November 2019 Paper 2 (Foundation, calculator), question 9.
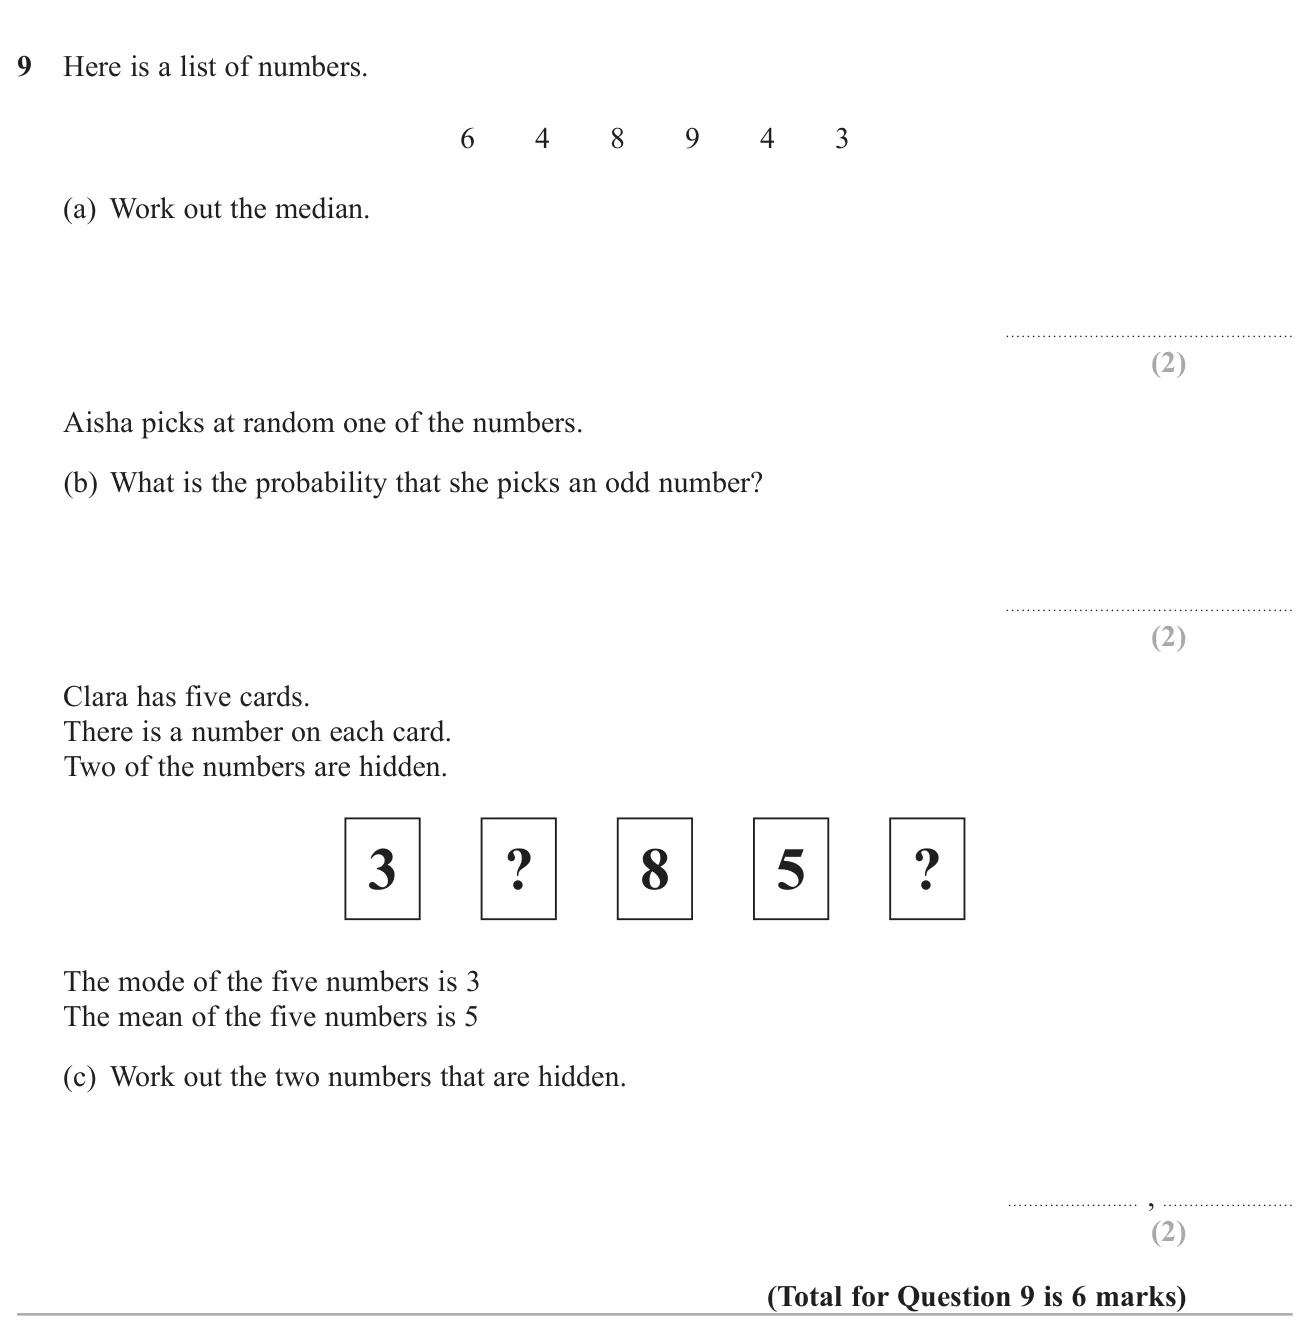
(a) 5 2 marks (b) 2 6 \frac{2}{6} 6 2 2 marks (c) 3 and 6 2 marks
Worked solution Checked against the mark scheme
(a) In order: 3, 4, 4, 6, 8, 9. The middle two are 4 and 6, so the median is 4 + 6 2 = 5 \frac{4+6}{2} = 5 2 4 + 6 = 5
(b) The odd numbers are 9 and 3, so P ( odd ) = 2 6 = 1 3 P(\text{odd}) = \frac{2}{6} = \frac{1}{3} P ( odd ) = 6 2 = 3 1
(c) Mode 3 means one hidden card is 3. Total = 5 × 5 = 25 = 5 \times 5 = 25 = 5 × 5 = 25 25 − 3 − 3 − 8 − 5 = 6 25 - 3 - 3 - 8 - 5 = 6 25 − 3 − 3 − 8 − 5 = 6
Watch out: In (a), forgetting to put the numbers in order first.
© Pearson Education Ltd. November 2019 Paper 3 (Foundation, calculator), question 13.
Worked solution Checked against the mark scheme
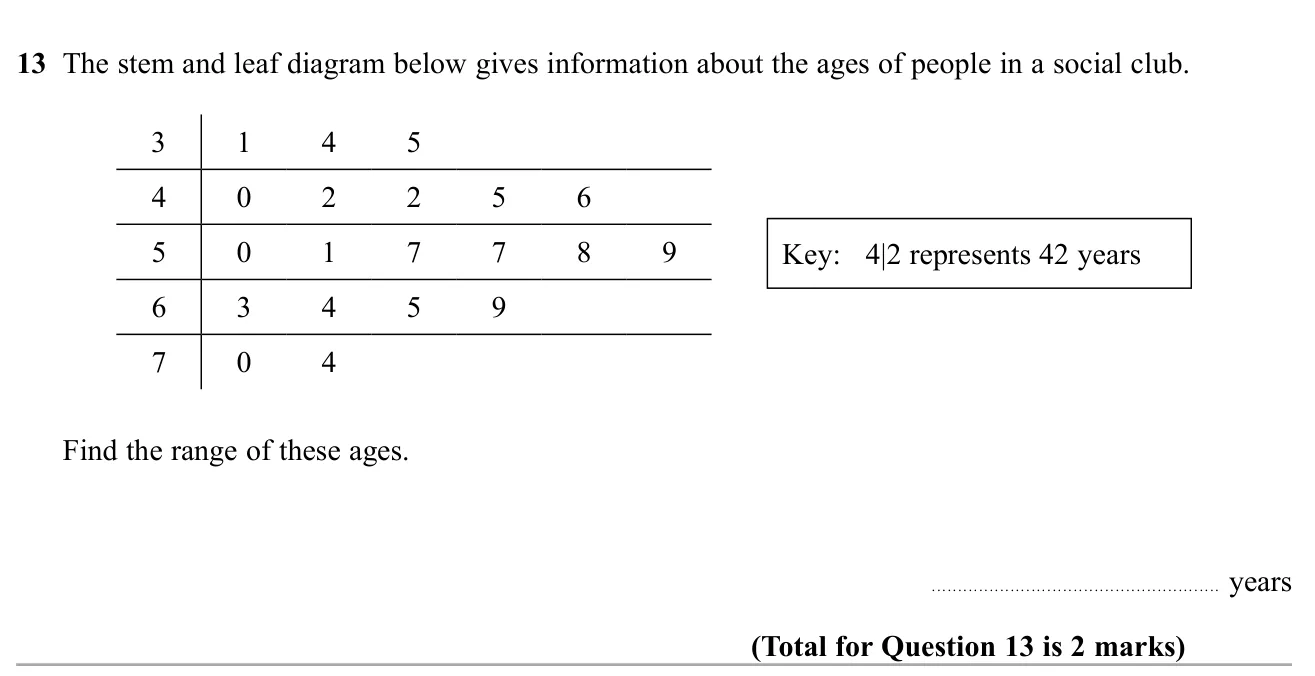
Smallest age: stem 3, leaf 1, which is 31.
Largest age: stem 7, leaf 4, which is 74.
Range = 74 − 31 = 43 = 74 - 31 = 43 = 74 − 31 = 43
Watch out: Using the leaves only, e.g. 9 − 0 9 - 0 9 − 0
© Pearson Education Ltd. June 2024 Paper 1 (Foundation, non-calculator), question 15.
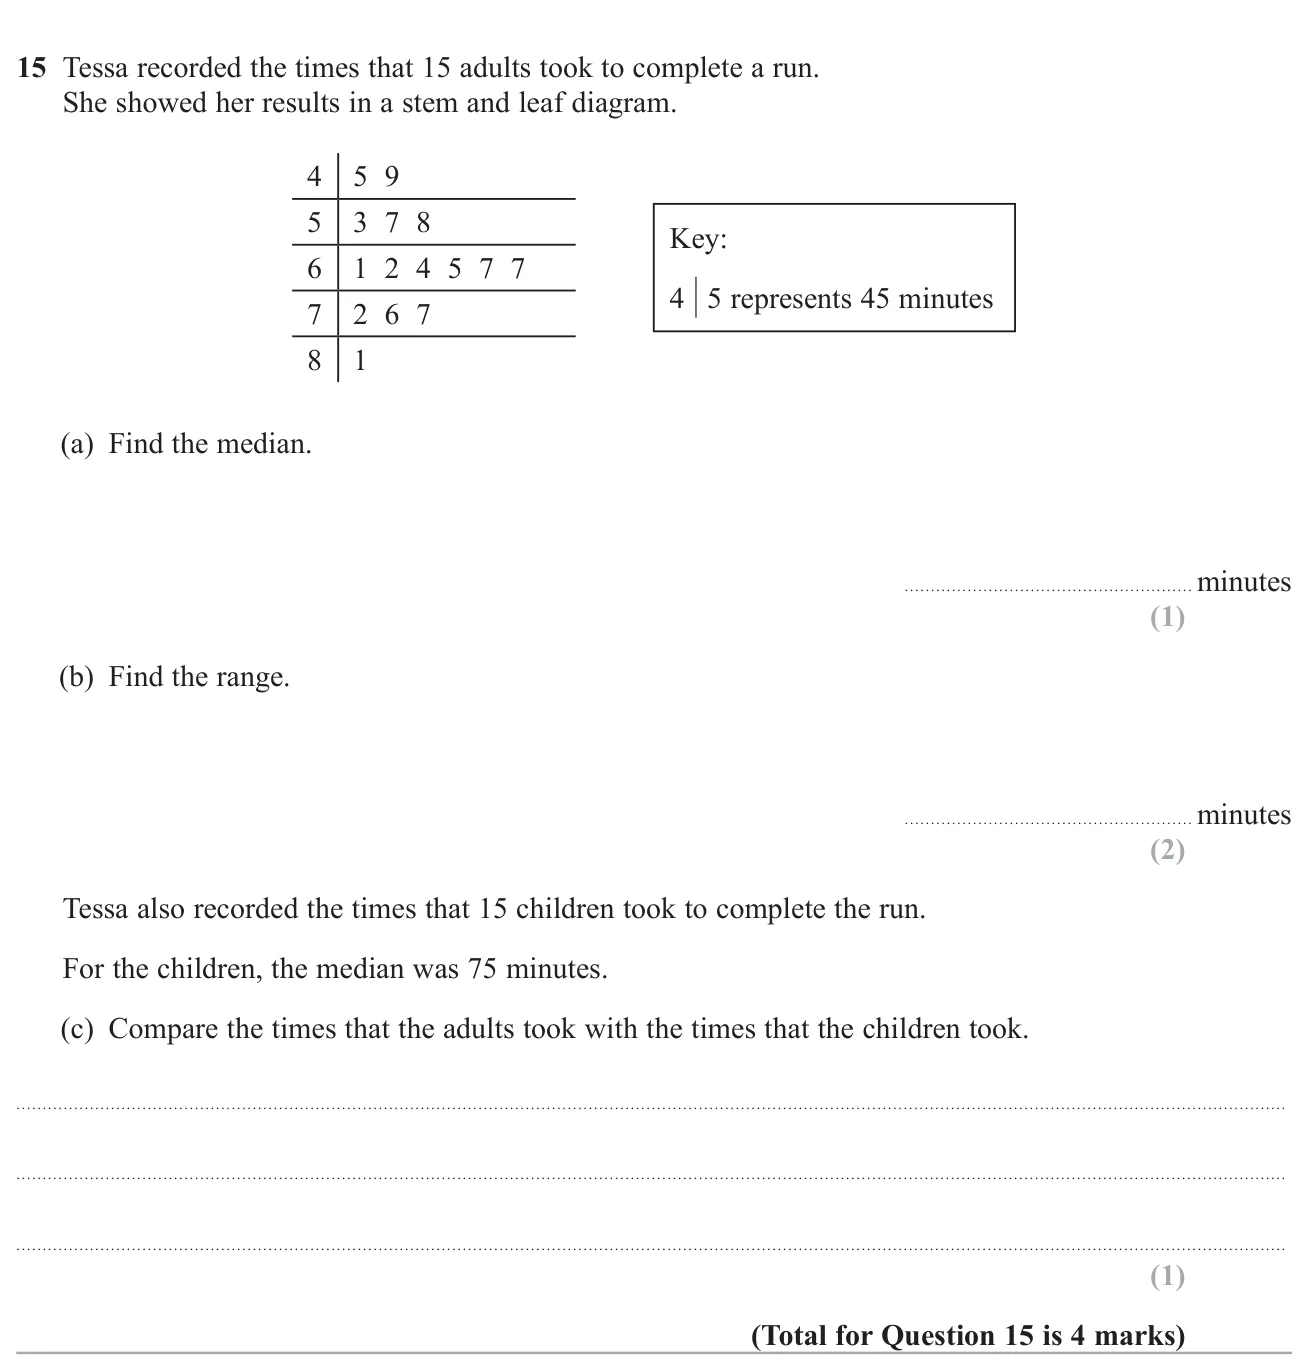
(a) 64 64 64 1 mark (b) 36 36 36 2 marks (c) The adults were faster on average (their median of 64 is lower than 75) 1 mark
Worked solution Checked against the mark scheme
(a) 15 values, so the median is the 8th: 64 64 64
(b) Range = 81 − 45 = 36 = 81 - 45 = 36 = 81 − 45 = 36
(c) Adults' median 64 < children's median 75, so on average the adults took less time.
Watch out: Using the leaves only, e.g. range 9 − 5 = 4.
© Pearson Education Ltd. June 2023 Paper 2 (Foundation, calculator), question 17.
Worked solution Checked against the mark scheme
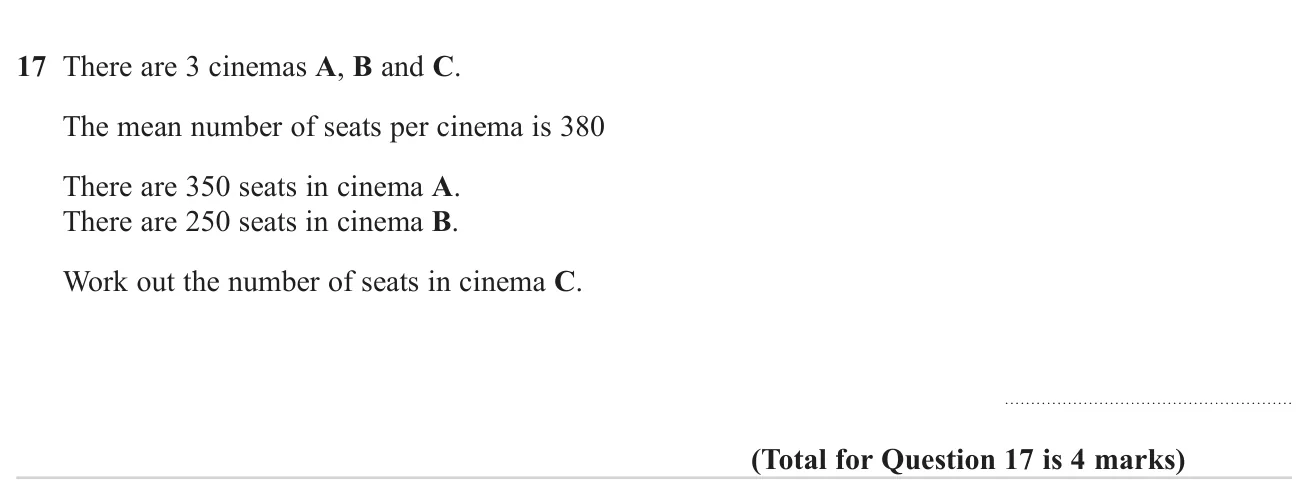
Total seats = 3 × 380 = 1140 = 3 \times 380 = 1140 = 3 × 380 = 1140
A and B together: 350 + 250 = 600 350 + 250 = 600 350 + 250 = 600
Cinema C: 1140 − 600 = 540 1140 - 600 = 540 1140 − 600 = 540
Watch out: Dividing by 3 again or averaging the two known values.
© Pearson Education Ltd. November 2022 Paper 2 (Foundation, calculator), question 15.
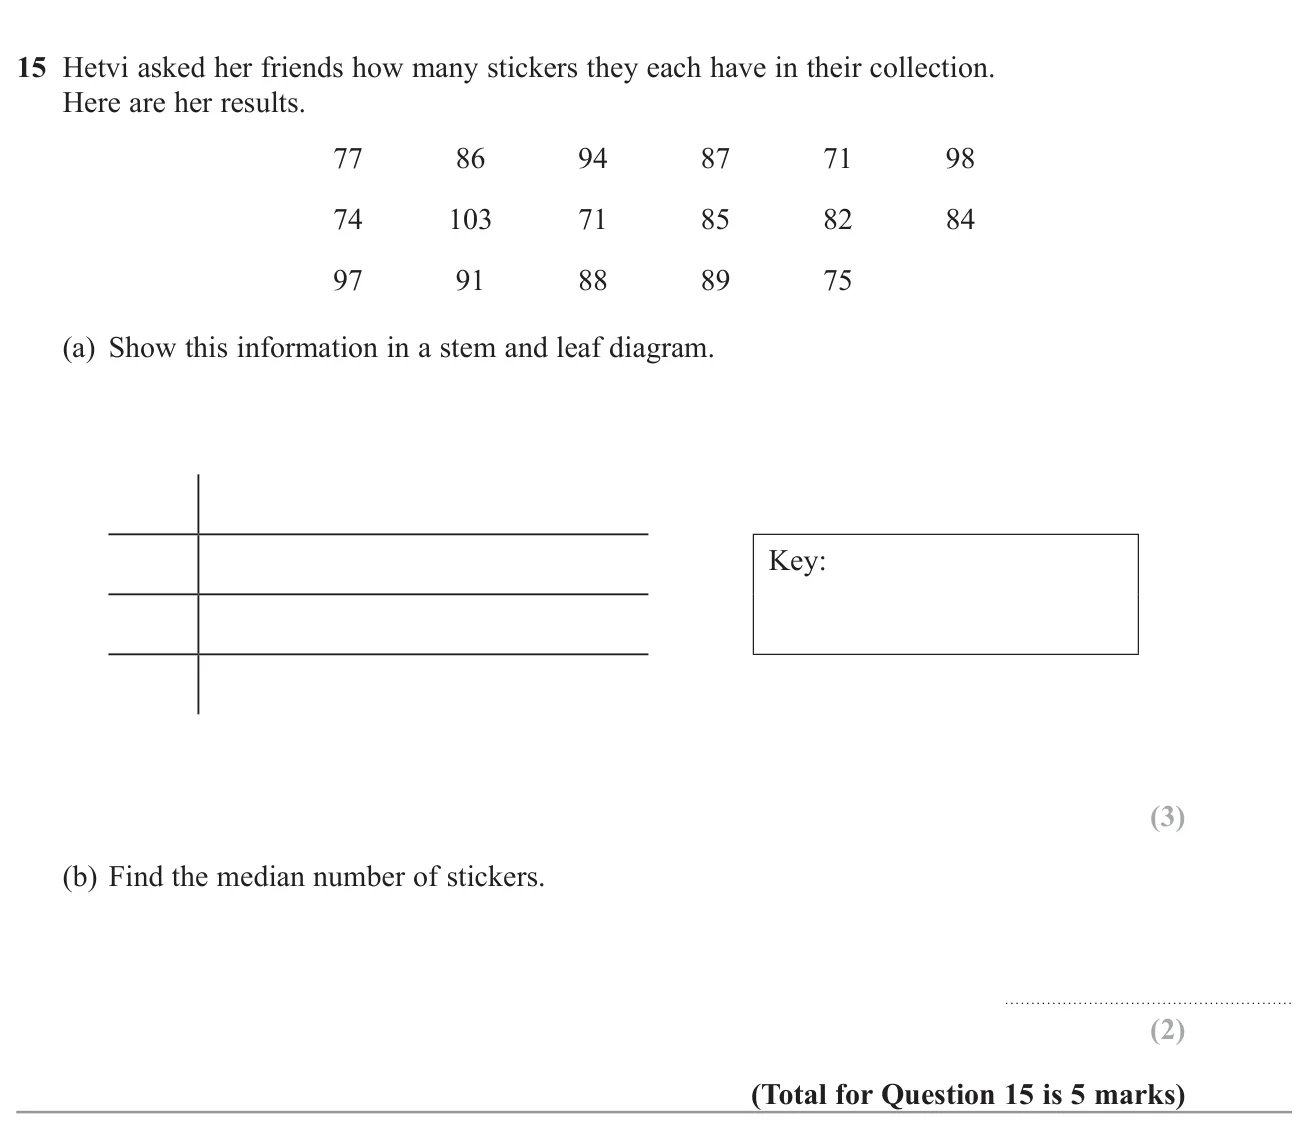
(a) Stems 7 to 10: 7 | 1 1 4 5 7; 8 | 2 4 5 6 7 8 9; 9 | 1 4 7 8; 10 | 3; key 7 | 1 = 71 3 marks (b) 86 2 marks
Worked solution Checked against the mark scheme
(a) Use tens as the stem and units as the leaves, in order:
7 | 1 1 4 5 7
Key: 7 | 1 means 71
(b) There are 17 values, so the median is the 17 + 1 2 = 9 \frac{17+1}{2} = 9 2 17 + 1 = 9 86 .
Watch out: Forgetting the key or leaving the leaves unordered.
© Pearson Education Ltd. June 2022 Paper 2 (Foundation, calculator), question 15.
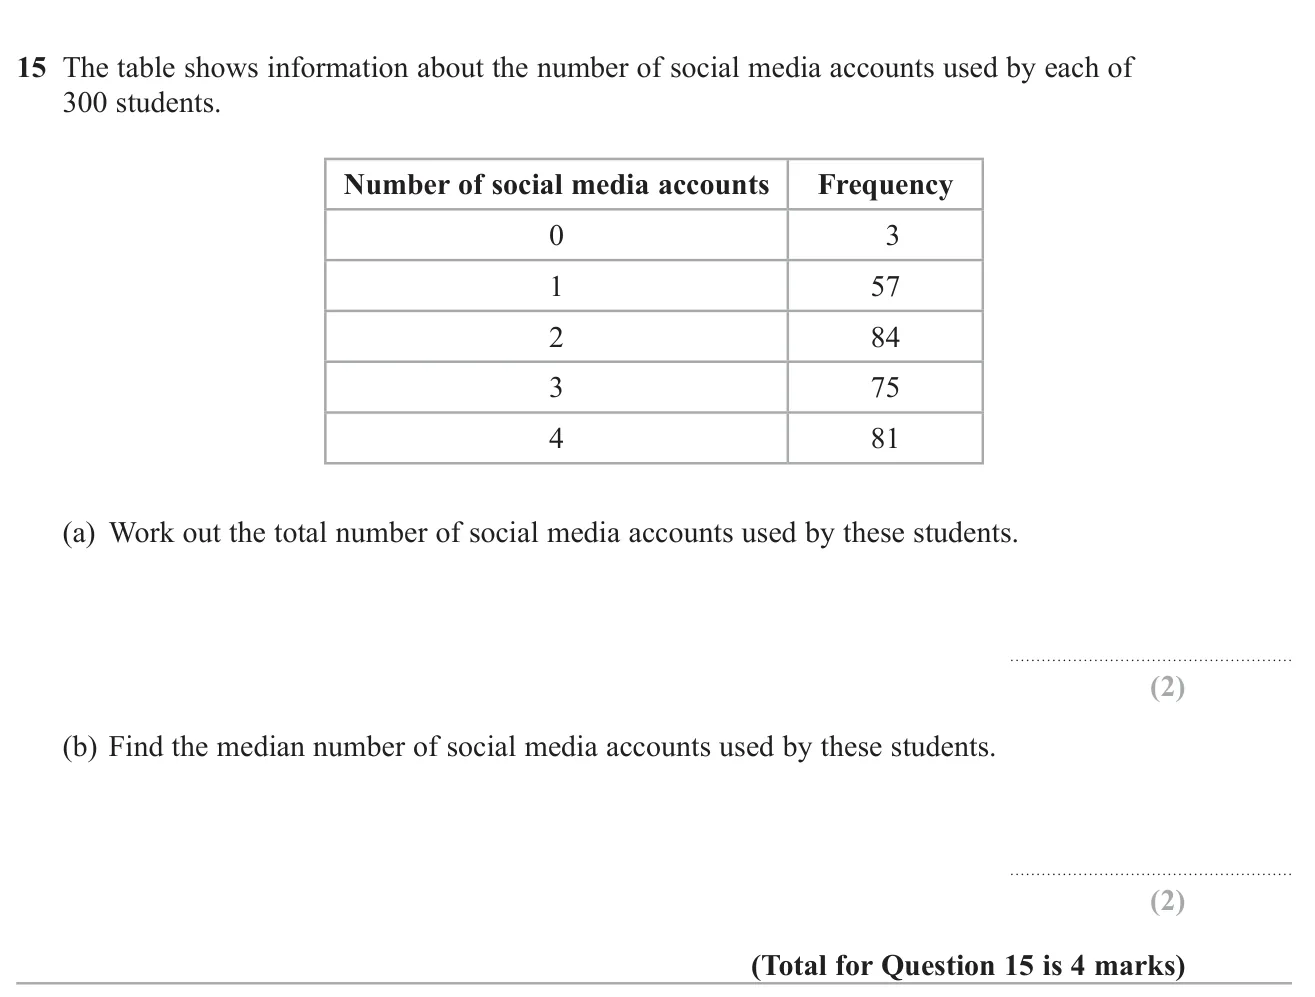
Worked solution Checked against the mark scheme
(a) 0 × 3 + 1 × 57 + 2 × 84 + 3 × 75 + 4 × 81 = 0 + 57 + 168 + 225 + 324 = 774 0\times3 + 1\times57 + 2\times84 + 3\times75 + 4\times81 = 0 + 57 + 168 + 225 + 324 = 774 0 × 3 + 1 × 57 + 2 × 84 + 3 × 75 + 4 × 81 = 0 + 57 + 168 + 225 + 324 = 774
(b) There are 300 students, so the median is between the 150th and 151st values.
Running totals: 3, 60, 144, 219. The 150th and 151st are both in the '3' row, so the median is 3.
Watch out: Giving the middle frequency (75) or the middle row (2) as the median.
© Pearson Education Ltd. June 2022 Paper 2 (Foundation, calculator), question 18.
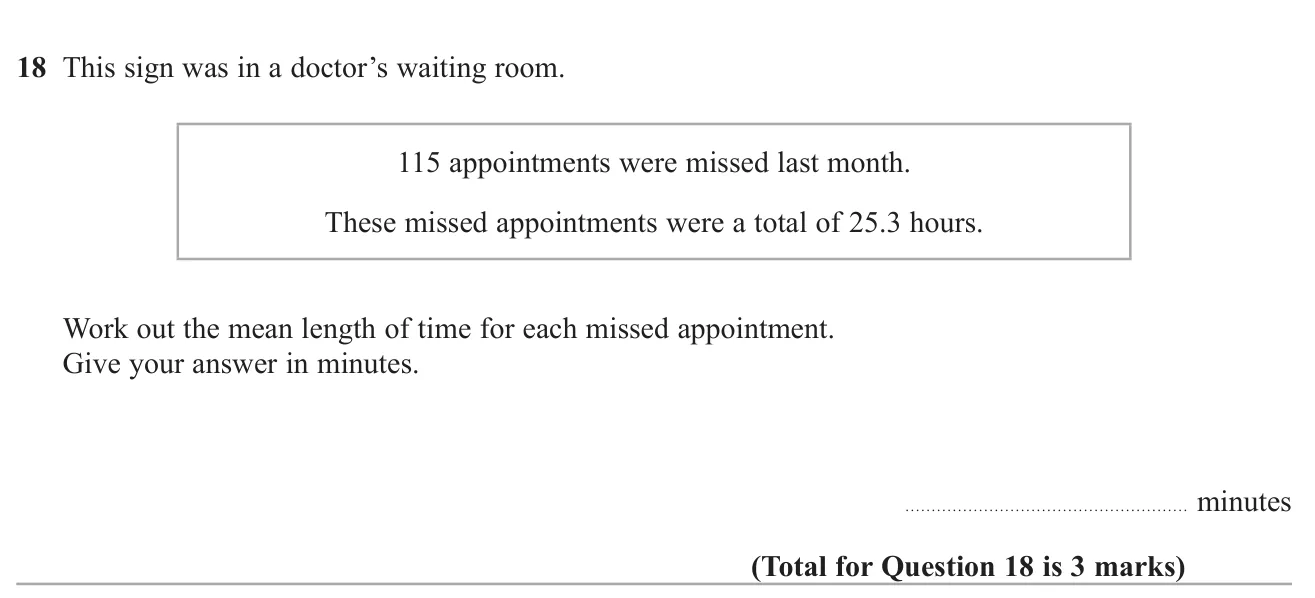
Answer 13.2 minutes 3 marks
Worked solution Checked against the mark scheme
Change hours to minutes: 25.3 × 60 = 1518 25.3 \times 60 = 1518 25.3 × 60 = 1518
Mean: 1518 ÷ 115 = 13.2 1518 \div 115 = 13.2 1518 ÷ 115 = 13.2
Watch out: Treating 25.3 hours as 25 hours 30 minutes.
© Pearson Education Ltd. June 2022 Paper 3 (Foundation, calculator), question 14.
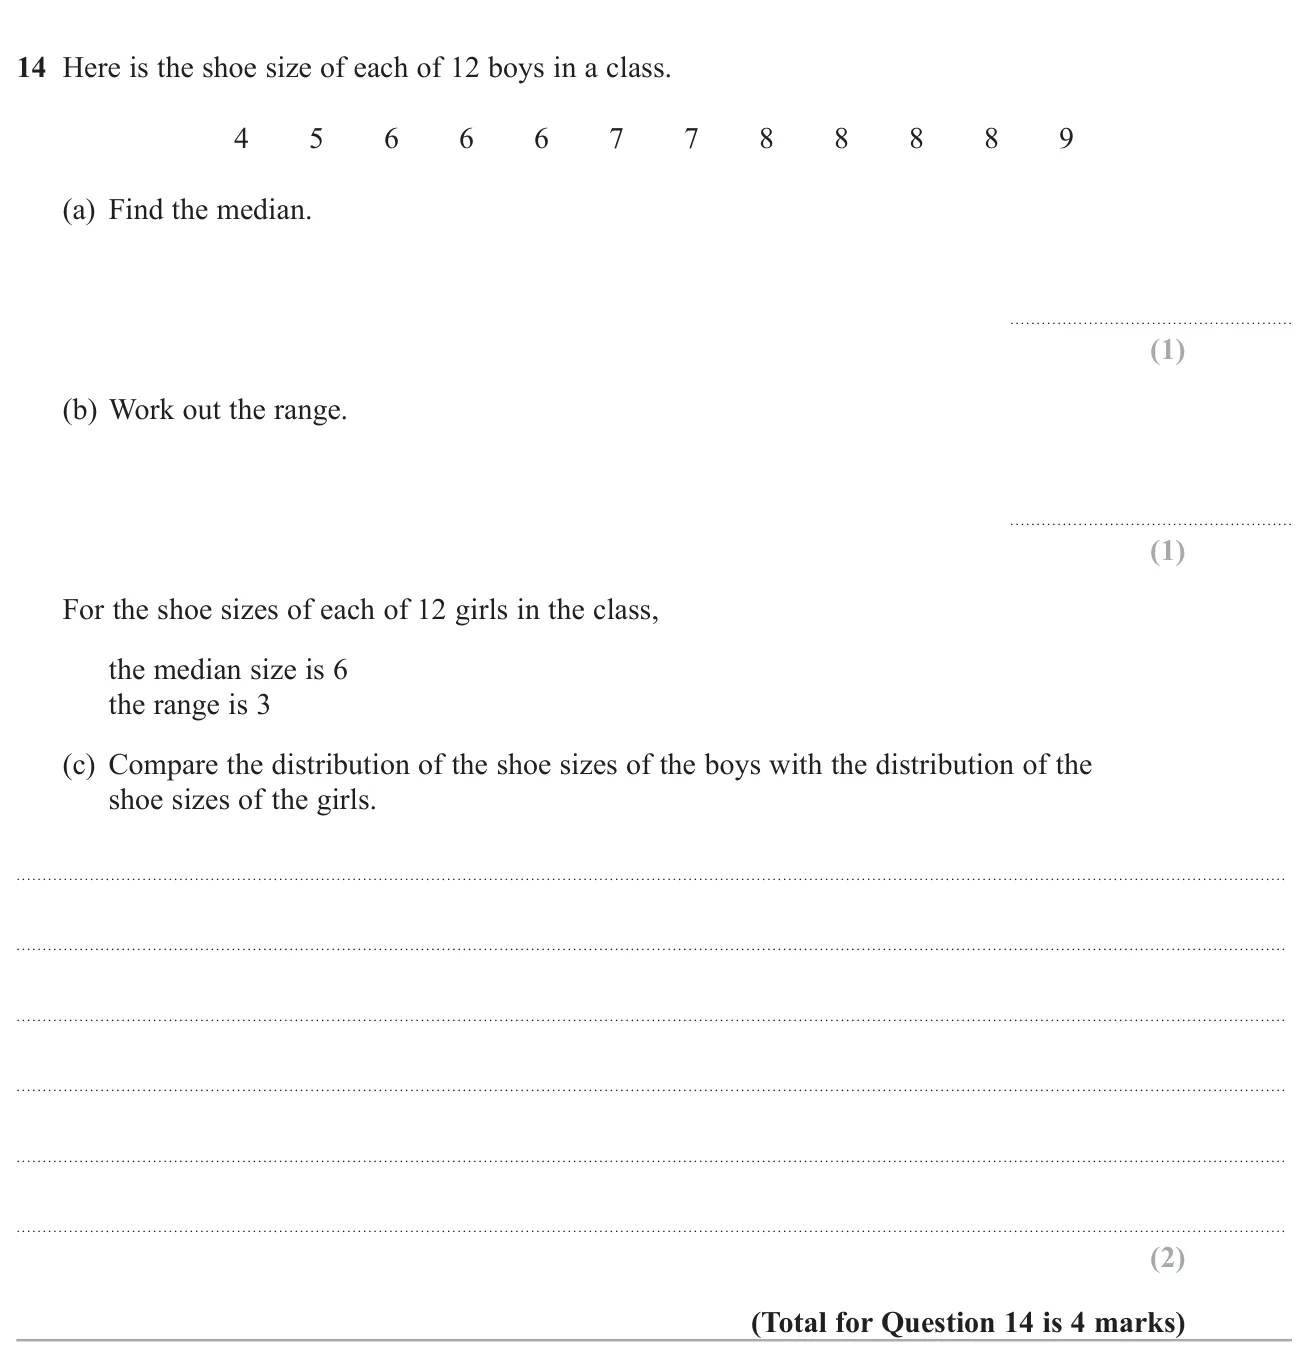
(a) 7 1 mark (b) 5 1 mark (c) Boys have a bigger median, so larger feet on average; boys have a bigger range, so their sizes are more varied 2 marks
Worked solution Checked against the mark scheme
(a) 12 values, so the median is halfway between the 6th and 7th: both are 7, so median = 7
(b) 9 − 4 = 5 9 - 4 = 5 9 − 4 = 5
(c) Boys' median 7 > girls' 6, so boys' shoe sizes are larger on average.
Boys' range 5 > girls' 3, so boys' sizes are more spread out.
Watch out: In (c) just quoting the numbers without saying which is bigger and what that means.
© Pearson Education Ltd. November 2020 Paper 1 (Foundation, non-calculator), question 16.
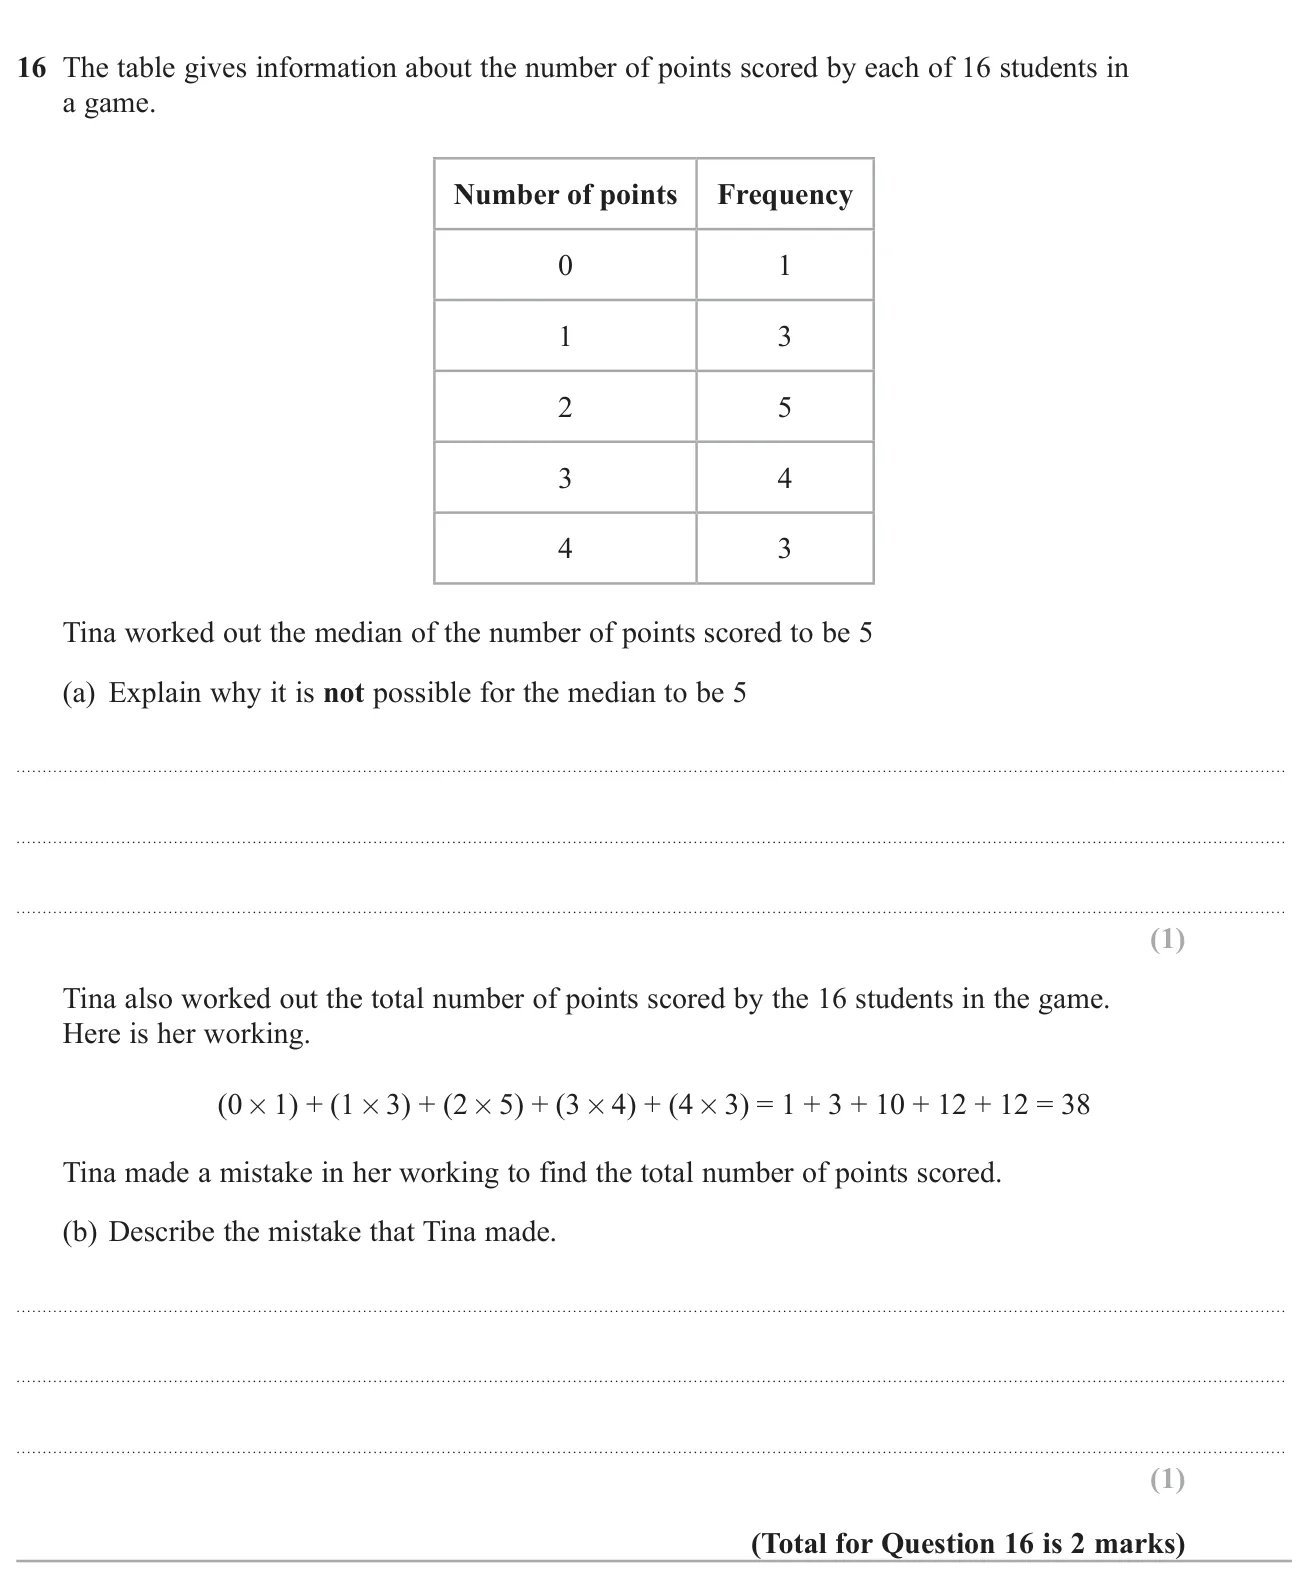
(a) The highest score is 4, so the median cannot be 5 (it is actually 2) 1 mark (b) She wrote 0 × 1 = 1 0 \times 1 = 1 0 × 1 = 1 1 mark
Worked solution Checked against the mark scheme
(a) Nobody scored more than 4 points, so the middle value cannot be 5. The 8th and 9th scores are both 2, so the median is 2.
(b) 0 × 1 = 0 0 \times 1 = 0 0 × 1 = 0 0 + 3 + 10 + 12 + 12 = 37 0 + 3 + 10 + 12 + 12 = 37 0 + 3 + 10 + 12 + 12 = 37
Watch out: Finding the middle of the frequency column instead of the points.
© Pearson Education Ltd. June 2019 Paper 3 (Foundation, calculator), question 18.
Worked solution Checked against the mark scheme
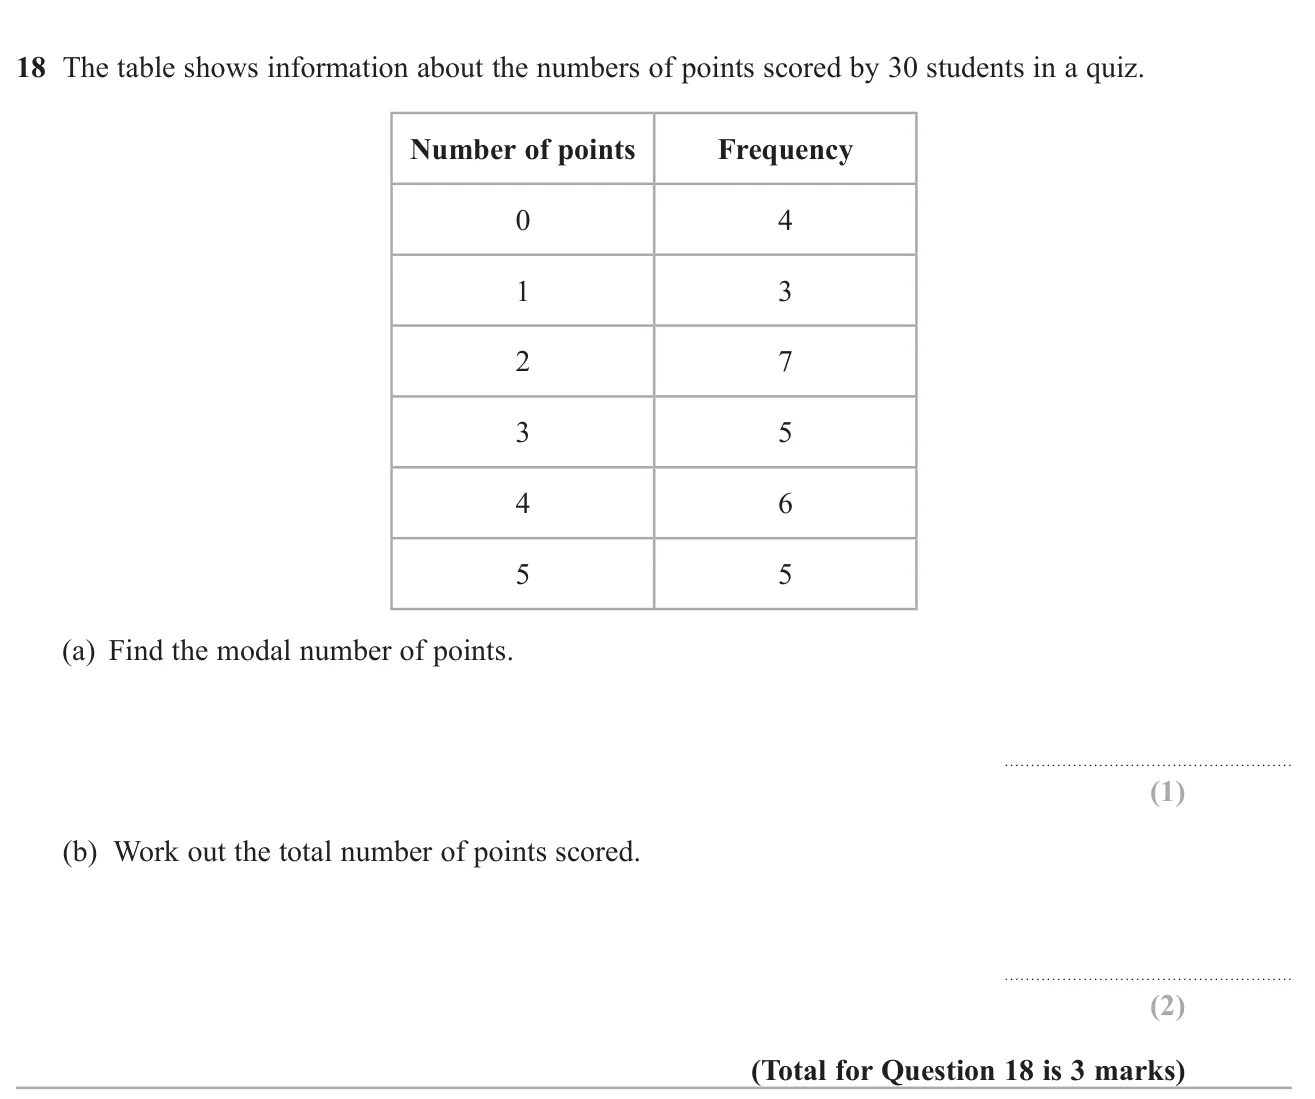
(a) The highest frequency is 7, for 2 points, so the mode is 2.
(b) 0 × 4 + 1 × 3 + 2 × 7 + 3 × 5 + 4 × 6 + 5 × 5 0\times4 + 1\times3 + 2\times7 + 3\times5 + 4\times6 + 5\times5 0 × 4 + 1 × 3 + 2 × 7 + 3 × 5 + 4 × 6 + 5 × 5
= 0 + 3 + 14 + 15 + 24 + 25 = 81 = 0 + 3 + 14 + 15 + 24 + 25 = 81 = 0 + 3 + 14 + 15 + 24 + 25 = 81
Watch out: In (a), giving 7 (the frequency) instead of 2.
© Pearson Education Ltd. Specimen Paper 2 (Foundation, calculator), question 10.
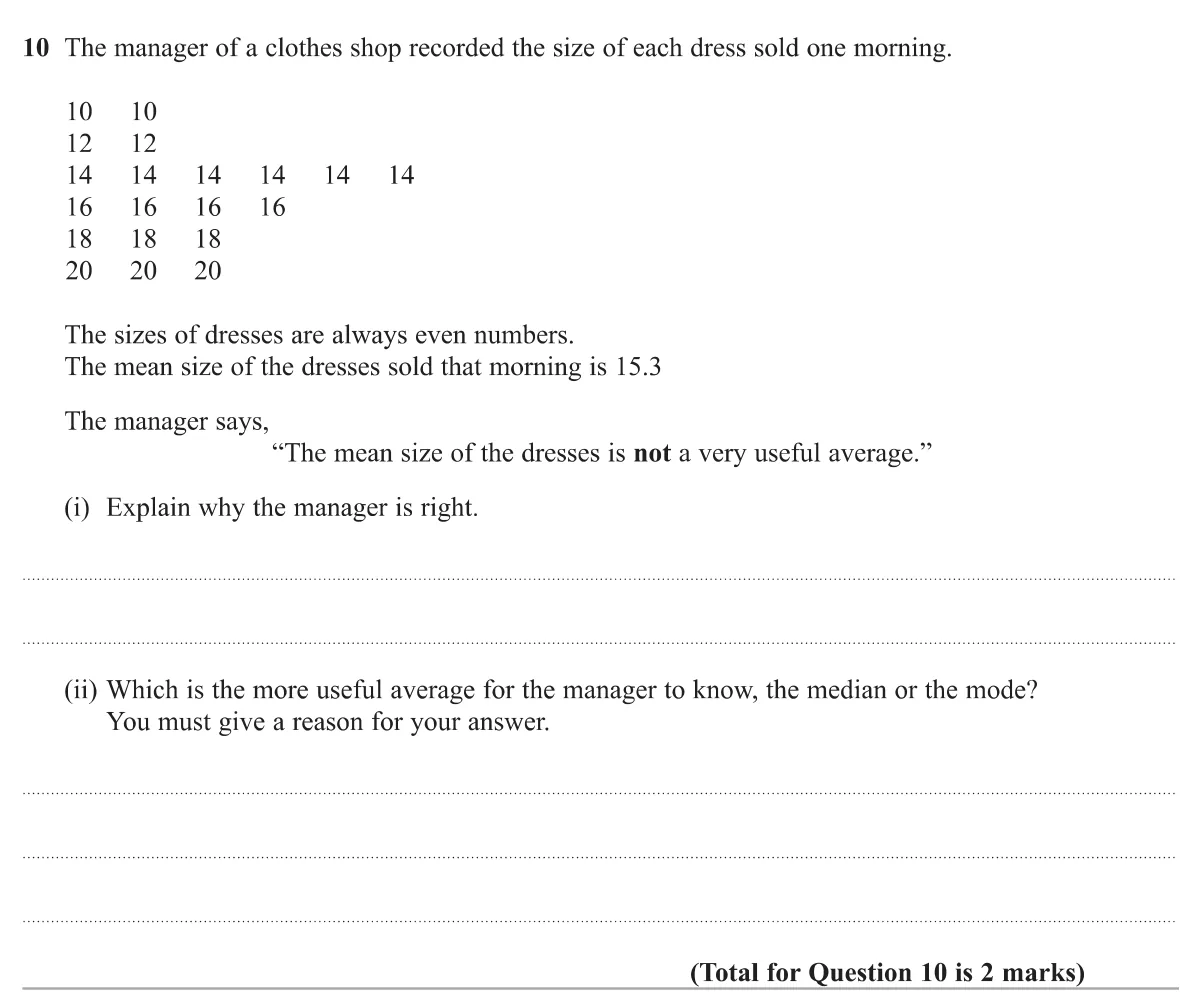
((i)) Dress sizes are even numbers, so there is no size 15.3 1 mark ((ii)) Mode (14), because it shows the size that sells most 1 mark
Worked solution Checked against the mark scheme
(i) Dresses only come in even sizes, so a size of 15.3 does not exist.
(ii) The mode is 14. It tells the manager which size sells most often, so which to stock more of.
Watch out: Choosing the median without a reason linked to stock.
© Pearson Education Ltd. June 2024 Paper 1 (Higher, non-calculator), question 8.
Worked solution Checked against the mark scheme
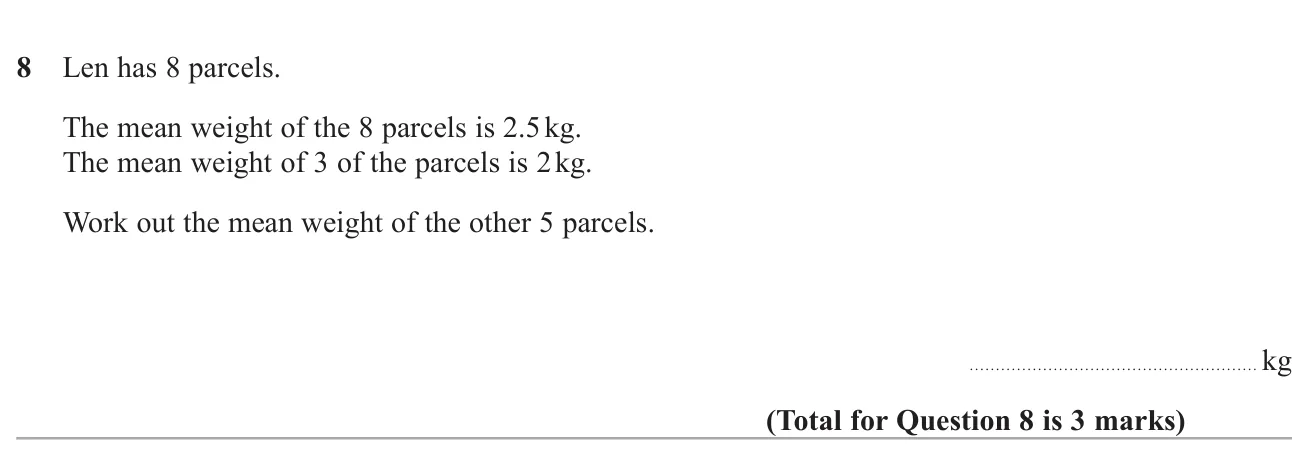
Total weight of 8 parcels: 8 × 2.5 = 20 8 \times 2.5 = 20 8 × 2.5 = 20
Total of the 3 parcels: 3 × 2 = 6 3 \times 2 = 6 3 × 2 = 6
The other 5 weigh 20 − 6 = 14 20 - 6 = 14 20 − 6 = 14 14 ÷ 5 = 2.8 14 \div 5 = 2.8 14 ÷ 5 = 2.8
Watch out: Working with the means directly, e.g. ( 2.5 × 2 − 2 ) (2.5 \times 2 - 2) ( 2.5 × 2 − 2 )
© Pearson Education Ltd. November 2024 Paper 3 (Foundation, calculator), question 15.
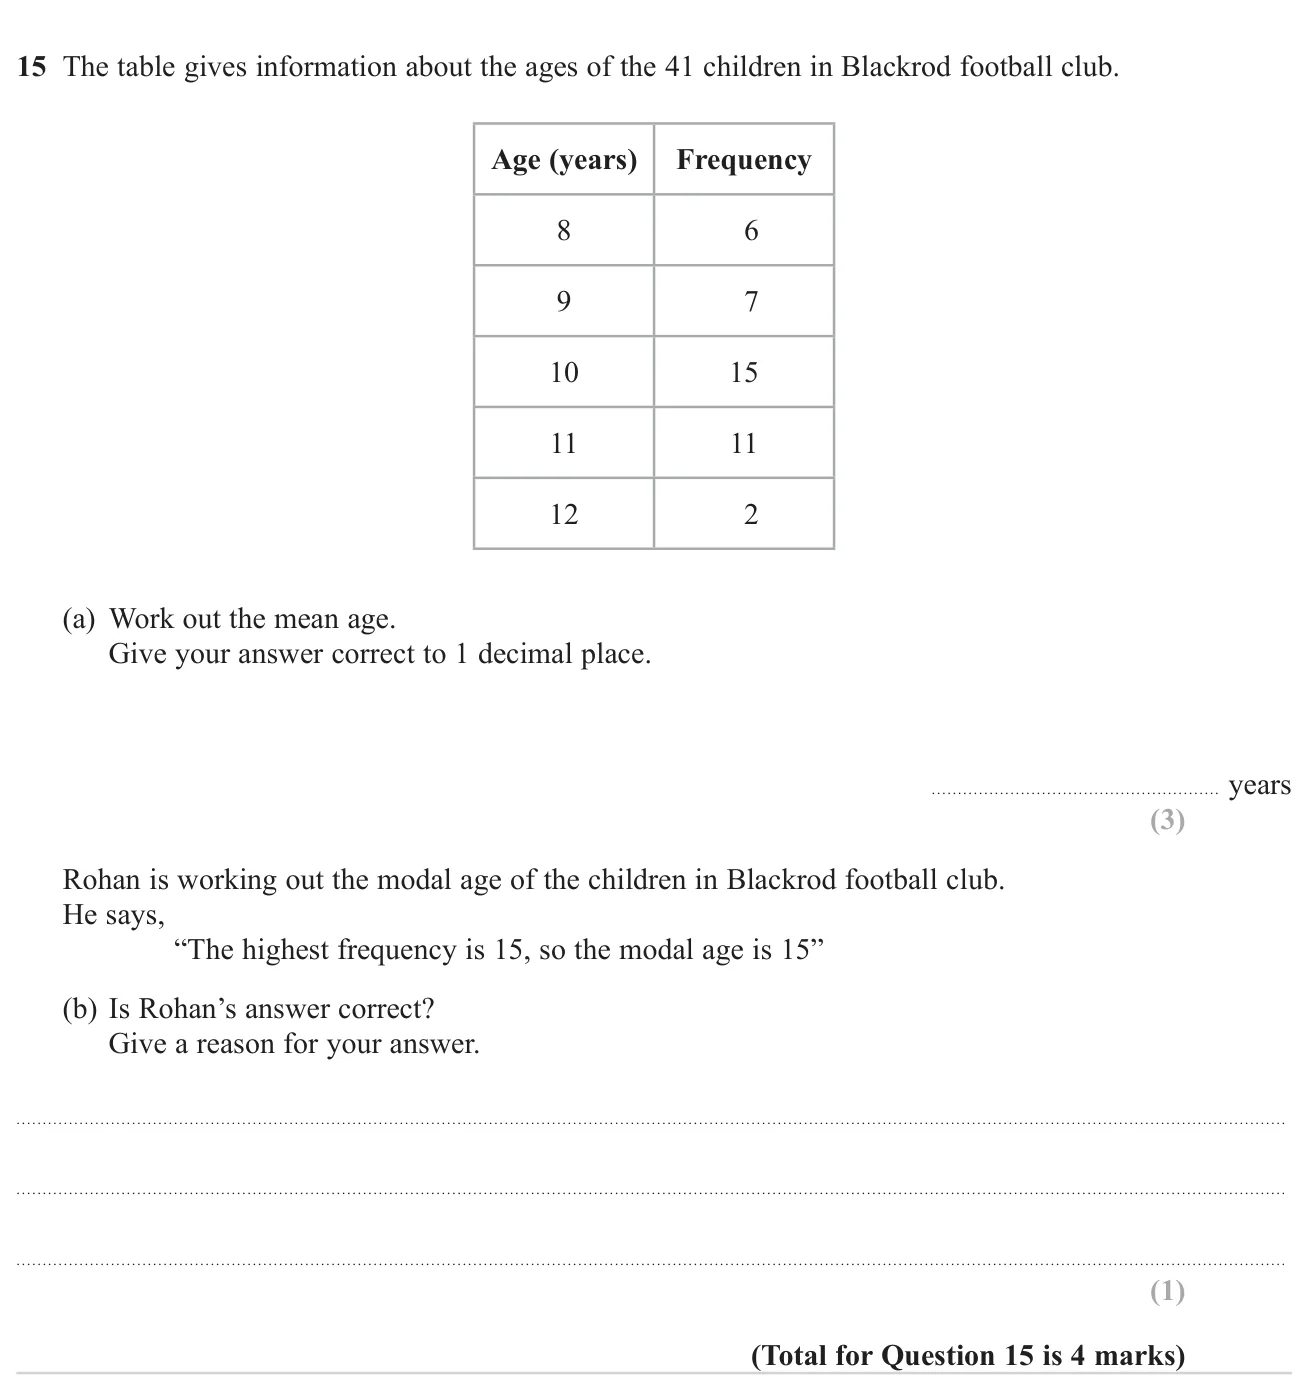
(a) 9.9 9.9 9.9 3 marks (b) No: the mode is 10, the age with the highest frequency (15 is a frequency, not an age) 1 mark
Worked solution Checked against the mark scheme
(a) ∑ f x = 48 + 63 + 150 + 121 + 24 = 406 \sum fx = 48 + 63 + 150 + 121 + 24 = 406 ∑ f x = 48 + 63 + 150 + 121 + 24 = 406
Mean = 406 ÷ 41 = 9.90... ≈ 9.9 = 406 \div 41 = 9.90... \approx 9.9 = 406 ÷ 41 = 9.90... ≈ 9.9
(b) No. 15 is how many children there are, not an age. The modal age is 10 .
Watch out: Dividing by 5 (the number of rows) instead of 41.
© Pearson Education Ltd. November 2024 Paper 3 (Foundation, calculator), question 22.
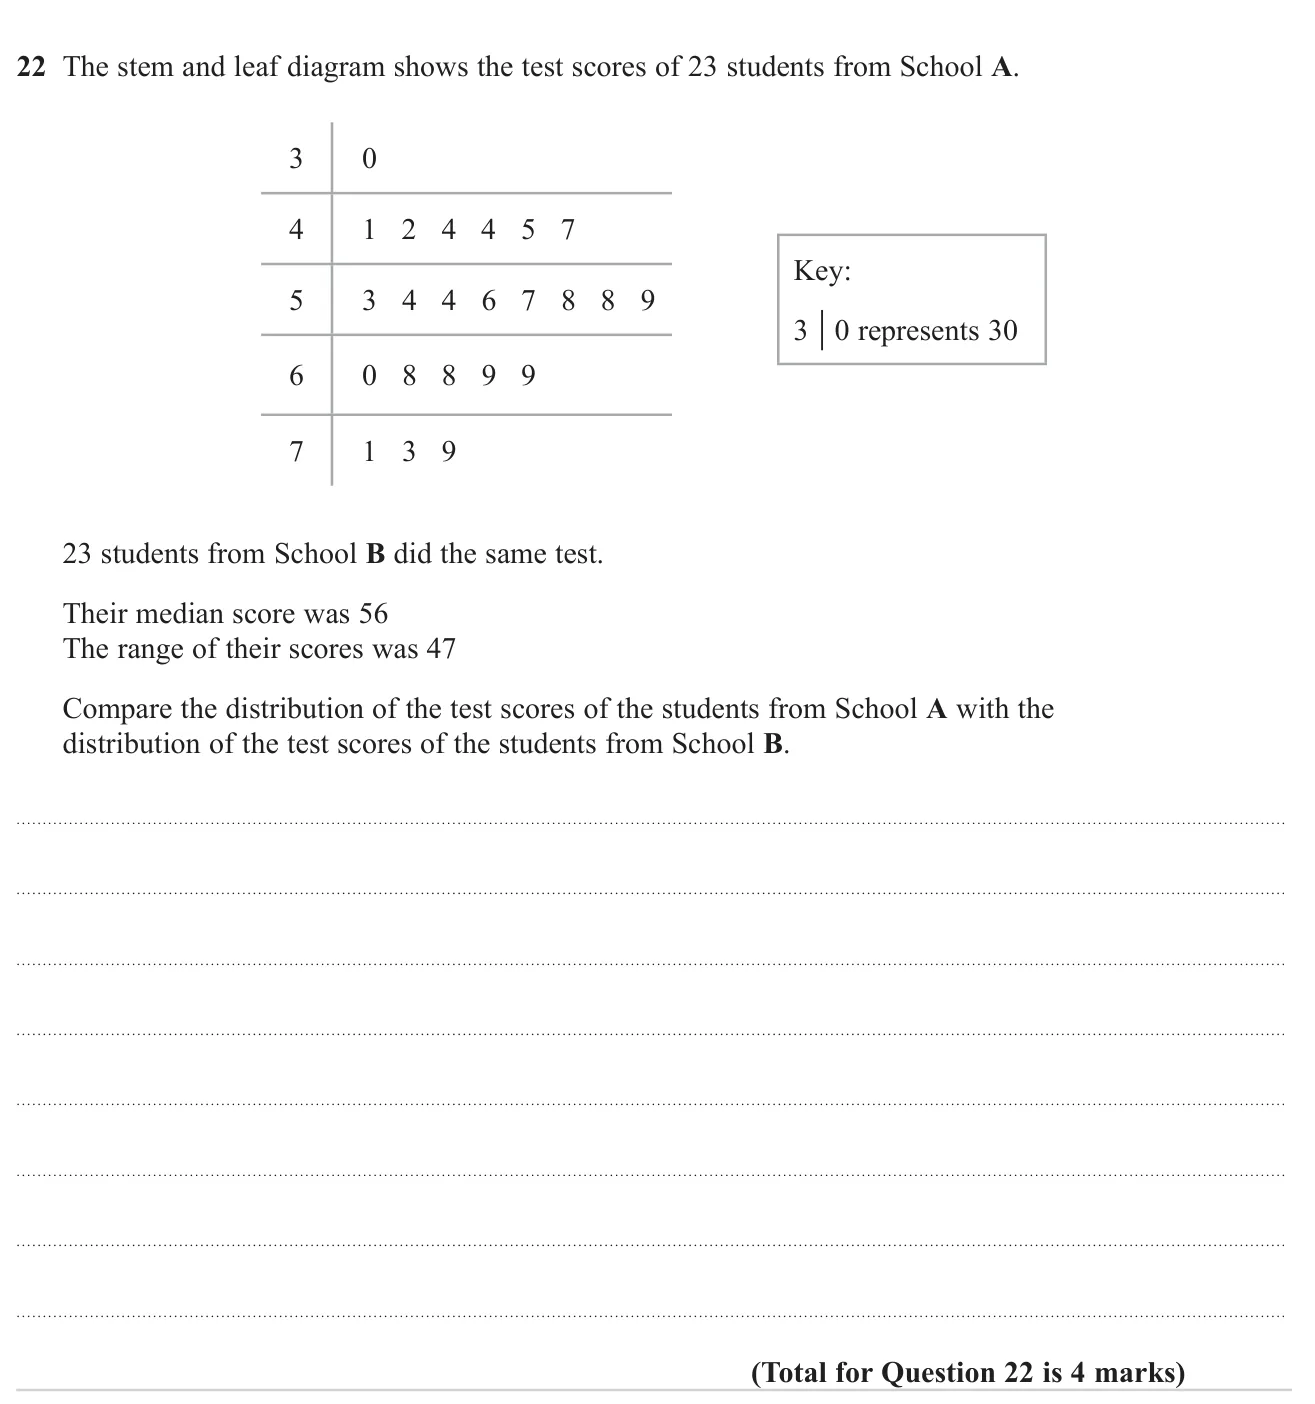
Answer School A median 57 is higher than B's 56; School A range 49 is higher than B's 47, so A's scores are more spread out 4 marks
Worked solution Checked against the mark scheme
School A has 23 scores, so the median is the 12th: 57 .
Range: 79 − 30 = 49 79 - 30 = 49 79 − 30 = 49
Median: A (57) is higher than B (56), so A did slightly better on average.
Range: A (49) is higher than B (47), so A's scores were more spread out.
Watch out: Only quoting the numbers without saying which school is higher.
© Pearson Education Ltd. November 2023 Paper 3 (Foundation, calculator), question 22.
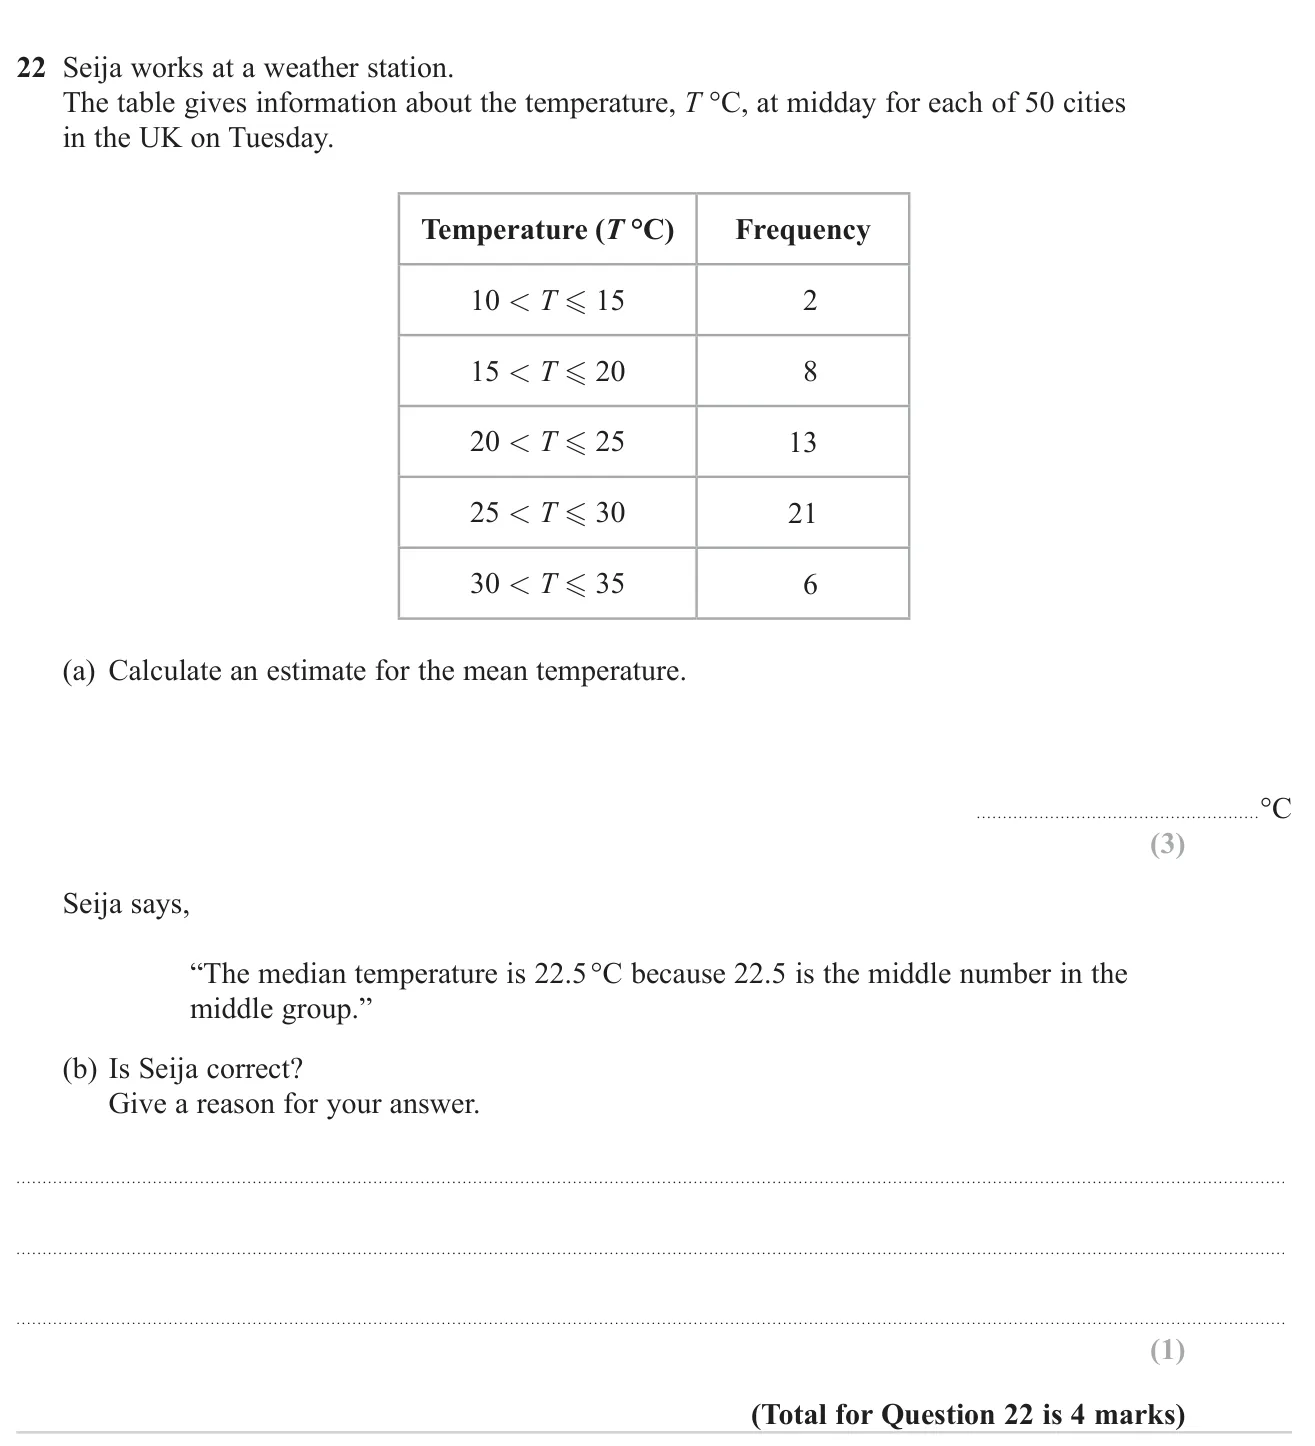
(a) 24.6 °C 3 marks (b) No: the median is the 25th–26th value, which lies in the 25 < T ≤ 30 group 1 mark
Worked solution Checked against the mark scheme
(a) Midpoints 12.5, 17.5, 22.5, 27.5, 32.5.
∑ f x = 25 + 140 + 292.5 + 577.5 + 195 = 1230 \sum fx = 25 + 140 + 292.5 + 577.5 + 195 = 1230 ∑ f x = 25 + 140 + 292.5 + 577.5 + 195 = 1230
Mean ≈ 1230 ÷ 50 = 24.6 \approx 1230 \div 50 = 24.6 ≈ 1230 ÷ 50 = 24.6
(b) No. The median is about the 25.5th value. 2 + 8 + 13 = 23 2 + 8 + 13 = 23 2 + 8 + 13 = 23 25 < T ≤ 30 25 < T \le 30 25 < T ≤ 30
Watch out: In (a), dividing by 5 (the number of groups) instead of 50.
© Pearson Education Ltd. November 2022 Paper 2 (Foundation, calculator), question 17.
Worked solution Checked against the mark scheme
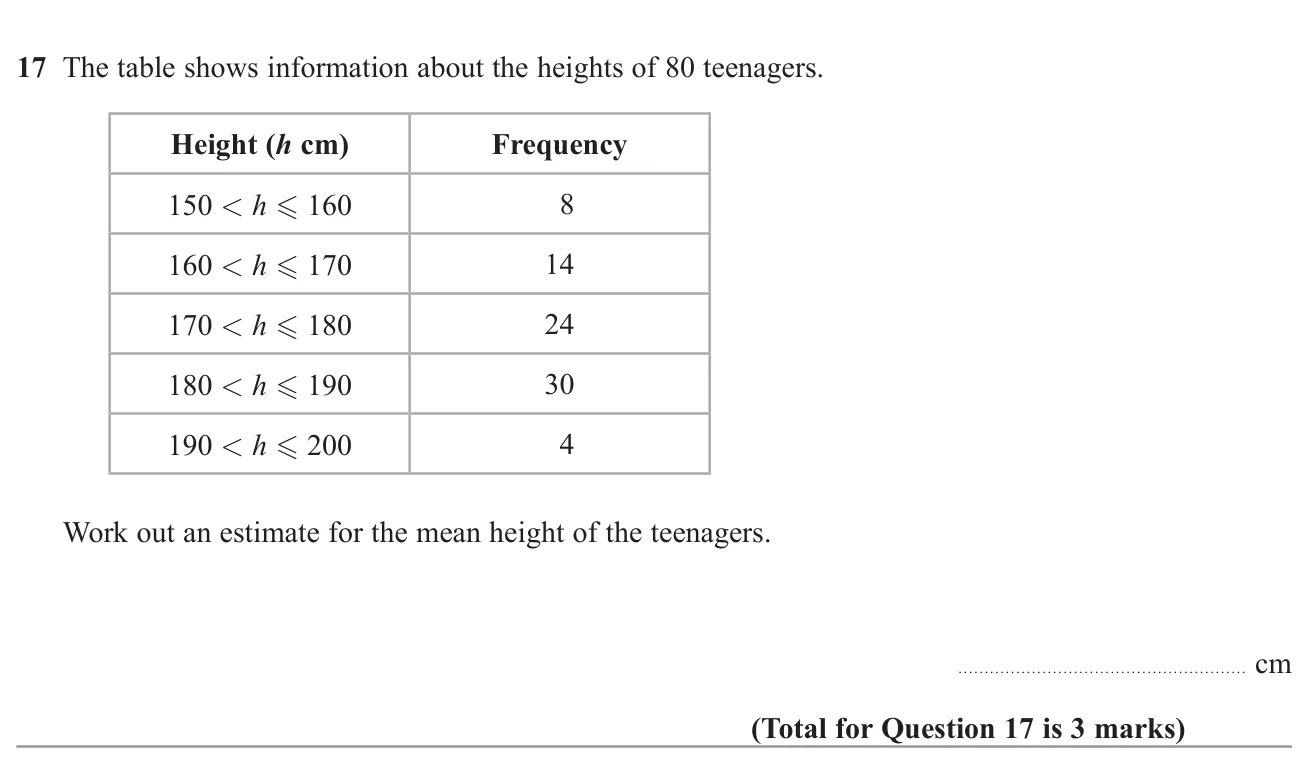
Midpoints: 155, 165, 175, 185, 195
155 × 8 + 165 × 14 + 175 × 24 + 185 × 30 + 195 × 4 = 14080 155\times8 + 165\times14 + 175\times24 + 185\times30 + 195\times4 = 14080 155 × 8 + 165 × 14 + 175 × 24 + 185 × 30 + 195 × 4 = 14080
14080 ÷ 80 = 176 14080 \div 80 = 176 14080 ÷ 80 = 176
Watch out: Dividing by 5 (the number of groups) instead of 80.
© Pearson Education Ltd. November 2021 Paper 2 (Foundation, calculator), question 18.
Worked solution Checked against the mark scheme
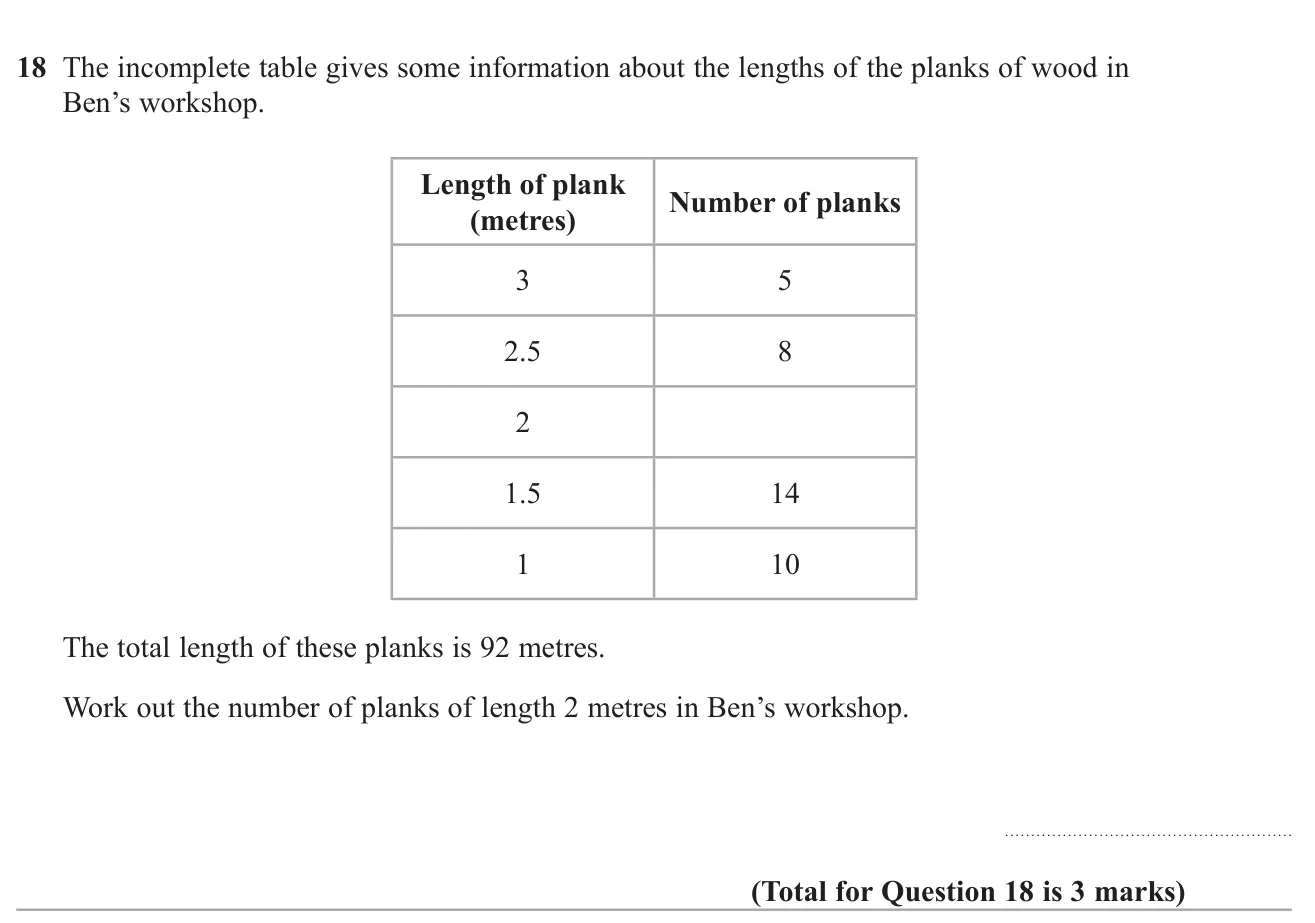
Known lengths: 3 × 5 + 2.5 × 8 + 1.5 × 14 + 1 × 10 = 15 + 20 + 21 + 10 = 66 3\times5 + 2.5\times8 + 1.5\times14 + 1\times10 = 15 + 20 + 21 + 10 = 66 3 × 5 + 2.5 × 8 + 1.5 × 14 + 1 × 10 = 15 + 20 + 21 + 10 = 66
Left for 2 m planks: 92 − 66 = 26 92 - 66 = 26 92 − 66 = 26
Number of planks: 26 ÷ 2 = 13 26 \div 2 = 13 26 ÷ 2 = 13
Watch out: Adding the numbers of planks instead of multiplying by the lengths.
© Pearson Education Ltd. November 2020 Paper 1 (Foundation, non-calculator), question 26.
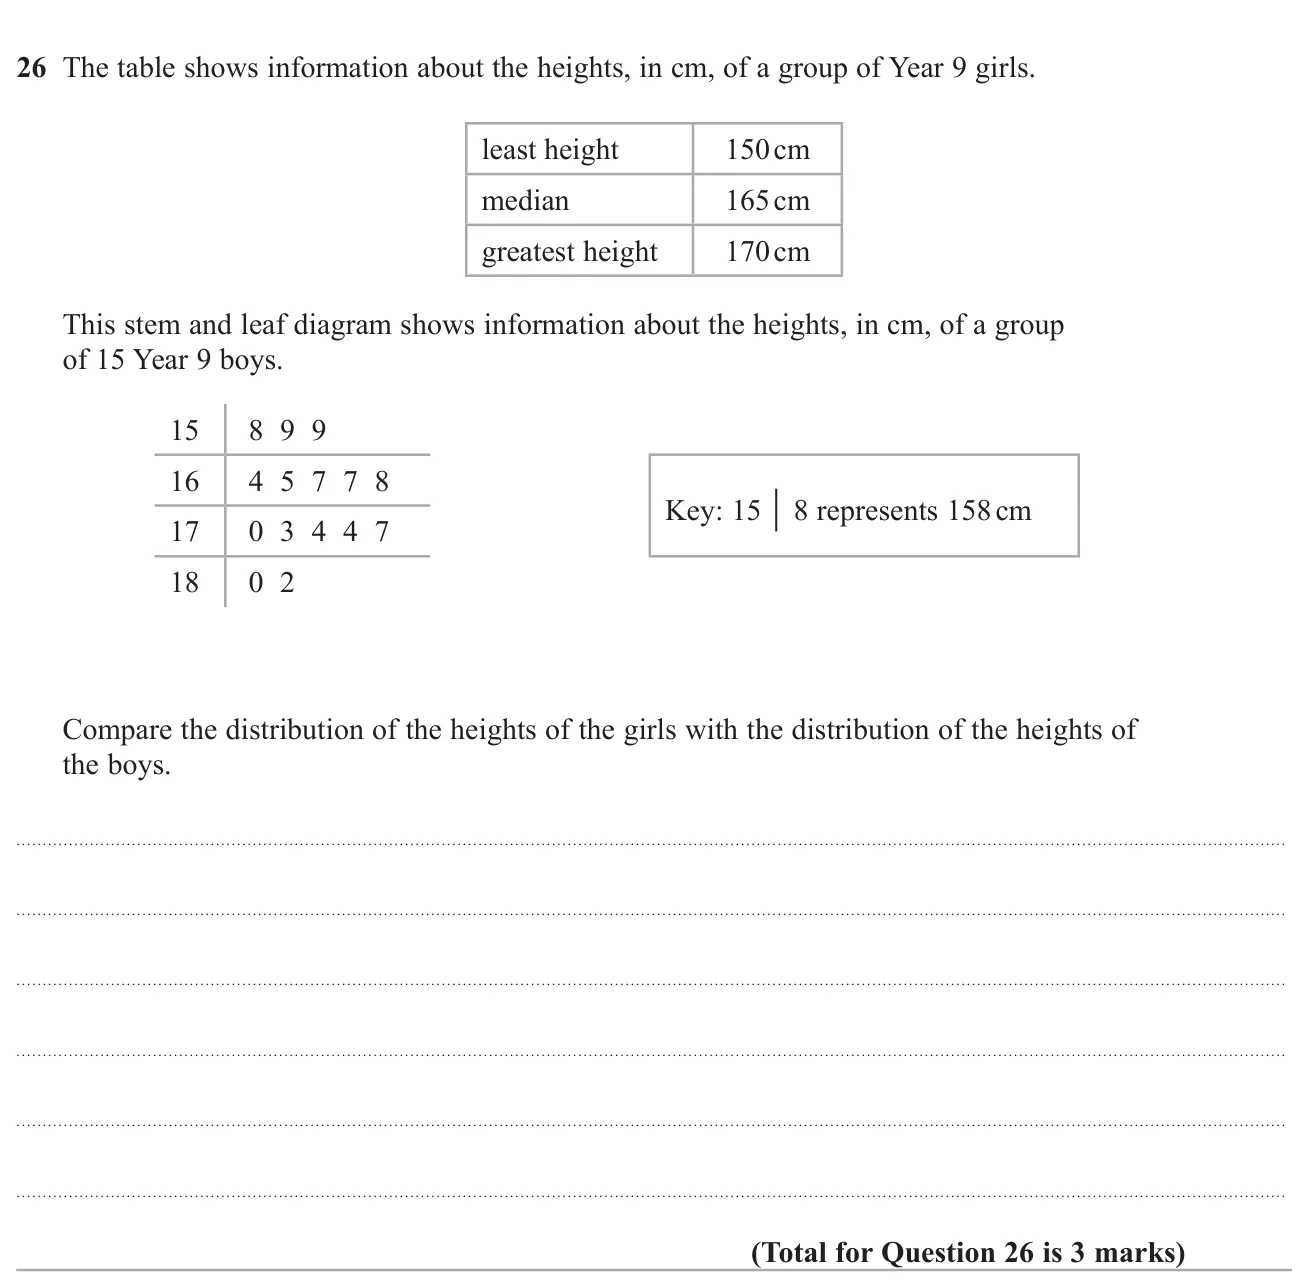
Answer Boys' median (168 cm) is higher than girls' (165 cm); boys' range (24 cm) is larger than girls' (20 cm) 3 marks
Worked solution Checked against the mark scheme
Girls: median 165 cm, range 170 − 150 = 20 170 - 150 = 20 170 − 150 = 20
Boys: 15 values, so the median is the 8th: 168 cm. Range 182 − 158 = 24 182 - 158 = 24 182 − 158 = 24
On average the boys are taller (168 > 165), and their heights are more spread out (24 > 20).
Watch out: Quoting the figures without actually comparing them.
© Pearson Education Ltd. November 2020 Paper 3 (Foundation, calculator), question 20.
Worked solution Checked against the mark scheme
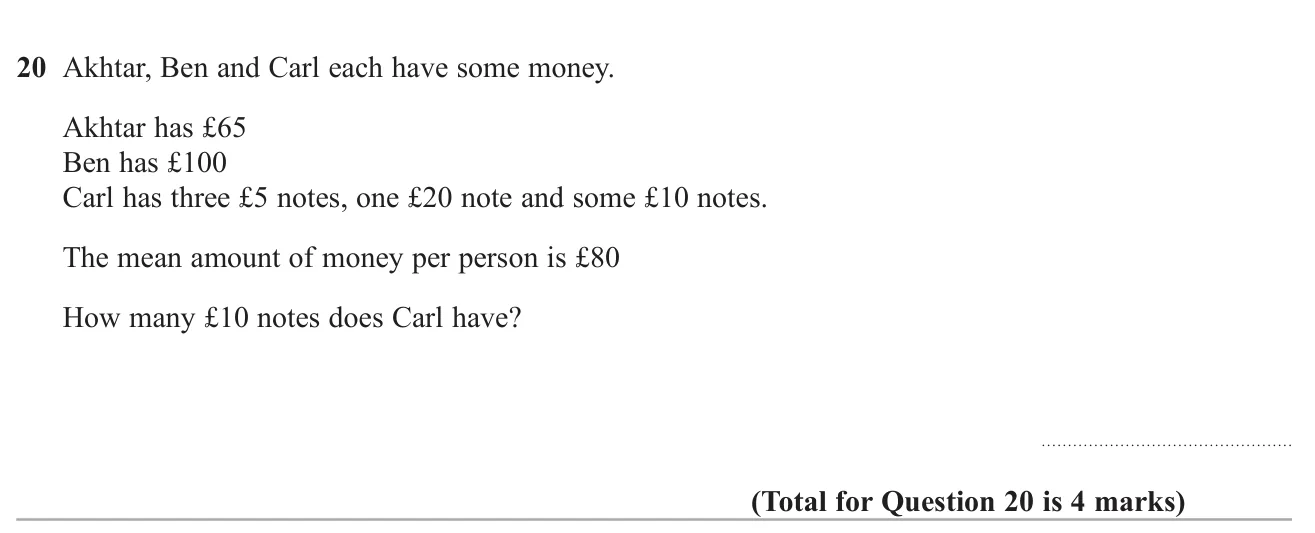
Total for all three: 3 × 80 = £ 240 3 \times 80 = £240 3 × 80 = £240
Carl has 240 − 65 − 100 = £ 75 240 - 65 - 100 = £75 240 − 65 − 100 = £75
Known notes: 3 × 5 + 20 = £ 35 3 \times 5 + 20 = £35 3 × 5 + 20 = £35
75 − 35 = £ 40 75 - 35 = £40 75 − 35 = £40 40 ÷ 10 = 4 40 \div 10 = 4 40 ÷ 10 = 4
Watch out: Doing 80 − 35 = 45 using the mean as Carl's amount.
© Pearson Education Ltd. June 2019 Paper 3 (Foundation, calculator), question 26.
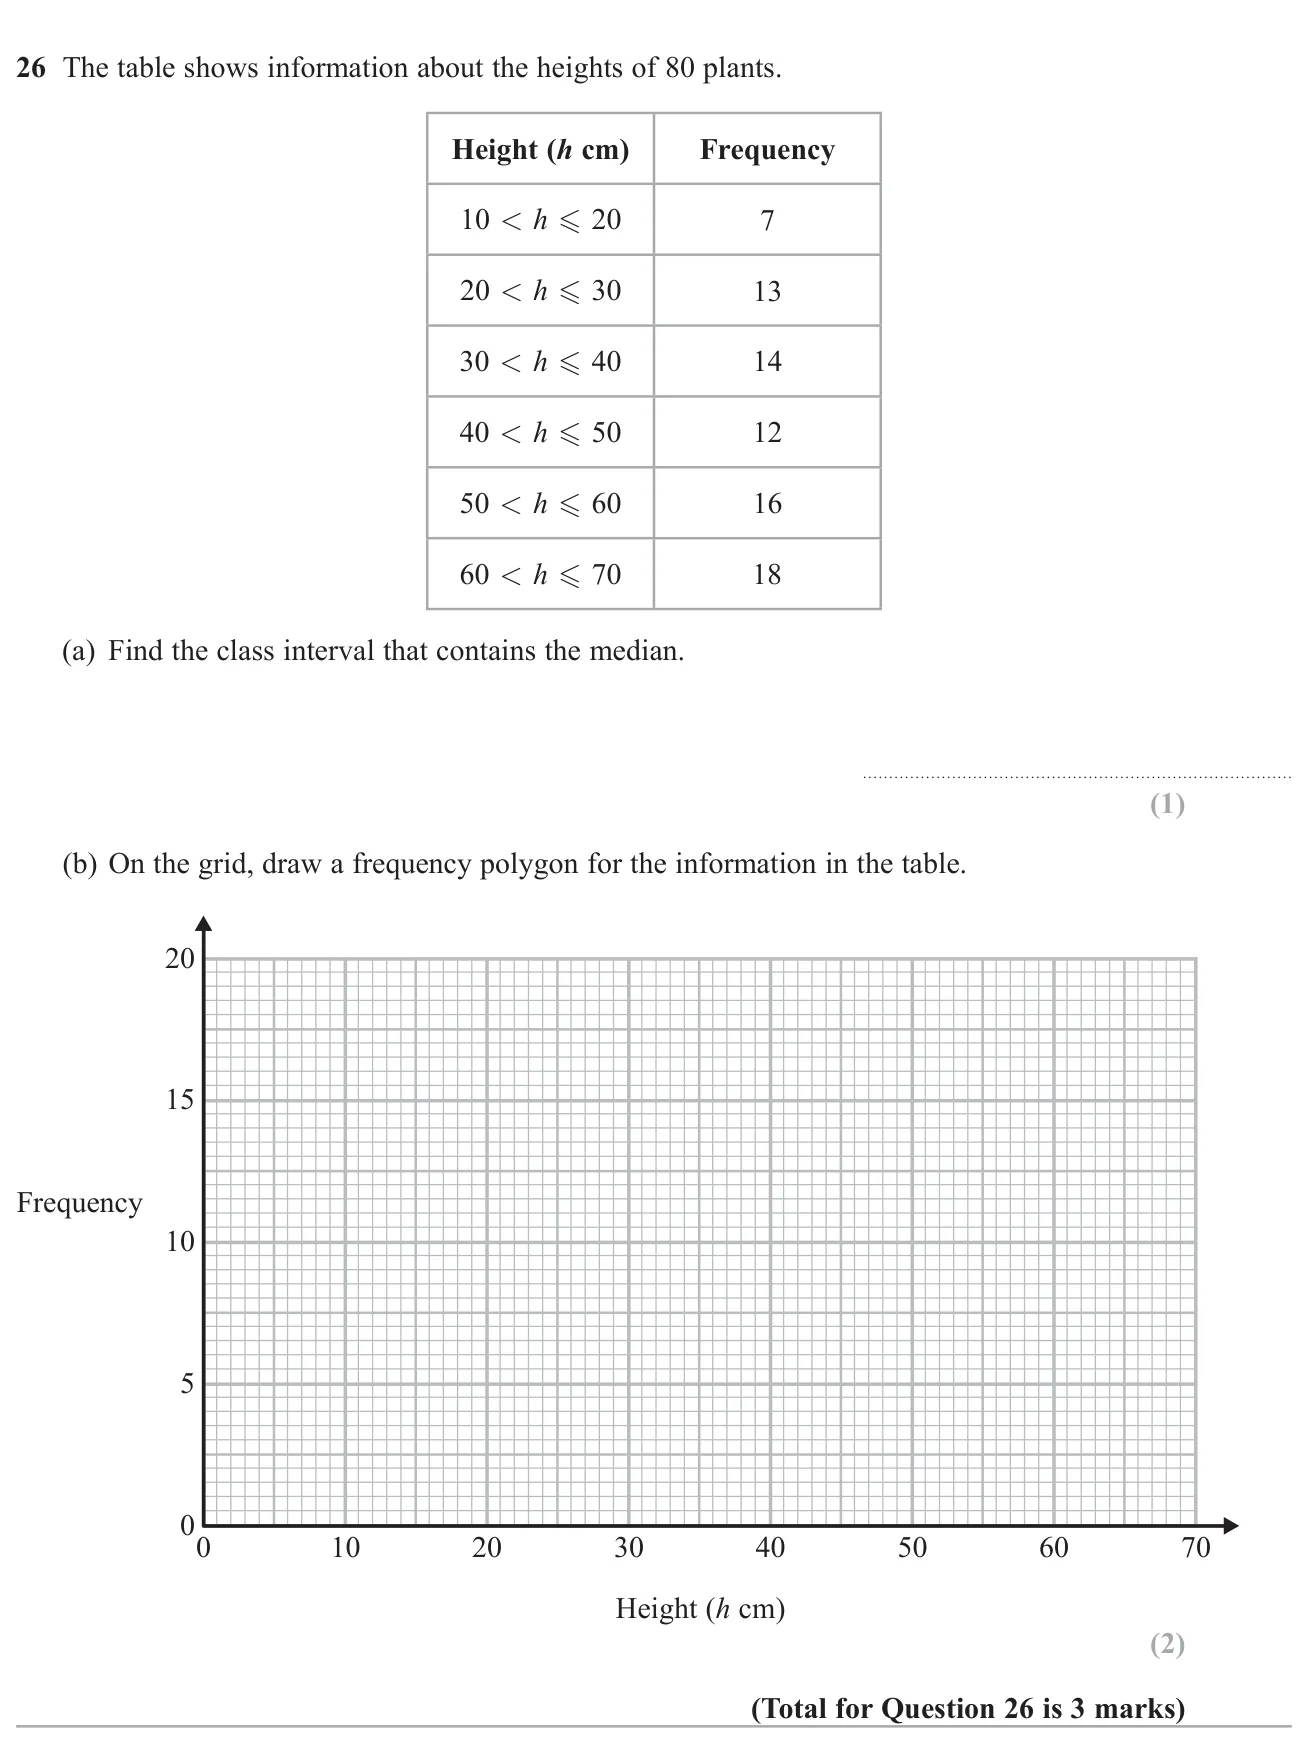
(a) 40 < h ≤ 50 40 < h \le 50 40 < h ≤ 50 1 mark (b) Points at (15, 7), (25, 13), (35, 14), (45, 12), (55, 16), (65, 18) joined with straight lines 2 marks
Worked solution Checked against the mark scheme
(a) 80 plants, so the median is about the 40th–41st value.
Running totals: 7, 20, 34, 46, ... The 40th value is in 40 < h ≤ 50 40 < h \le 50 40 < h ≤ 50
(b) Plot each frequency at the middle of its class: (15, 7), (25, 13), (35, 14), (45, 12), (55, 16), (65, 18). Join with straight lines.
Watch out: In (b), plotting at the class ends (10, 20, ...) instead of the midpoints.
© Pearson Education Ltd. June 2018 Paper 2 (Foundation, calculator), question 16.
Worked solution Checked against the mark scheme
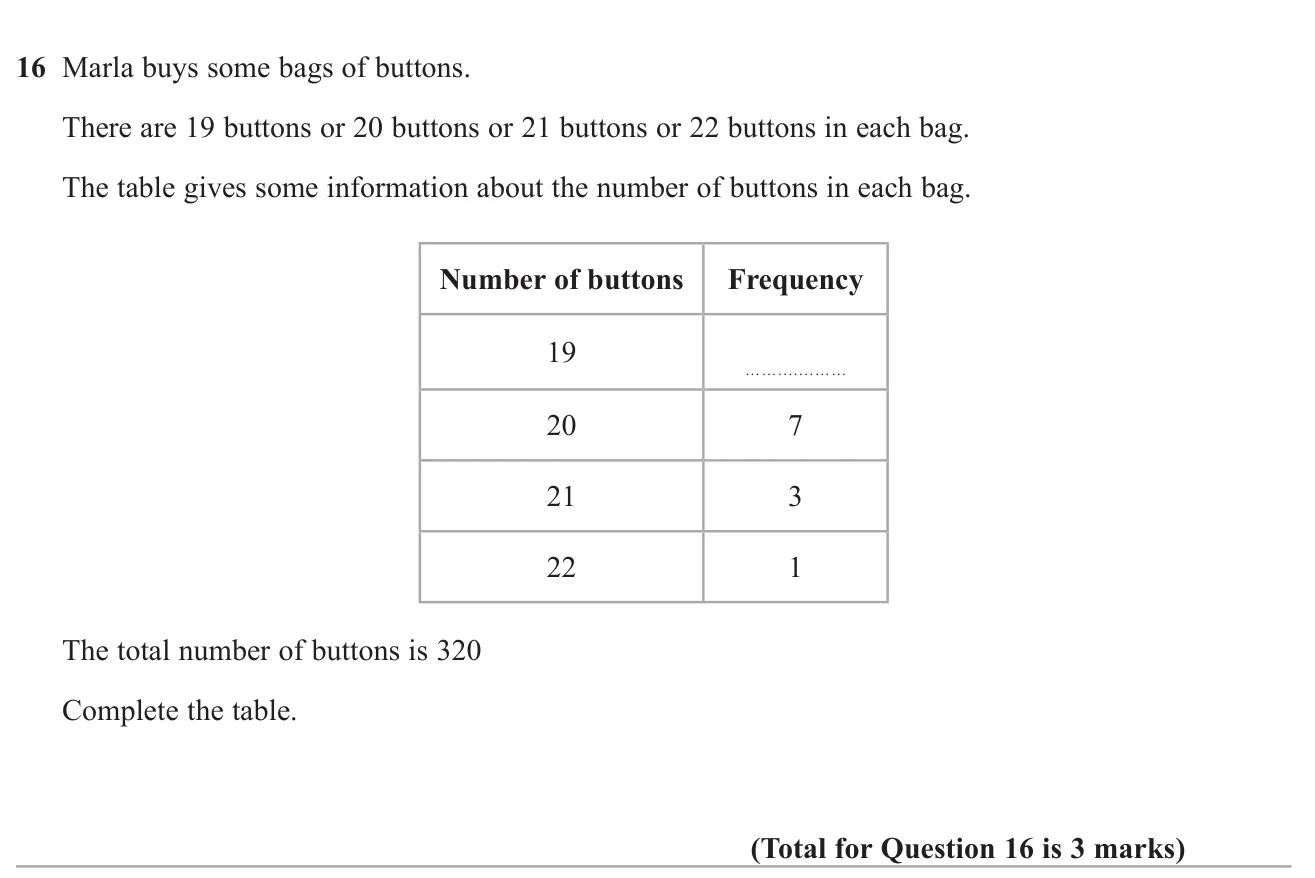
Buttons already accounted for: 20 × 7 + 21 × 3 + 22 × 1 = 140 + 63 + 22 = 225 20 \times 7 + 21 \times 3 + 22 \times 1 = 140 + 63 + 22 = 225 20 × 7 + 21 × 3 + 22 × 1 = 140 + 63 + 22 = 225
Buttons left: 320 − 225 = 95 320 - 225 = 95 320 − 225 = 95
Bags of 19: 95 ÷ 19 = 5 95 \div 19 = 5 95 ÷ 19 = 5
Watch out: Adding the frequencies instead of the buttons.
© Pearson Education Ltd. November 2018 Paper 3 (Foundation, calculator), question 23.
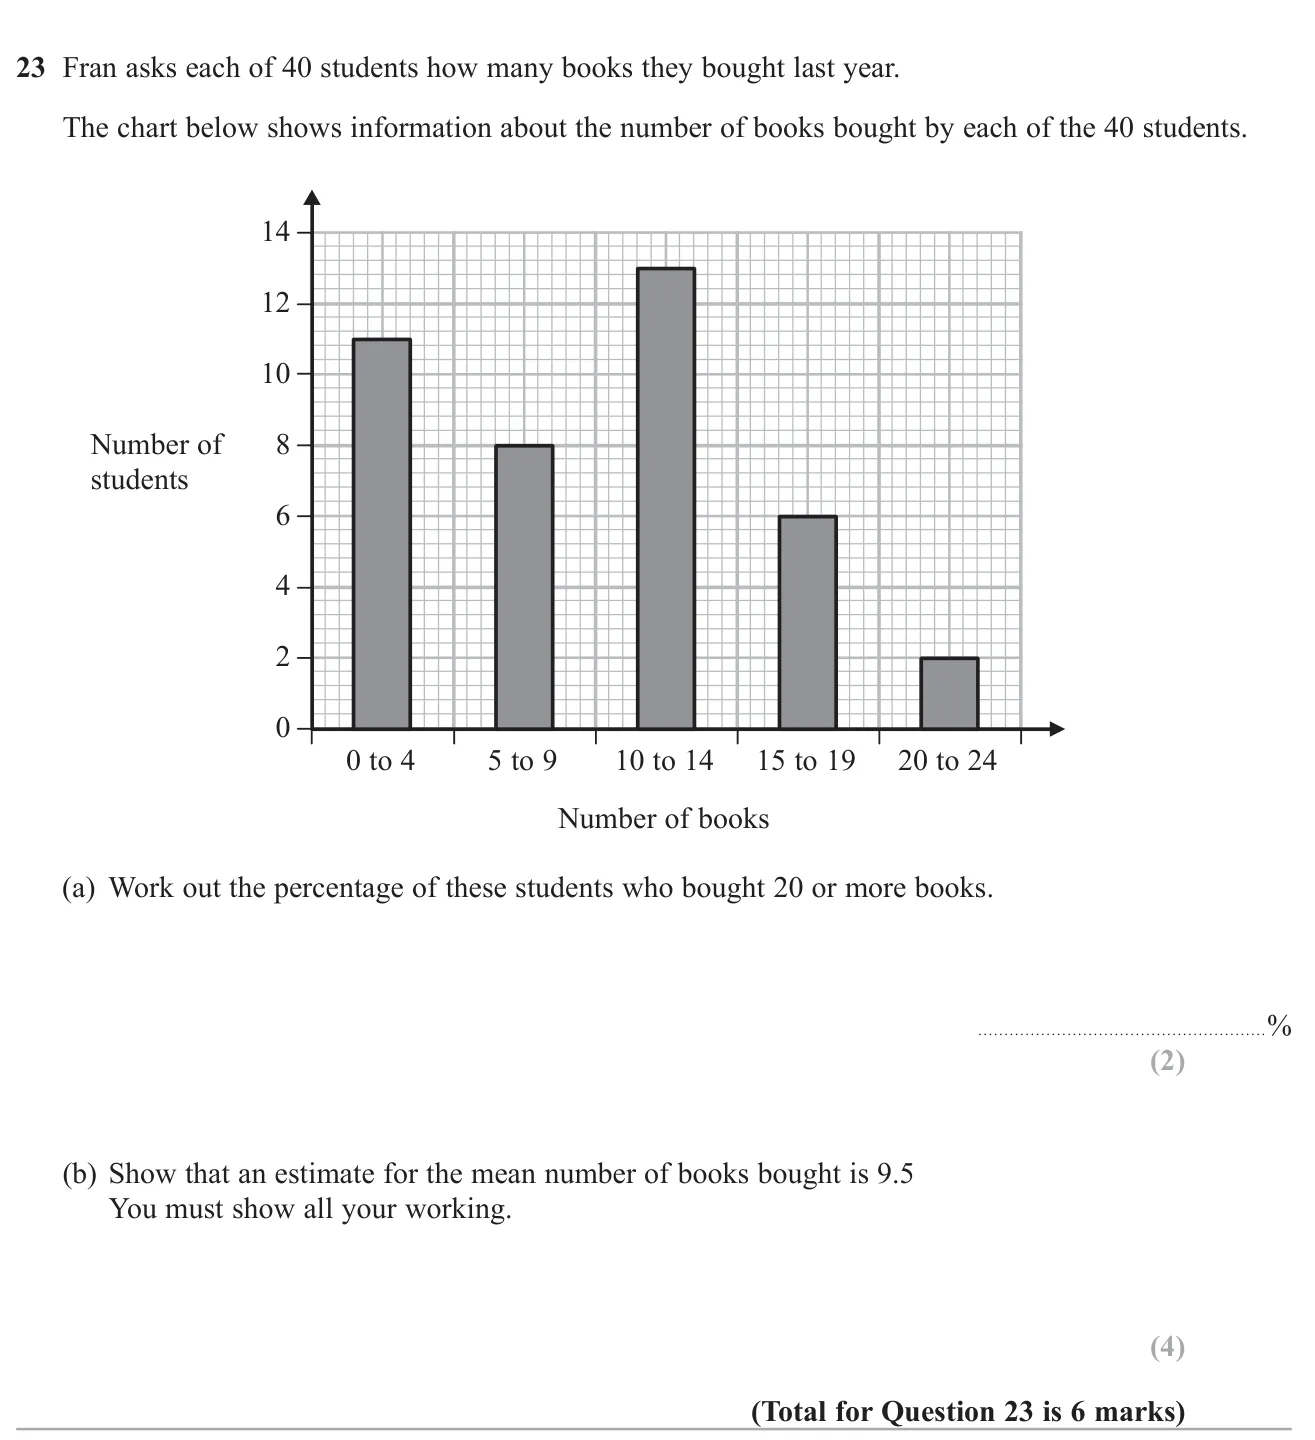
(a) 5 % 5\% 5% 2 marks (b) 380 ÷ 40 = 9.5 380 \div 40 = 9.5 380 ÷ 40 = 9.5 4 marks
Worked solution Checked against the mark scheme
(a) 2 students bought 20 to 24 books: 2 40 × 100 = 5 % \frac{2}{40} \times 100 = 5\% 40 2 × 100 = 5%
(b) Frequencies 11, 8, 13, 6, 2 and midpoints 2, 7, 12, 17, 22
11 × 2 + 8 × 7 + 13 × 12 + 6 × 17 + 2 × 22 = 22 + 56 + 156 + 102 + 44 = 380 11 \times 2 + 8 \times 7 + 13 \times 12 + 6 \times 17 + 2 \times 22 = 22 + 56 + 156 + 102 + 44 = 380 11 × 2 + 8 × 7 + 13 × 12 + 6 × 17 + 2 × 22 = 22 + 56 + 156 + 102 + 44 = 380
Mean ≈ 380 ÷ 40 = 9.5 \approx 380 \div 40 = 9.5 ≈ 380 ÷ 40 = 9.5
Watch out: Dividing the total by 5 (the number of groups) instead of 40.
© Pearson Education Ltd. Specimen Paper 2 (Foundation, calculator), question 22.
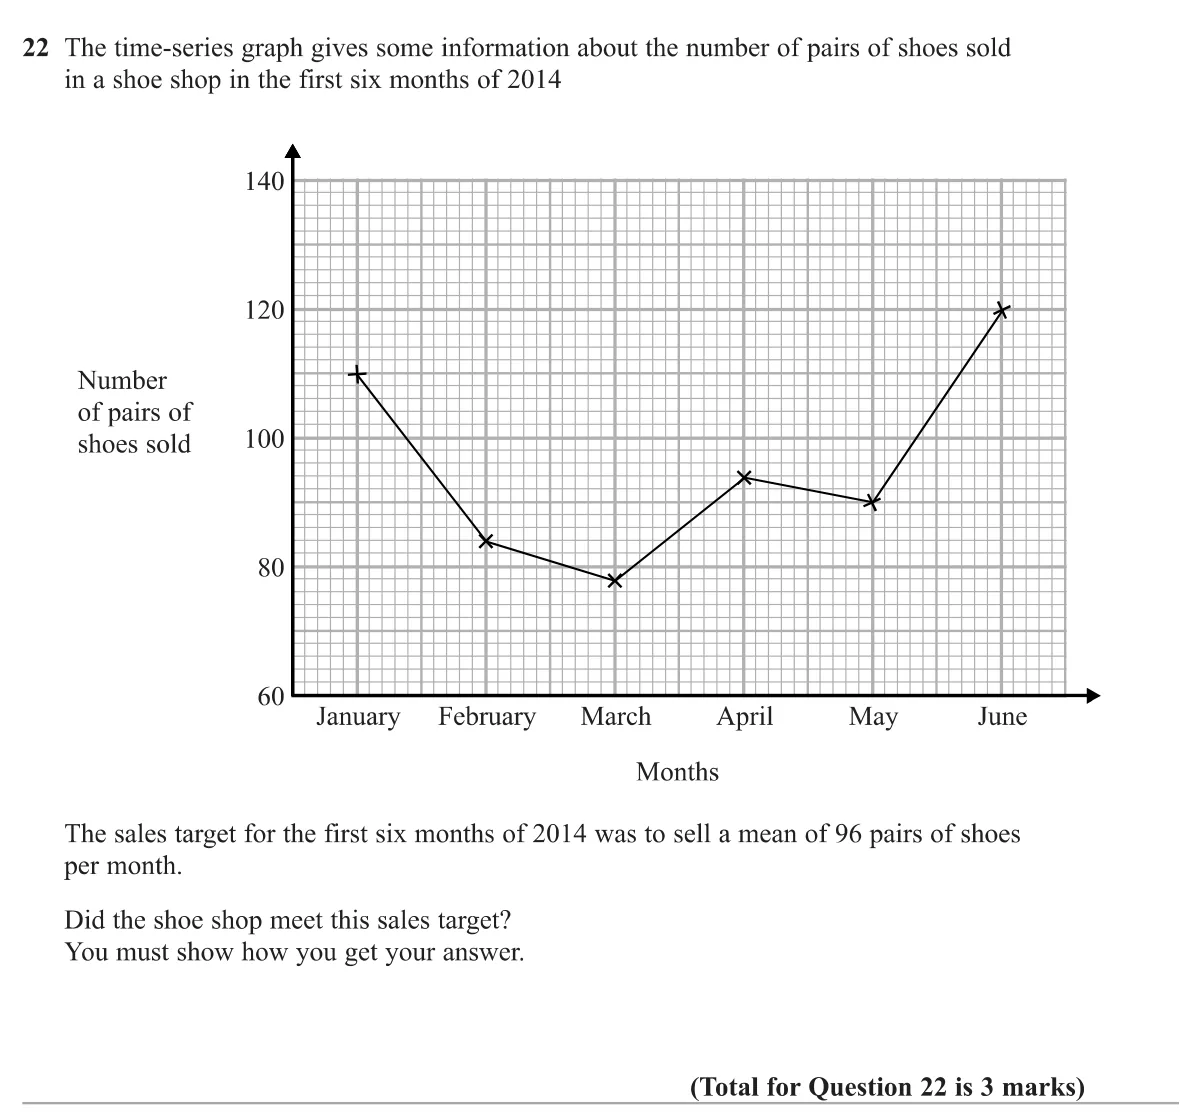
Answer Yes: the mean is 96, so the target was met 3 marks
Worked solution Checked against the mark scheme
Readings: 110, 84, 78, 94, 90, 120
Total = 576 = 576 = 576
Mean = 576 ÷ 6 = 96 = 576 \div 6 = 96 = 576 ÷ 6 = 96
The mean equals 96, so the target was met.
Watch out: Misreading the scale, where each small square is 2 pairs.
© Pearson Education Ltd. Specimen Paper 2 (Higher, calculator), question 3.
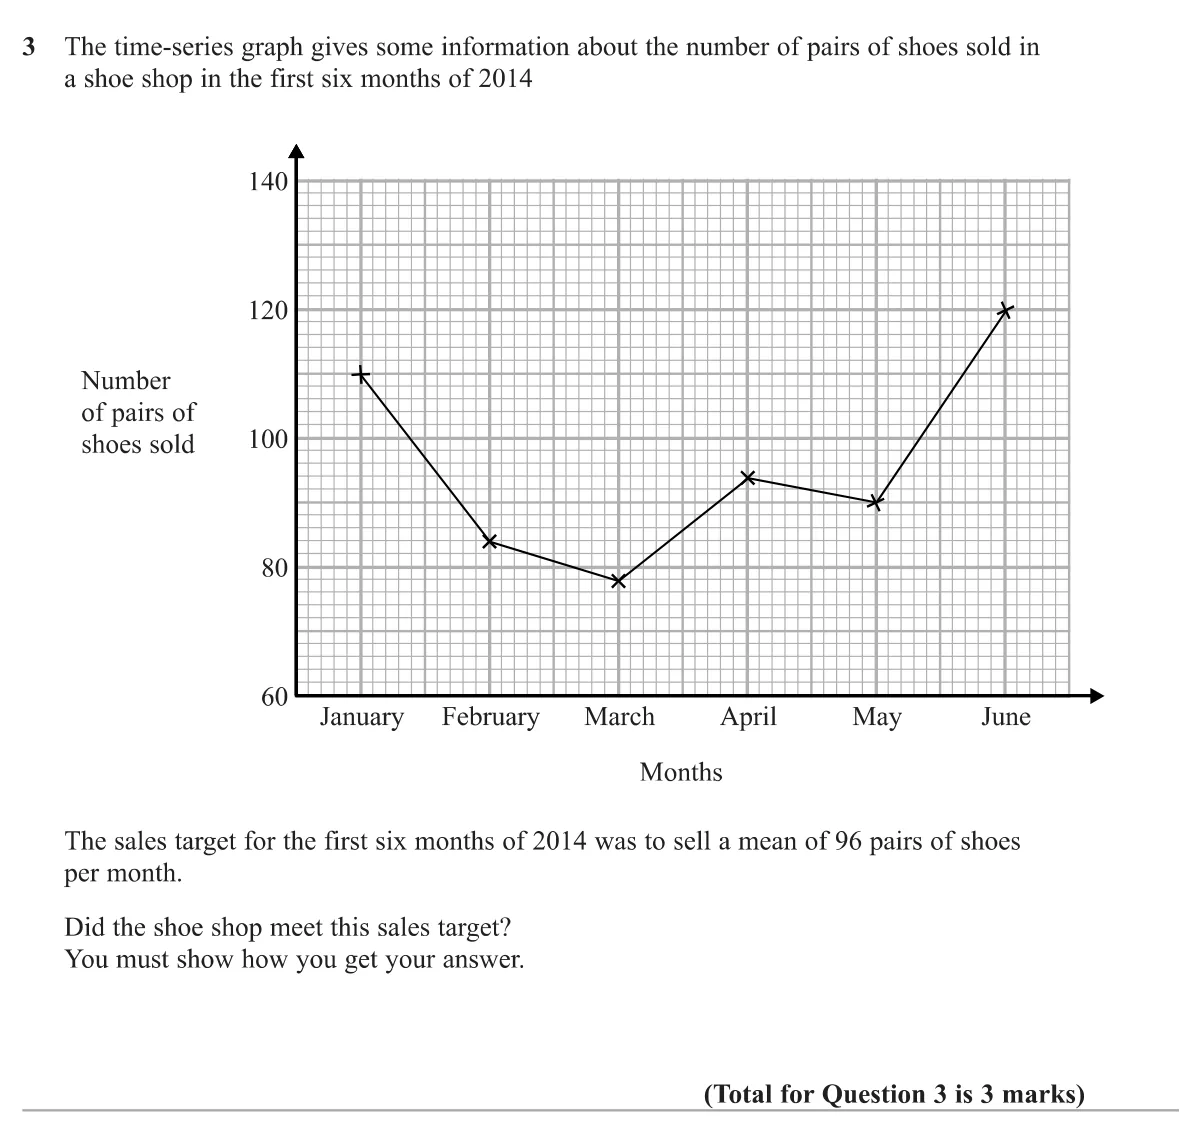
Answer Yes: the mean is 96, so the target was met 3 marks
Worked solution Checked against the mark scheme
Readings: 110, 84, 78, 94, 90, 120
Total = 576 = 576 = 576
Mean = 576 ÷ 6 = 96 = 576 \div 6 = 96 = 576 ÷ 6 = 96
The mean equals the target, so yes , the target was met.
Watch out: Misreading the vertical scale, where each small square is 2 pairs of shoes.
© Pearson Education Ltd. June 2024 Paper 2 (Foundation, calculator), question 28.
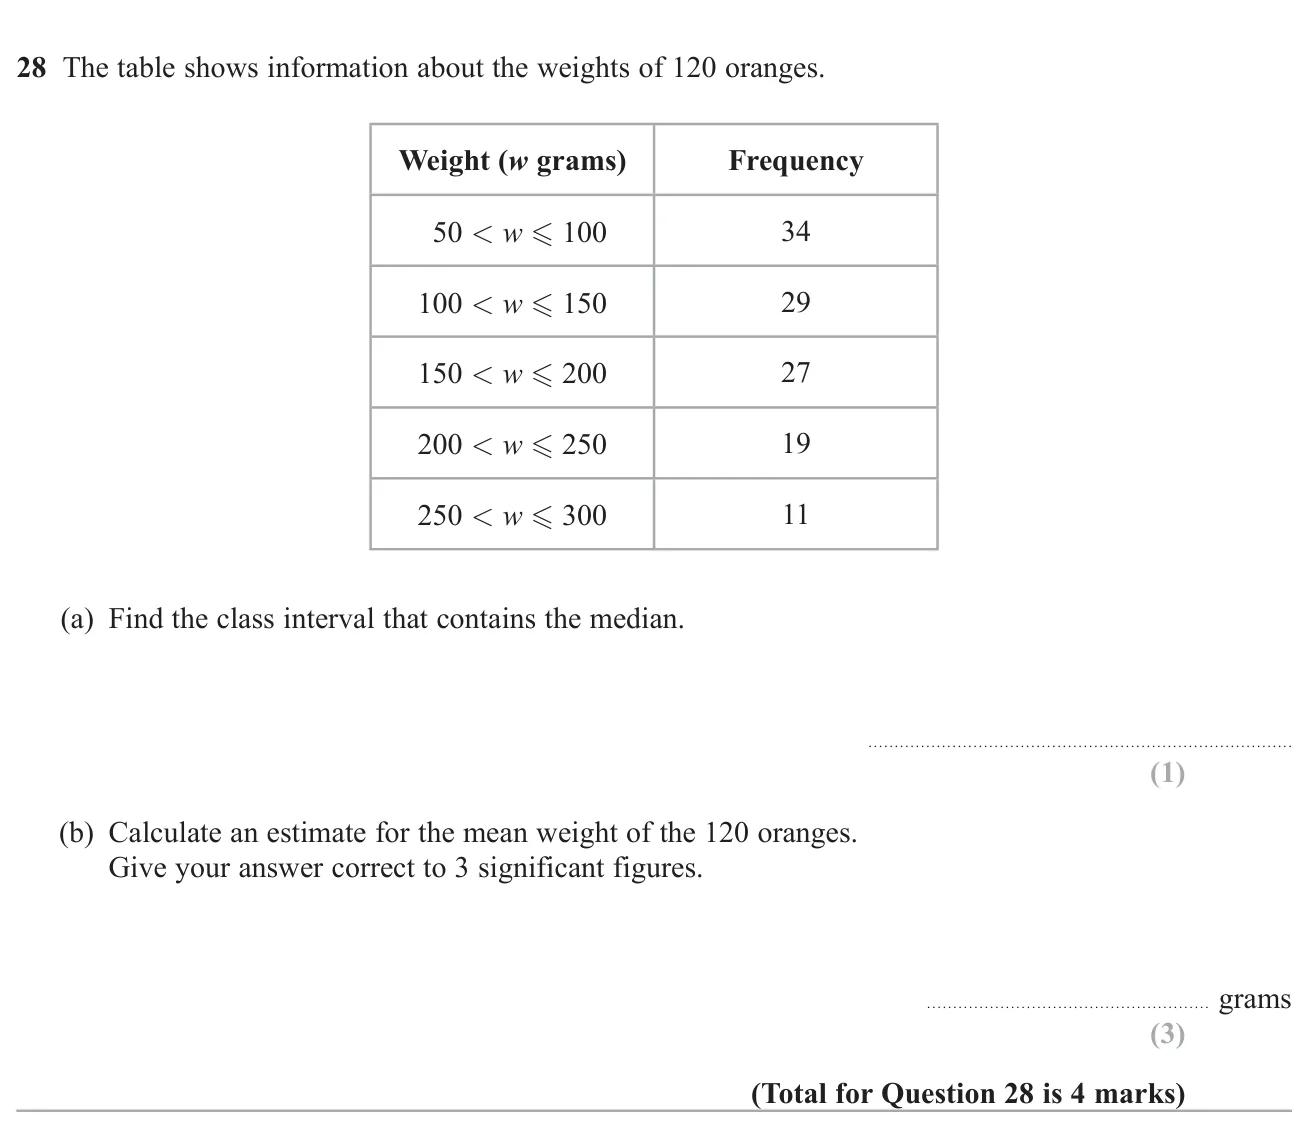
(a) 100 < w ≤ 150 100 < w \le 150 100 < w ≤ 150 1 mark (b) 152 152 152 3 marks
Worked solution Checked against the mark scheme
(a) The median is about the 60th/61st value. 34 < 60 ≤ 34 + 29 = 63 34 < 60 \le 34 + 29 = 63 34 < 60 ≤ 34 + 29 = 63 100 < w ≤ 150 100 < w \le 150 100 < w ≤ 150
(b) Midpoints: 75, 125, 175, 225, 275.
∑ f x = 2550 + 3625 + 4725 + 4275 + 3025 = 18200 \sum fx = 2550 + 3625 + 4725 + 4275 + 3025 = 18200 ∑ f x = 2550 + 3625 + 4725 + 4275 + 3025 = 18200
Mean ≈ 18200 ÷ 120 = 151.67 ≈ 152 \approx 18200 \div 120 = 151.67 \approx 152 ≈ 18200 ÷ 120 = 151.67 ≈ 152
Watch out: Dividing by 5 (number of classes) instead of 120.
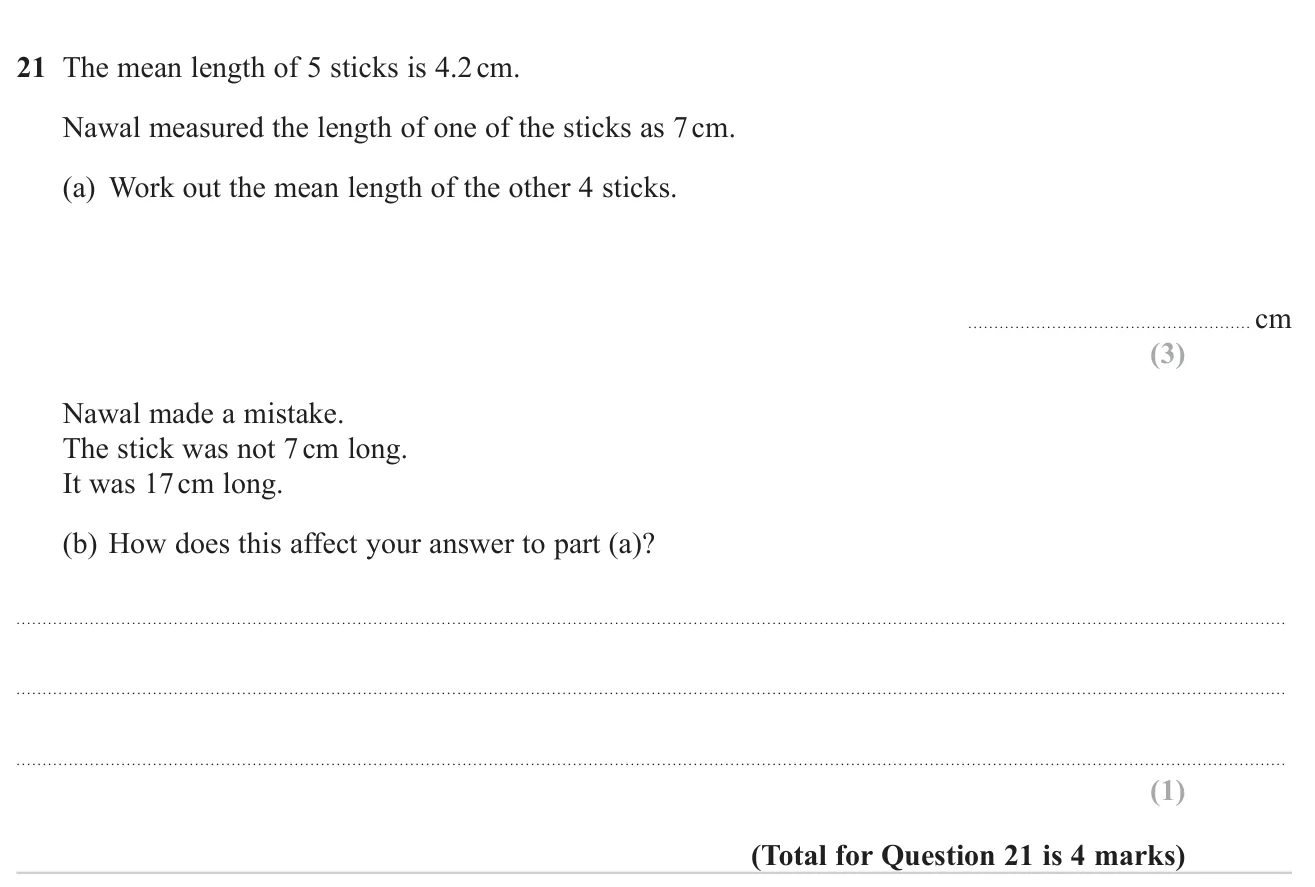
© Pearson Education Ltd. November 2023 Paper 1 (Foundation, non-calculator), question 21.
(a) 3.5 cm 3 marks (b) The mean of the other 4 sticks would be smaller (it becomes 1 cm) 1 mark
Worked solution Checked against the mark scheme
(a) Total length: 4.2 × 5 = 21 4.2 \times 5 = 21 4.2 × 5 = 21
Other 4 sticks: 21 − 7 = 14 21 - 7 = 14 21 − 7 = 14 = 14 ÷ 4 = 3.5 = 14 \div 4 = 3.5 = 14 ÷ 4 = 3.5
(b) The other 4 sticks now total 21 − 17 = 4 21 - 17 = 4 21 − 17 = 4 4 ÷ 4 = 1 4 \div 4 = 1 4 ÷ 4 = 1
Watch out: Saying the mean would increase because 17 is bigger than 7.
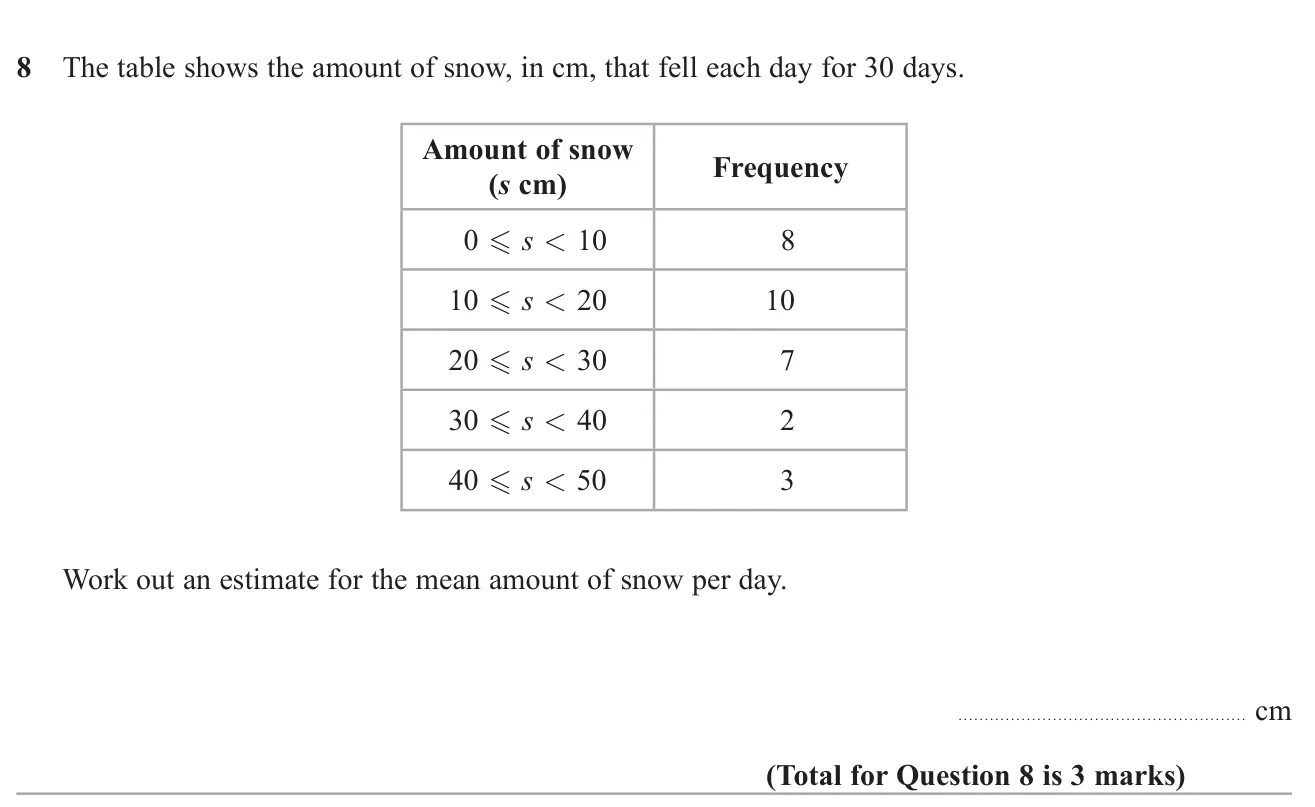
© Pearson Education Ltd. June 2022 Paper 1 (Higher, non-calculator), question 8.
Worked solution Checked against the mark scheme
Midpoints: 5, 15, 25, 35, 45
∑ f x = 40 + 150 + 175 + 70 + 135 = 570 \sum fx = 40 + 150 + 175 + 70 + 135 = 570 ∑ f x = 40 + 150 + 175 + 70 + 135 = 570
Mean ≈ 570 ÷ 30 = 19 \approx 570 \div 30 = 19 ≈ 570 ÷ 30 = 19
Watch out: Dividing by 5 (the number of classes) instead of the total frequency 30.
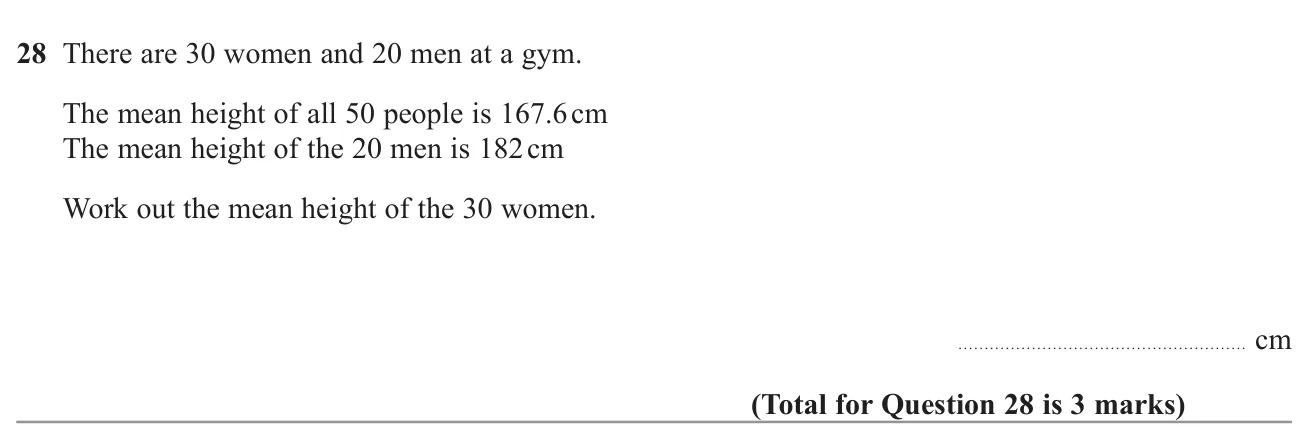
© Pearson Education Ltd. November 2022 Paper 3 (Foundation, calculator), question 28.
Worked solution Checked against the mark scheme
Total for everyone: 50 × 167.6 = 8380 50 \times 167.6 = 8380 50 × 167.6 = 8380
Total for men: 20 × 182 = 3640 20 \times 182 = 3640 20 × 182 = 3640
Women: ( 8380 − 3640 ) ÷ 30 = 4740 ÷ 30 = 158 (8380 - 3640) \div 30 = 4740 \div 30 = 158 ( 8380 − 3640 ) ÷ 30 = 4740 ÷ 30 = 158
Watch out: Averaging the two means, e.g. working out 2 × 167.6 − 182 2 \times 167.6 - 182 2 × 167.6 − 182
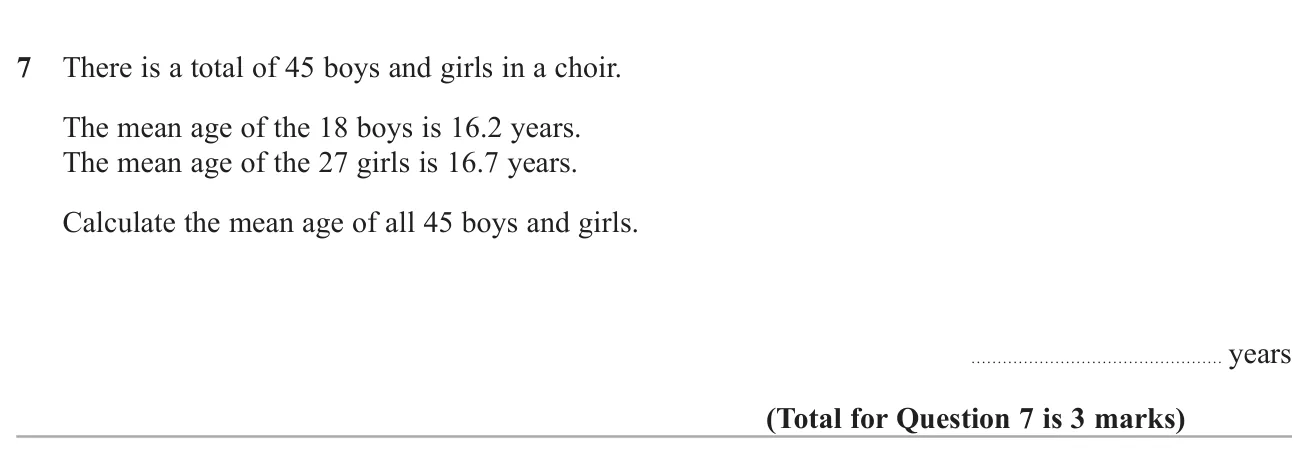
© Pearson Education Ltd. November 2020 Paper 3 (Higher, calculator), question 7.
Answer 16.5 16.5 16.5 3 marks
Worked solution Checked against the mark scheme
Boys' total = 18 × 16.2 = 291.6 = 18 \times 16.2 = 291.6 = 18 × 16.2 = 291.6
Girls' total = 27 × 16.7 = 450.9 = 27 \times 16.7 = 450.9 = 27 × 16.7 = 450.9
Mean = 291.6 + 450.9 45 = 742.5 45 = 16.5 = \frac{291.6 + 450.9}{45} = \frac{742.5}{45} = 16.5 = 45 291.6 + 450.9 = 45 742.5 = 16.5
Watch out: Averaging 16.2 and 16.7 to get 16.45.
© Pearson Education Ltd. November 2019 Paper 1 (Foundation, non-calculator), question 25.
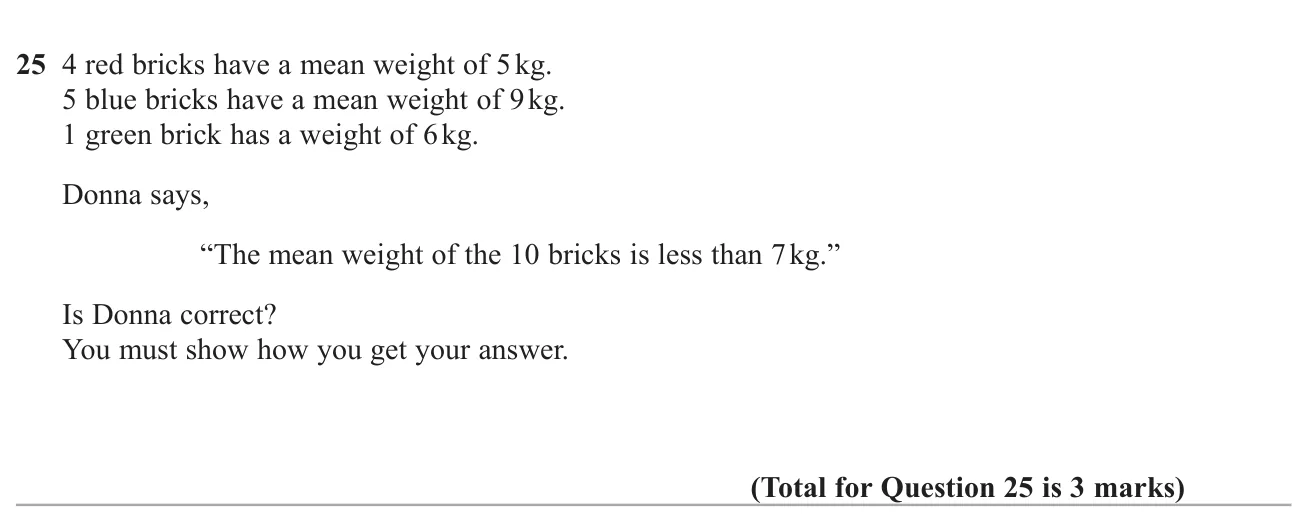
Answer No: the mean is 7.1 kg 3 marks
Worked solution Checked against the mark scheme
Red: 4 × 5 = 20 4 \times 5 = 20 4 × 5 = 20
Blue: 5 × 9 = 45 5 \times 9 = 45 5 × 9 = 45
Total = 20 + 45 + 6 = 71 = 20 + 45 + 6 = 71 = 20 + 45 + 6 = 71
Mean = 71 ÷ 10 = 7.1 = 71 \div 10 = 7.1 = 71 ÷ 10 = 7.1
7.1 > 7 7.1 > 7 7.1 > 7 not correct.
Watch out: Averaging the three means (5, 9 and 6) instead of using totals.
© Pearson Education Ltd. June 2019 Paper 1 (Higher, non-calculator), question 11.
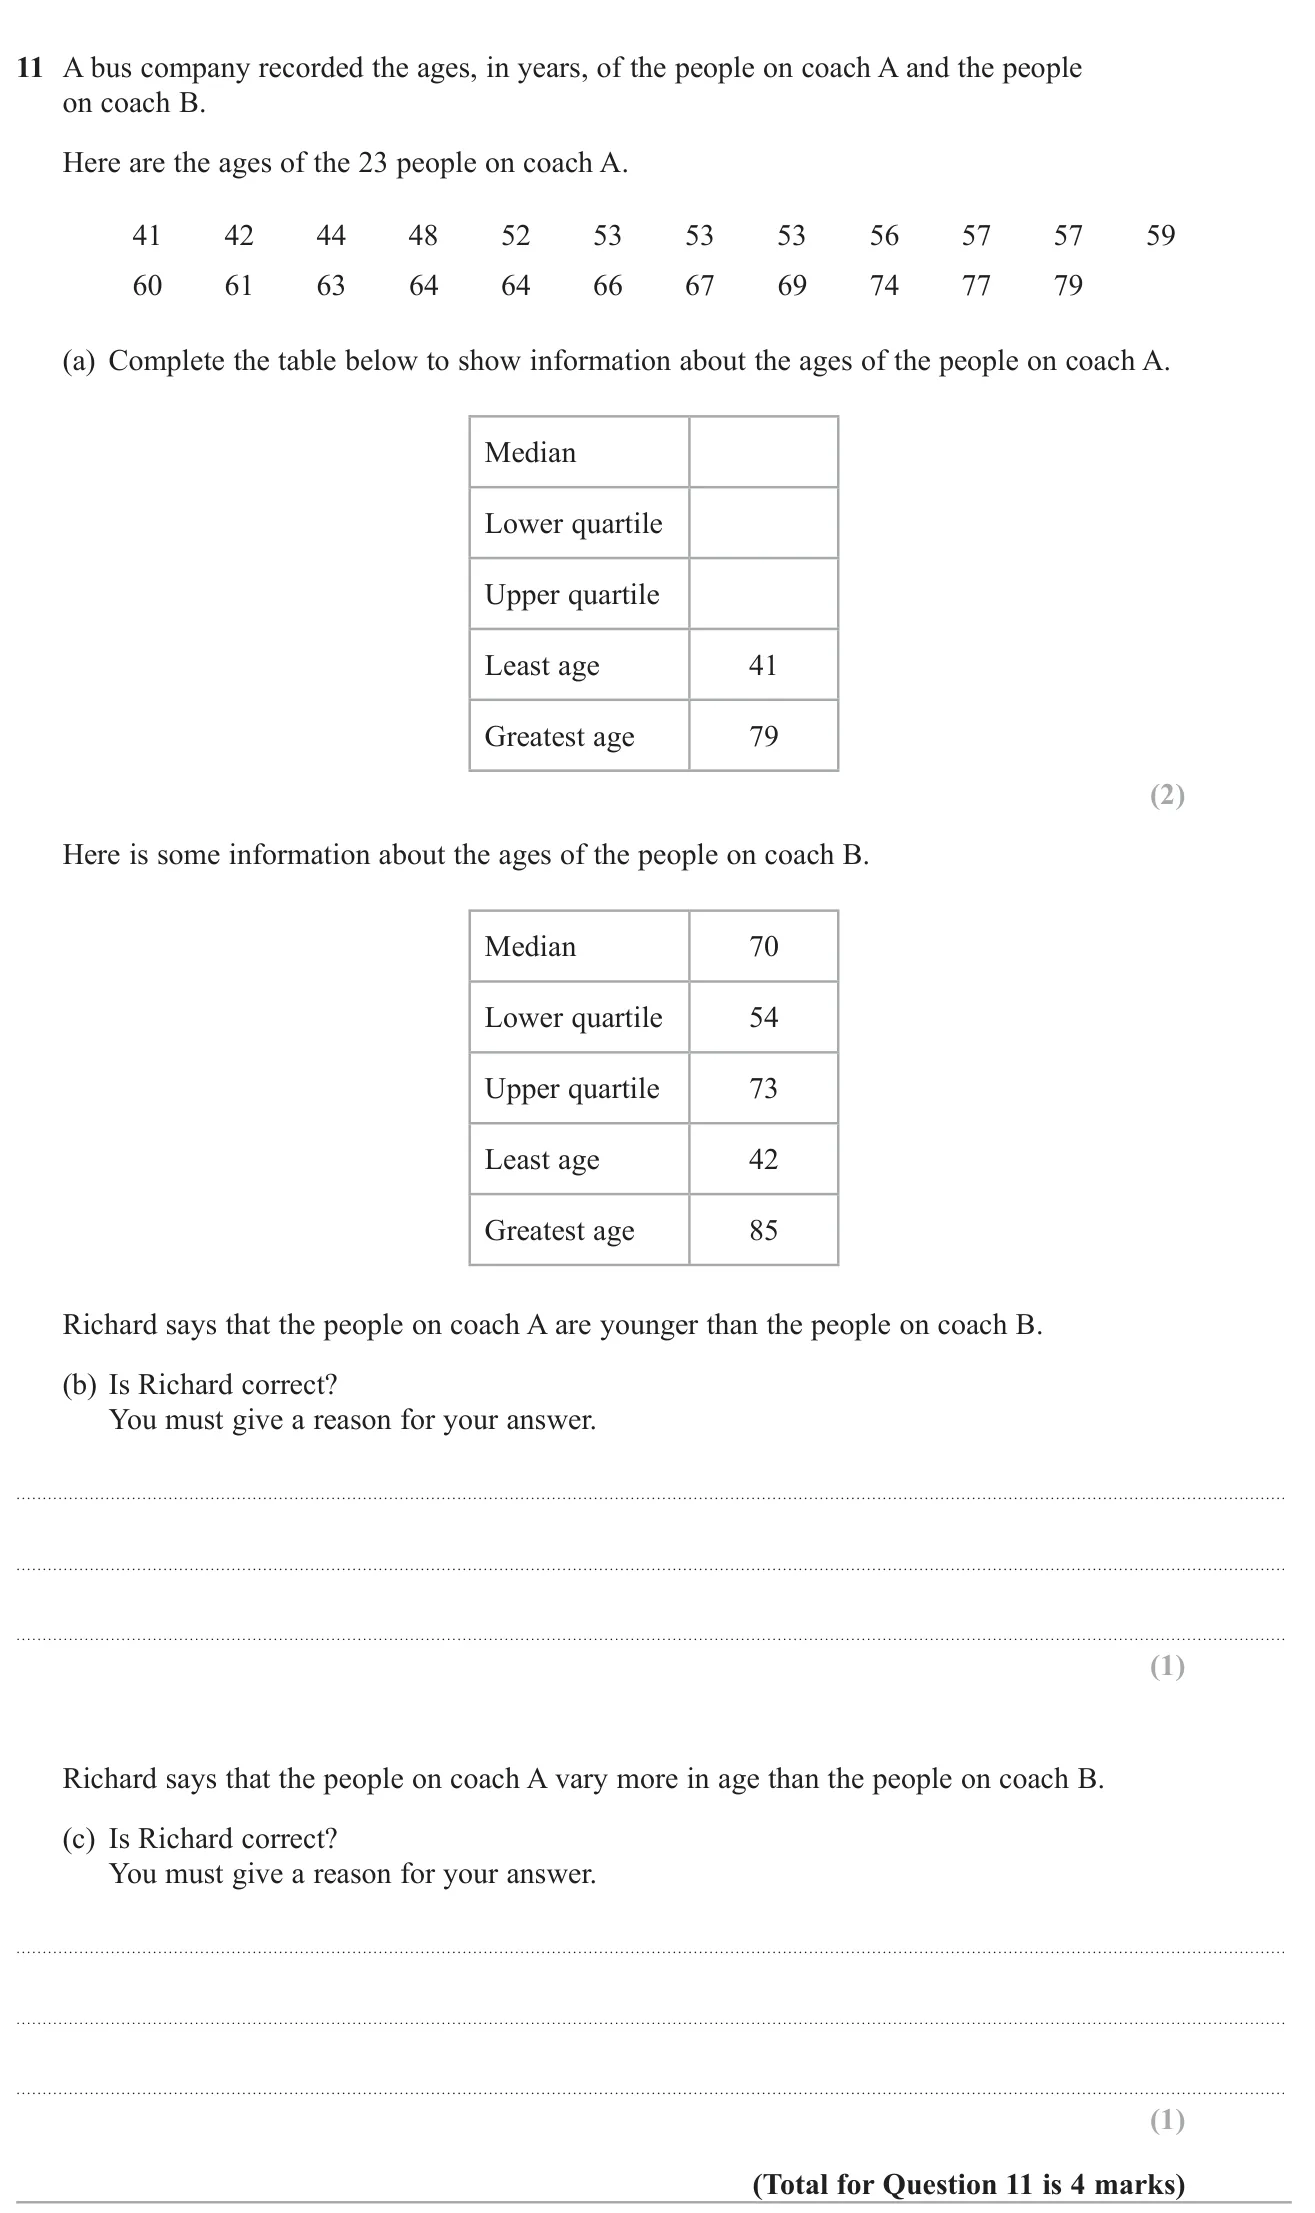
(a) Median 59 59 59 53 53 53 66 66 66 2 marks (b) Yes: the median for coach A (59) is lower than for coach B (70) 1 mark (c) No: coach A has a smaller range (38 < 43) and a smaller interquartile range (13 < 19) 1 mark
Worked solution Checked against the mark scheme
(a) There are 23 ages, so the median is the 12th value: 59.
The lower quartile is the 6th value: 53. The upper quartile is the 18th value: 66.
(b) Coach A's median, 59, is below coach B's, 70, so yes.
(c) Range: A is 79 − 41 = 38 79 - 41 = 38 79 − 41 = 38 85 − 42 = 43 85 - 42 = 43 85 − 42 = 43 66 − 53 = 13 66 - 53 = 13 66 − 53 = 13 73 − 54 = 19 73 - 54 = 19 73 − 54 = 19
Watch out: In (c), just quoting both ranges without saying which is bigger.
© Pearson Education Ltd. November 2019 Paper 3 (Foundation, calculator), question 25.
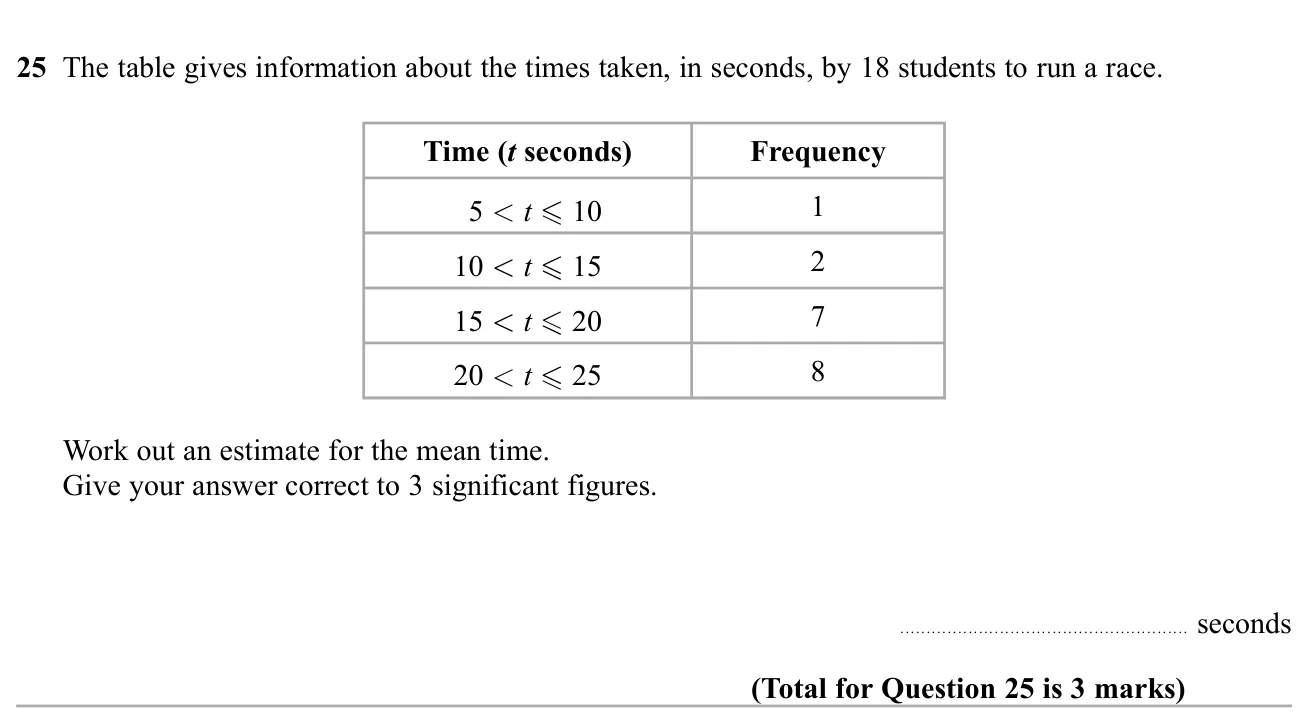
Answer 18.6 seconds 3 marks
Worked solution Checked against the mark scheme
Midpoints: 7.5, 12.5, 17.5, 22.5
∑ f x = 7.5 + 25 + 122.5 + 180 = 335 \sum fx = 7.5 + 25 + 122.5 + 180 = 335 ∑ f x = 7.5 + 25 + 122.5 + 180 = 335
Mean ≈ 335 ÷ 18 = 18.61... = 18.6 \approx 335 \div 18 = 18.61... = 18.6 ≈ 335 ÷ 18 = 18.61... = 18.6
Watch out: Dividing by 4 (the number of classes) instead of 18.
© Pearson Education Ltd. Specimen Paper 1 (Higher, non-calculator), question 9.
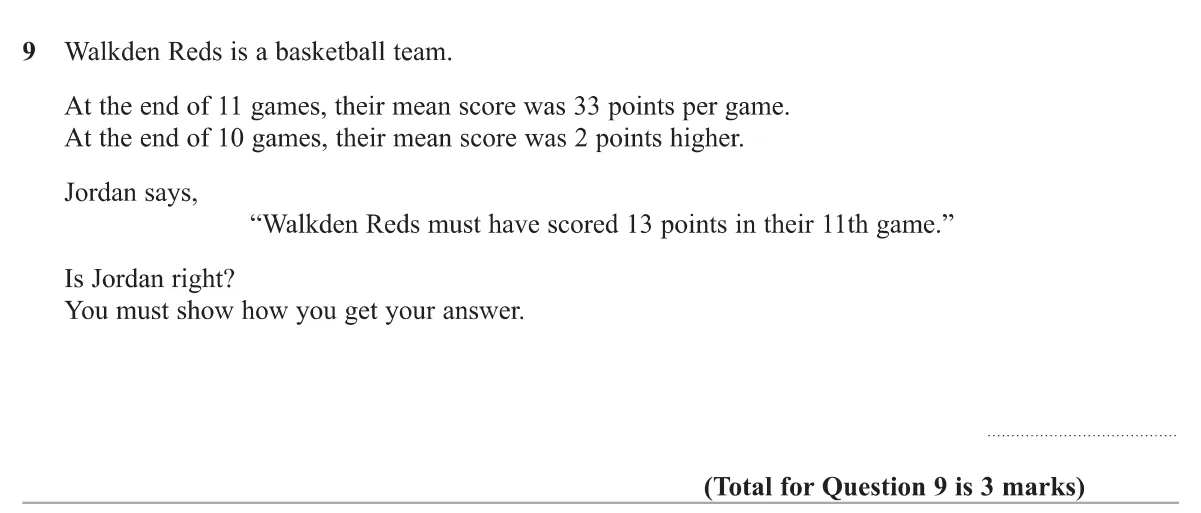
Answer Yes: 363 − 350 = 13 363 - 350 = 13 363 − 350 = 13 3 marks
Worked solution Checked against the mark scheme
Total after 11 games: 33 × 11 = 363 33 \times 11 = 363 33 × 11 = 363
Mean after 10 games was 35 35 35 35 × 10 = 350 35 \times 10 = 350 35 × 10 = 350
11th game: 363 − 350 = 13 363 - 350 = 13 363 − 350 = 13
Watch out: Taking the mean after 10 games as 31 (2 lower instead of 2 higher).
© Pearson Education Ltd. Specimen Paper 3 (Foundation, calculator), question 24.
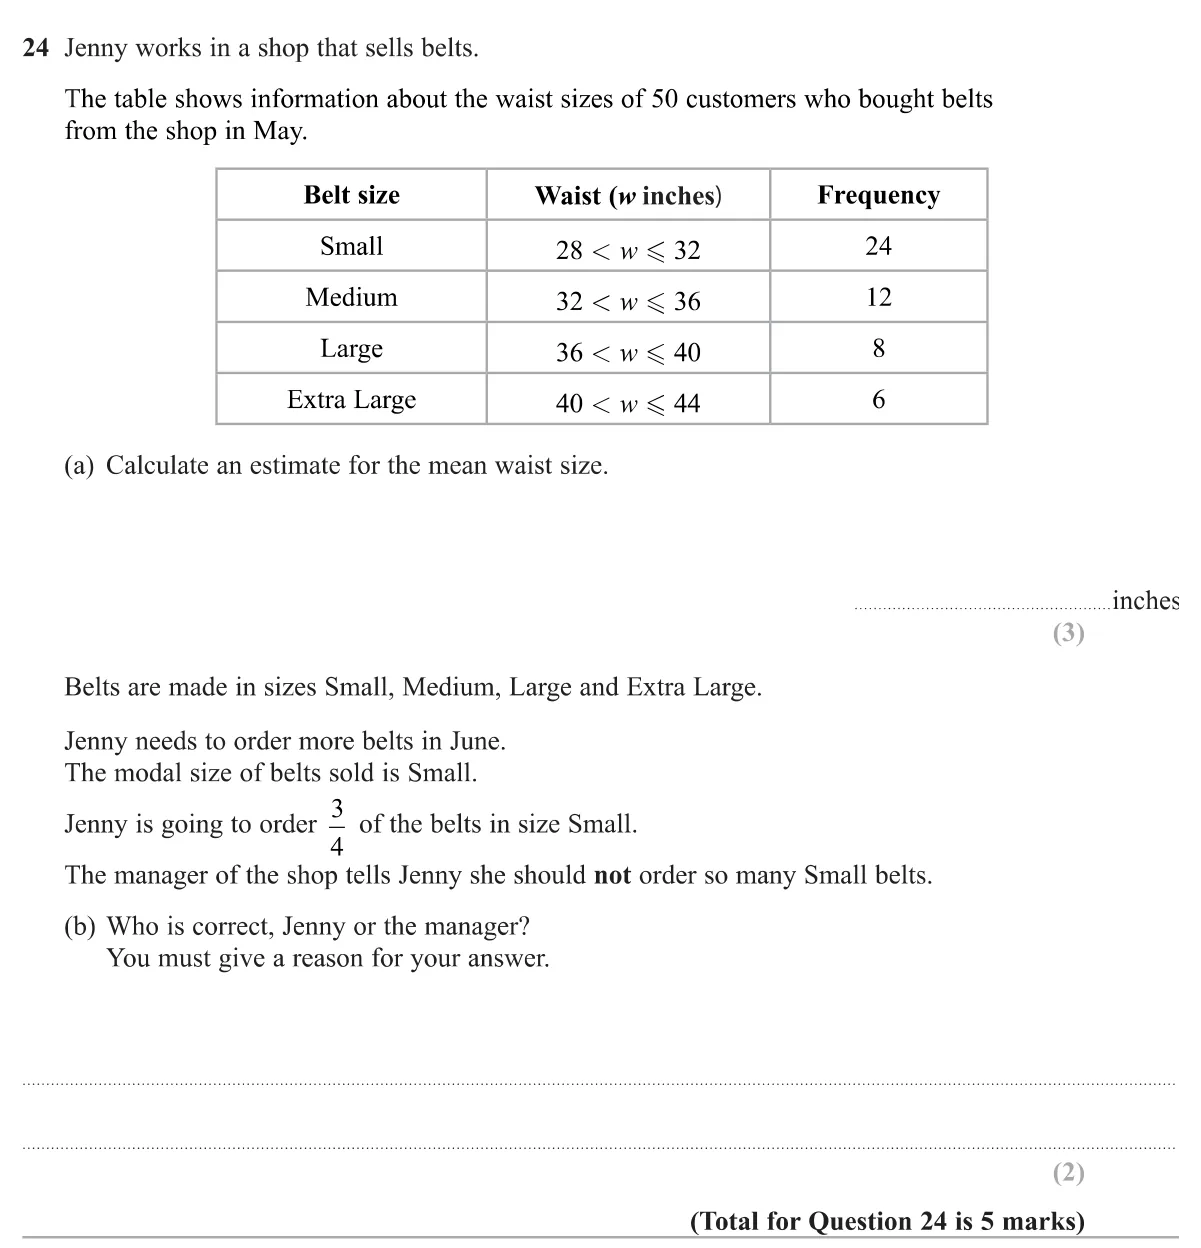
(a) 33.68 inches 3 marks (b) The manager: only 24 out of 50 (under half) bought Small, not three quarters 2 marks
Worked solution Checked against the mark scheme
(a) Midpoints: 30, 34, 38, 42.
30 × 24 + 34 × 12 + 38 × 8 + 42 × 6 = 720 + 408 + 304 + 252 = 1684 30 \times 24 + 34 \times 12 + 38 \times 8 + 42 \times 6 = 720 + 408 + 304 + 252 = 1684 30 × 24 + 34 × 12 + 38 × 8 + 42 × 6 = 720 + 408 + 304 + 252 = 1684
1684 ÷ 50 = 33.68 1684 \div 50 = 33.68 1684 ÷ 50 = 33.68
(b) 24 50 = 0.48 \frac{24}{50} = 0.48 50 24 = 0.48 manager is correct.
Watch out: In (a), dividing by 4 (the number of groups) instead of 50.
Also tested in these questions Their main topic is different, but part of each one tests this topic.
November 2024 · Paper 1 Higher · Q9 : Read quartiles and the median from a cumulative frequency graph to draw a box plot, then test a claim about the percentage who passed.June 2024 · Paper 2 Higher · Q11 : Complete a cumulative frequency table, draw the graph, estimate the interquartile range and count values above a given weight.June 2024 · Paper 3 Foundation · Q7 : Read a bar chart to find the mode and the difference between two categories.November 2023 · Paper 1 Foundation · Q8 : Tally a list of trip choices, state the mode and draw a bar chart.November 2023 · Paper 2 Higher · Q15 : Complete a frequency table and histogram from each other, then estimate a median from a second histogram.November 2023 · Paper 3 Higher · Q13 : Read a cumulative frequency graph to estimate a probability, the median and the interquartile range, then compare spreads.June 2023 · Paper 2 Higher · Q9 : Plot a cumulative frequency graph from a table of ages and read off an estimate of the median.November 2022 · Paper 1 Foundation · Q7 : Find the mode of a list of letters, then mark and state probabilities of picking particular letters.June 2022 · Paper 1 Higher · Q10 : Build a cumulative frequency table and graph for daily profits, then estimate a count and the interquartile range.June 2022 · Paper 1 Foundation · Q21 : Draw an ordered stem and leaf diagram with a key for a list of ages.June 2022 · Paper 2 Higher · Q10 : Explain an error about quartiles, draw a box plot from summary values, and compare two sales distributions.November 2021 · Paper 1 Higher · Q12 : Plot a cumulative frequency curve for plant heights and read off the median.November 2020 · Paper 3 Higher · Q17 : Work out class frequencies from a histogram and use midpoints to estimate the mean long-jump distance.November 2019 · Paper 1 Higher · Q10 : Draw a cumulative frequency graph, then use it to estimate the interquartile range and a probability.November 2019 · Paper 3 Foundation · Q9 : Tally survey results about favourite pets, draw a bar chart and state the mode.June 2019 · Paper 1 Foundation · Q7 : Read a bar-line chart to find a missing frequency from a total, then state the modal colour.June 2018 · Paper 1 Foundation · Q12 : Read a composite bar chart of computer sales, total one category, identify the fastest-growing item and comment on a claim about profit.June 2018 · Paper 2 Higher · Q17 : Read frequencies from a histogram with unequal class widths and estimate the lower quartile.June 2018 · Paper 3 Foundation · Q15 : Spot the error in an order-of-operations calculation and in a range calculation.Specimen · Paper 2 Higher · Q4 : Give the modal class from a grouped frequency table and spot two errors in a frequency polygon drawn for it.Specimen · Paper 2 Foundation · Q23 : Give the modal class from a grouped table and identify errors in a frequency polygon.