Revision guide by The Full Marks
Real-life graphs and areas under graphs: what you need to know Real-life graphs show how one quantity changes with another, such as cost against distance or speed against time. You read values, explain what the gradient means, and at Higher level find areas under curves.
Foundation reads and interprets real-life graphs and straight-line gradients; exponential contexts, tangents to curves and areas under graphs are Higher.
Key facts Gradient = change in y change in x = \frac{\text{change in } y}{\text{change in } x} = change in x change in y The y y y Distance-time graph: gradient = = = Conversion graphs: if a value is off the graph, convert a smaller amount and scale up, e.g. 80 = 8 × 10. Speed = distance time = \frac{\text{distance}}{\text{time}} = time distance = 20 60 = 1 3 = \frac{20}{60} = \frac{1}{3} = 60 20 = 3 1 Higher: velocity-time graph: gradient = = = = = = Higher: for a curve, estimate the gradient with a tangent and the area with trapeziums. Interpreting a straight-line graph Read the scale carefully: count what one small square is worth. Find the gradient from two points far apart on the line. Say what it means with units, e.g. 'the cost goes up £2 for every mile'. Higher: area under a curve with trapeziums Split the area into strips of equal width h h h Area of each strip = 1 2 h ( a + b ) = \frac{1}{2}h(a + b) = 2 1 h ( a + b ) a a a b b b Add the strips and state what the area means, e.g. distance in metres. Worked examples Example 1 Foundation · grade 3
A taxi in Leeds charges a fixed £3 plus £2 per mile. Its cost graph is a straight line. (a) What is the y y y
Show the solution (a) The fixed charge, £3.3 + 2 × 8 = 3 + 16 = 19 3 + 2 \times 8 = 3 + 16 = 19 3 + 2 × 8 = 3 + 16 = 19
Example 2 Foundation · grade 4
On a distance-time graph, Tom's line goes straight from 0 km at 10:00 to 8 km at 10:20. Work out his speed in km/h.
Show the solution Time taken: 20 minutes = 20 60 = 1 3 = \frac{20}{60} = \frac{1}{3} = 60 20 = 3 1 = 8 ÷ 1 3 = 8 × 3 = 24 = 8 \div \frac{1}{3} = 8 \times 3 = 24 = 8 ÷ 3 1 = 8 × 3 = 24 = 24 = 24 = 24
Example 3 Higher · grade 7
A cyclist's speed in m/s at t = 0 , 2 , 4 , 6 t = 0, 2, 4, 6 t = 0 , 2 , 4 , 6 0 , 5 , 8 , 9 0, 5, 8, 9 0 , 5 , 8 , 9
Show the solution Each strip has width 2.1 2 × 2 × ( 0 + 5 ) = 5 \frac{1}{2} \times 2 \times (0 + 5) = 5 2 1 × 2 × ( 0 + 5 ) = 5 1 2 × 2 × ( 5 + 8 ) = 13 \frac{1}{2} \times 2 \times (5 + 8) = 13 2 1 × 2 × ( 5 + 8 ) = 13 1 2 × 2 × ( 8 + 9 ) = 17 \frac{1}{2} \times 2 \times (8 + 9) = 17 2 1 × 2 × ( 8 + 9 ) = 17 ≈ 5 + 13 + 17 = 35 \approx 5 + 13 + 17 = 35 ≈ 5 + 13 + 17 = 35
Common mistakes Misreading the scale, e.g. treating each small square as 10 minutes when it is 15. Drawing a chord between two points on a curve instead of a tangent to find a gradient. Leaving out the negative sign on a gradient for something that is falling (e.g. depth going down), or giving a gradient with no units. Treating minutes as decimals of an hour: 1 hour 30 minutes is 1.5 hours, not 1.3 hours. Exam tips 'Interpret' questions need a sentence in context with units, not just a number. Questions people ask What does the area under a velocity-time graph show? The distance travelled. Split it into triangles, rectangles or trapeziums and add their areas.
How do you find the gradient of a curve? Draw a tangent that just touches the curve at that point, then find the gradient of the tangent using two points far apart on it.
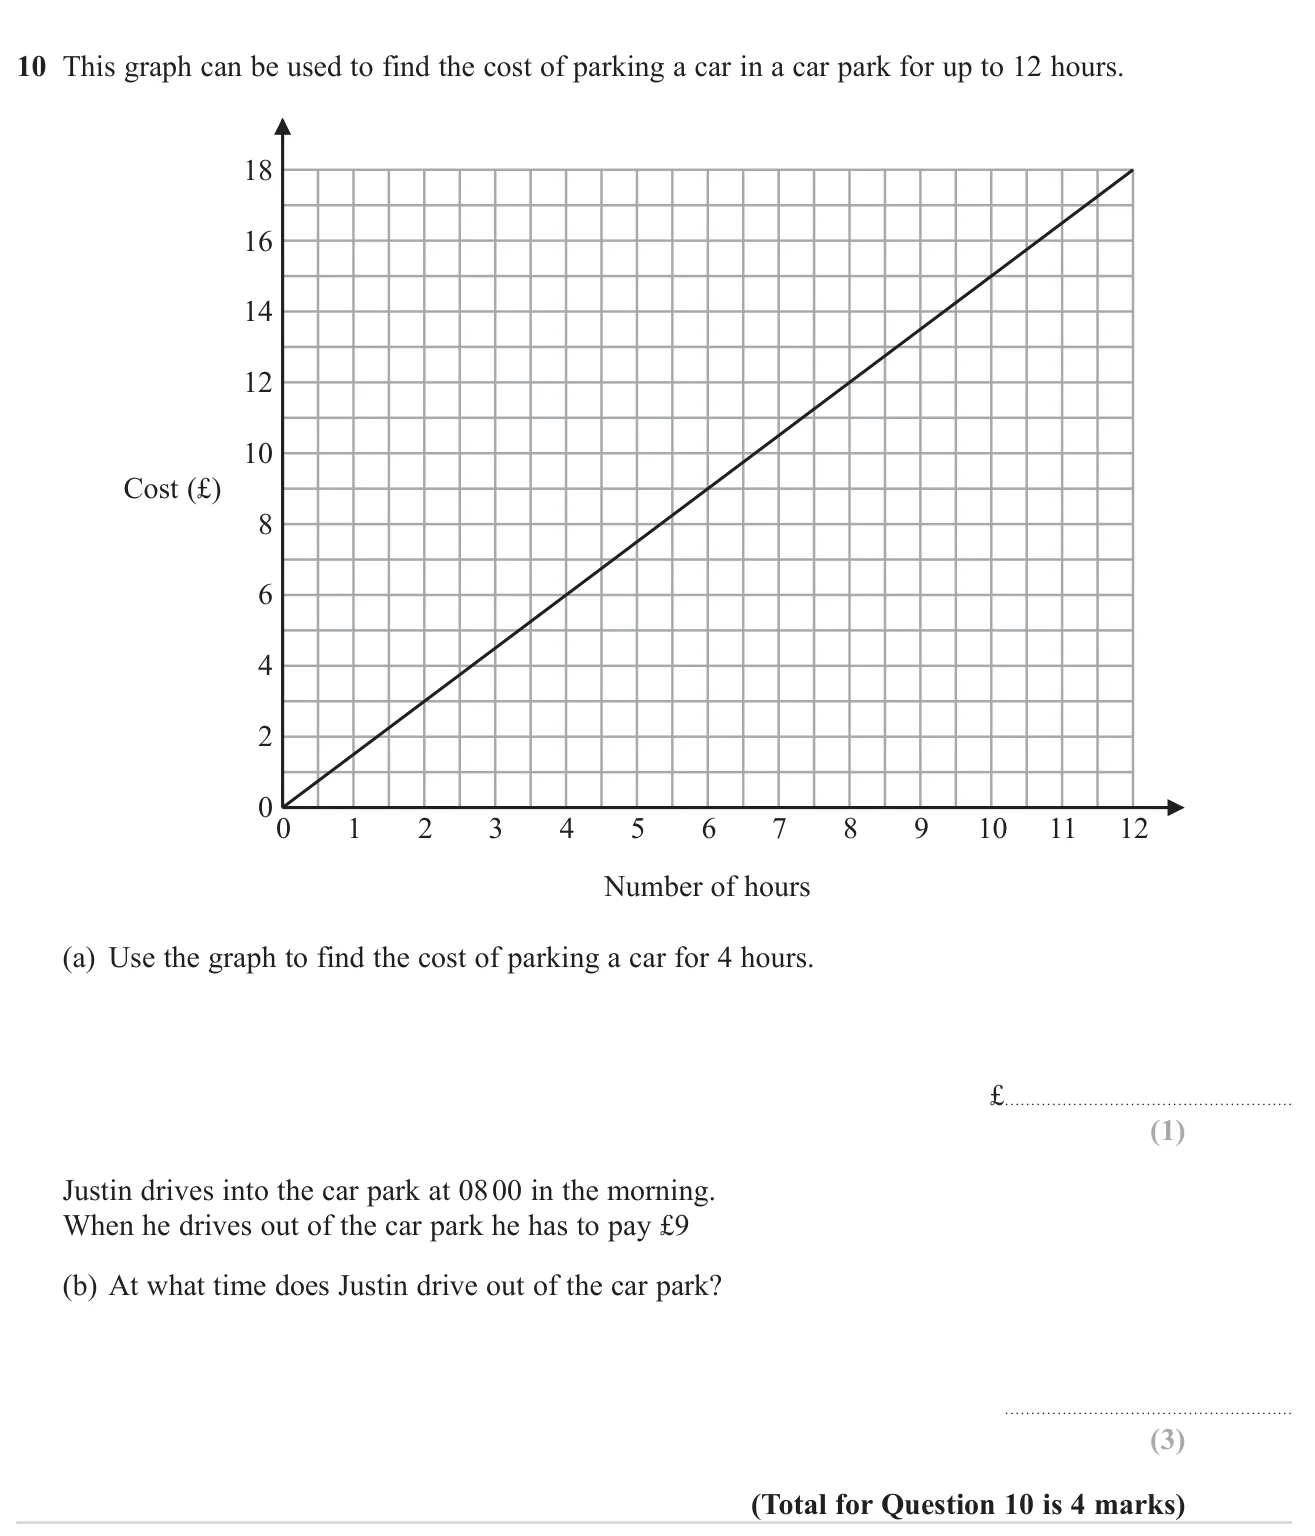
Exam questions: Real-life graphs and areas under graphs (27, easiest first) © Pearson Education Ltd. June 2023 Paper 2 (Foundation, calculator), question 10.
(a) £6 1 mark (b) 14 00 (2 pm) 3 marks
Worked solution Checked against the mark scheme
(a) Go up from 4 hours to the line and across: £6.
(b) Go across from £9 to the line and down: 6 hours.
08 00 + 6 08\,00 + 6 08 00 + 6 = 14 00 = 14\,00 = 14 00
Watch out: Writing the time as 14 pm or giving just '6'.
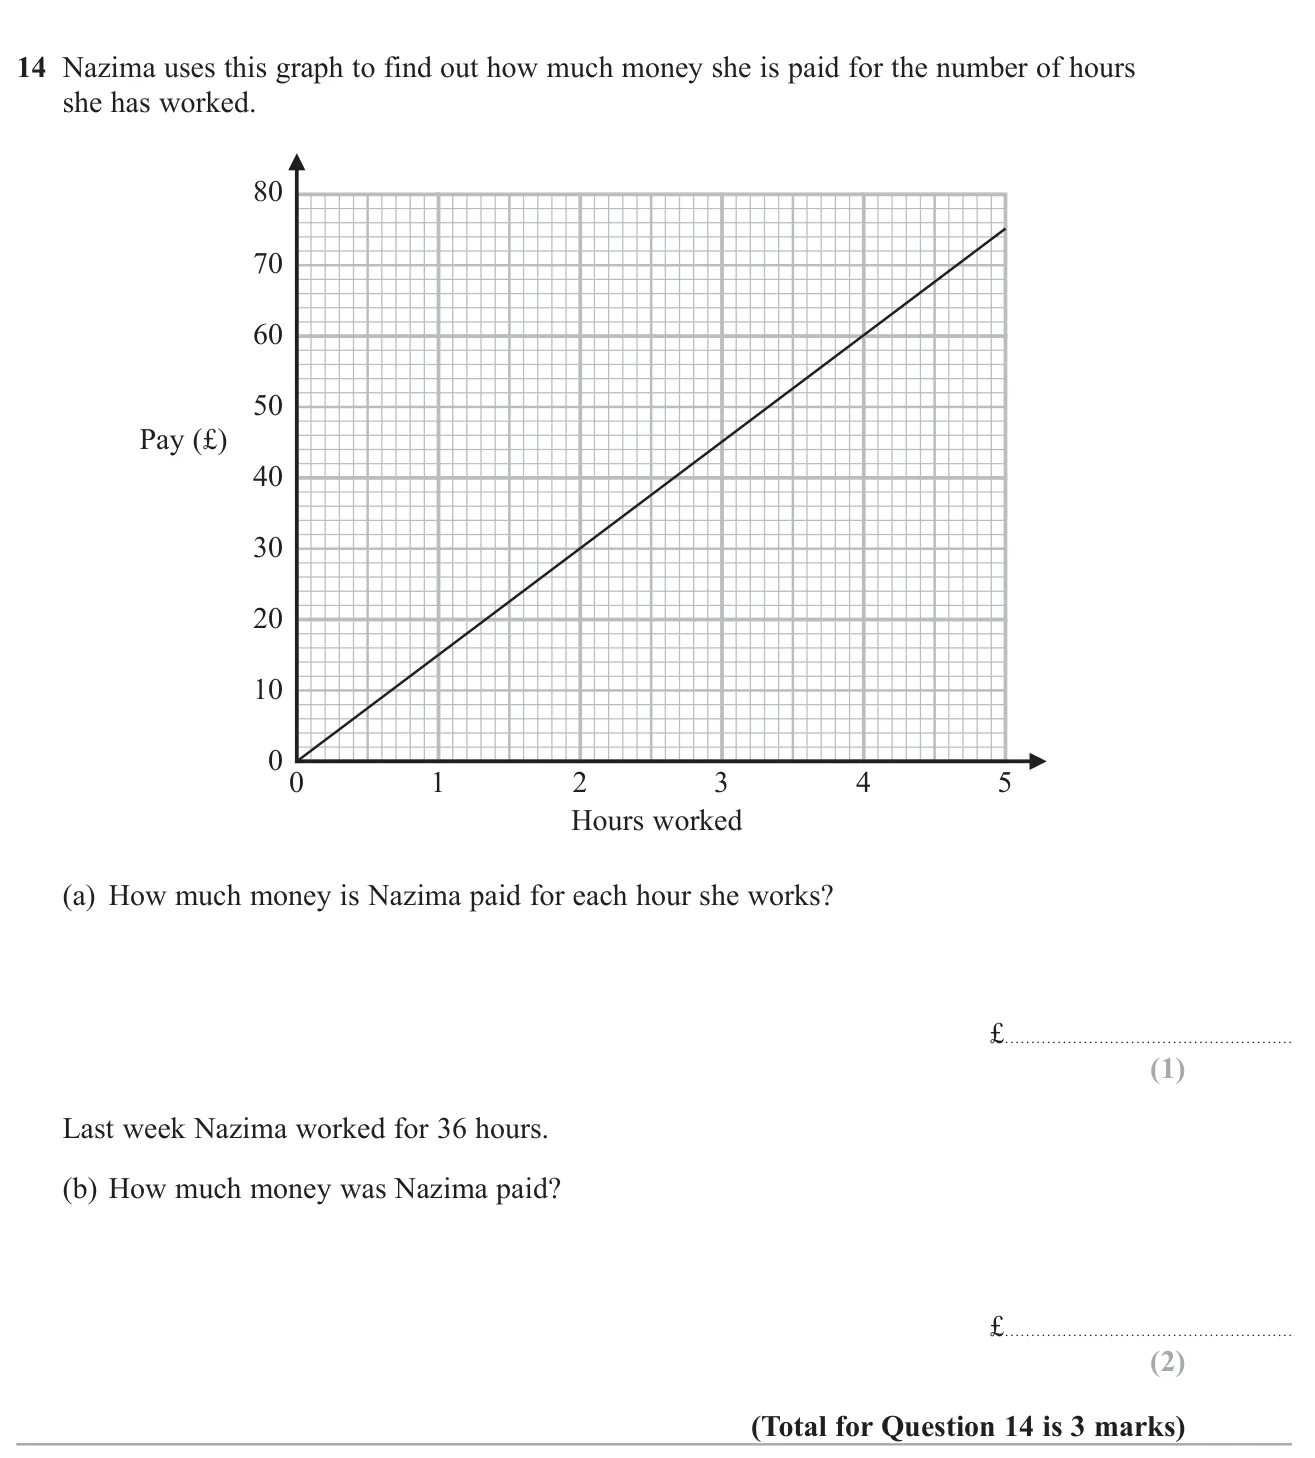
© Pearson Education Ltd. November 2021 Paper 2 (Foundation, calculator), question 14.
(a) £15 1 mark (b) £540 2 marks
Worked solution Checked against the mark scheme
(a) At 2 hours the pay is £30, so 30 ÷ 2 = £ 15 30 \div 2 = £15 30 ÷ 2 = £15
(b) 15 × 36 = £ 540 15 \times 36 = £540 15 × 36 = £540
Watch out: Reading the graph at 36 on the wrong axis or using an incorrect hourly rate.
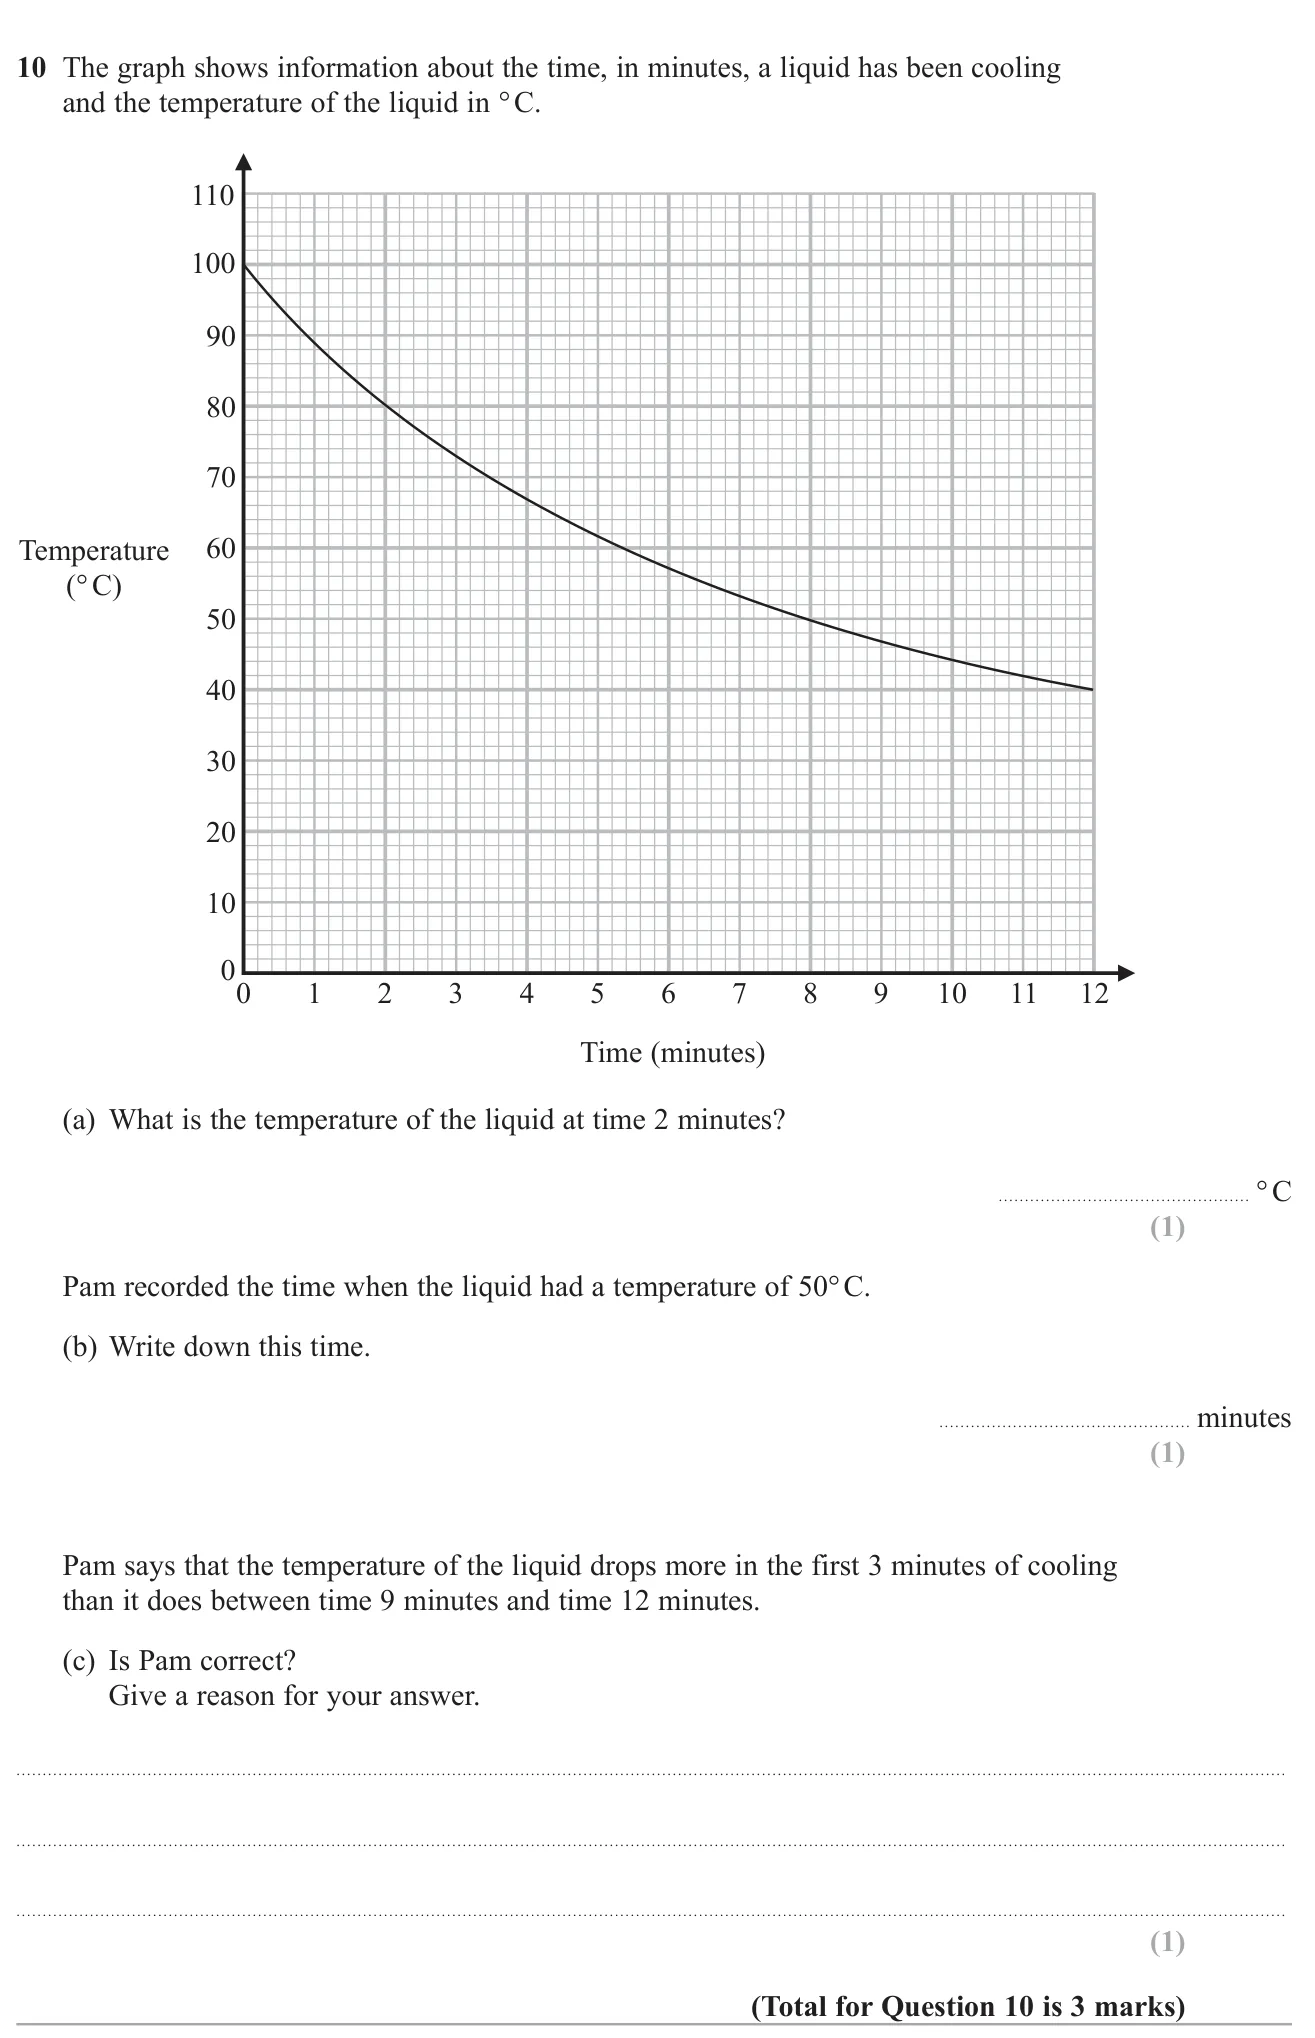
© Pearson Education Ltd. November 2020 Paper 3 (Foundation, calculator), question 10.
(a) 80 °C 1 mark (b) 8 minutes 1 mark (c) Yes: it falls about 27 °C in the first 3 minutes but only about 7 °C from 9 to 12 minutes 1 mark
Worked solution Checked against the mark scheme
(a) Up from 2 minutes to the curve, across: 80 °C .
(b) Across from 50 °C to the curve, down: 8 minutes .
(c) From 100 to about 73 is a drop of about 27. From about 47 to 40 is a drop of about 7. So yes , Pam is right.
Watch out: In (c), comparing temperatures instead of the size of the drops.
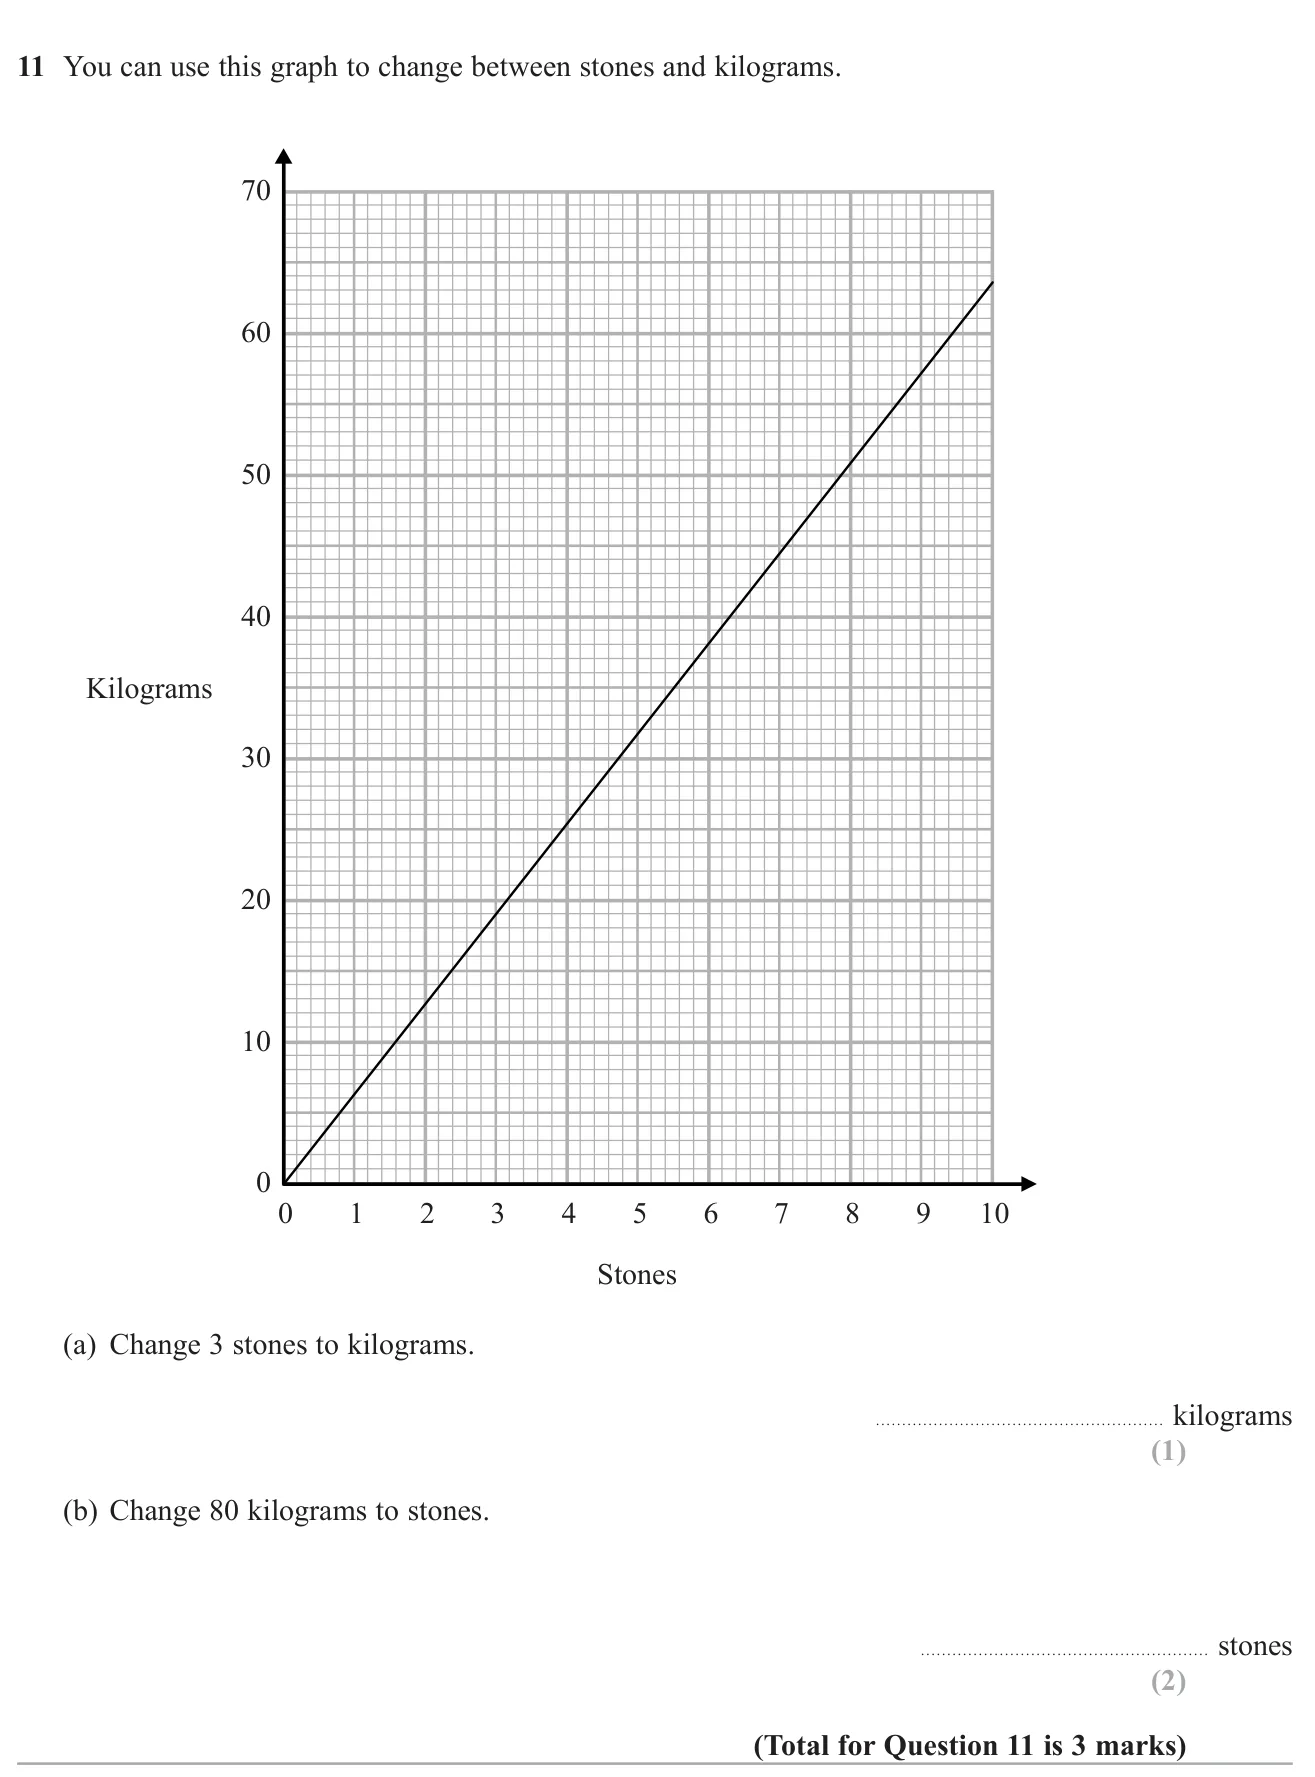
© Pearson Education Ltd. November 2019 Paper 2 (Foundation, calculator), question 11.
(a) 19 kg 1 mark (b) 12.6 stones (12.4 to 12.8) 2 marks
Worked solution Checked against the mark scheme
(a) Go up from 3 stones to the line and across: about 19 kg .
(b) 80 kg is off the graph, so use 40 kg: 40 kg is about 6.3 stones.
80 kg = 2 × 6.3 = 12.6 80\text{ kg} = 2 \times 6.3 = 12.6 80 kg = 2 × 6.3 = 12.6
Watch out: Reading 80 on the stones axis, or not scaling up.
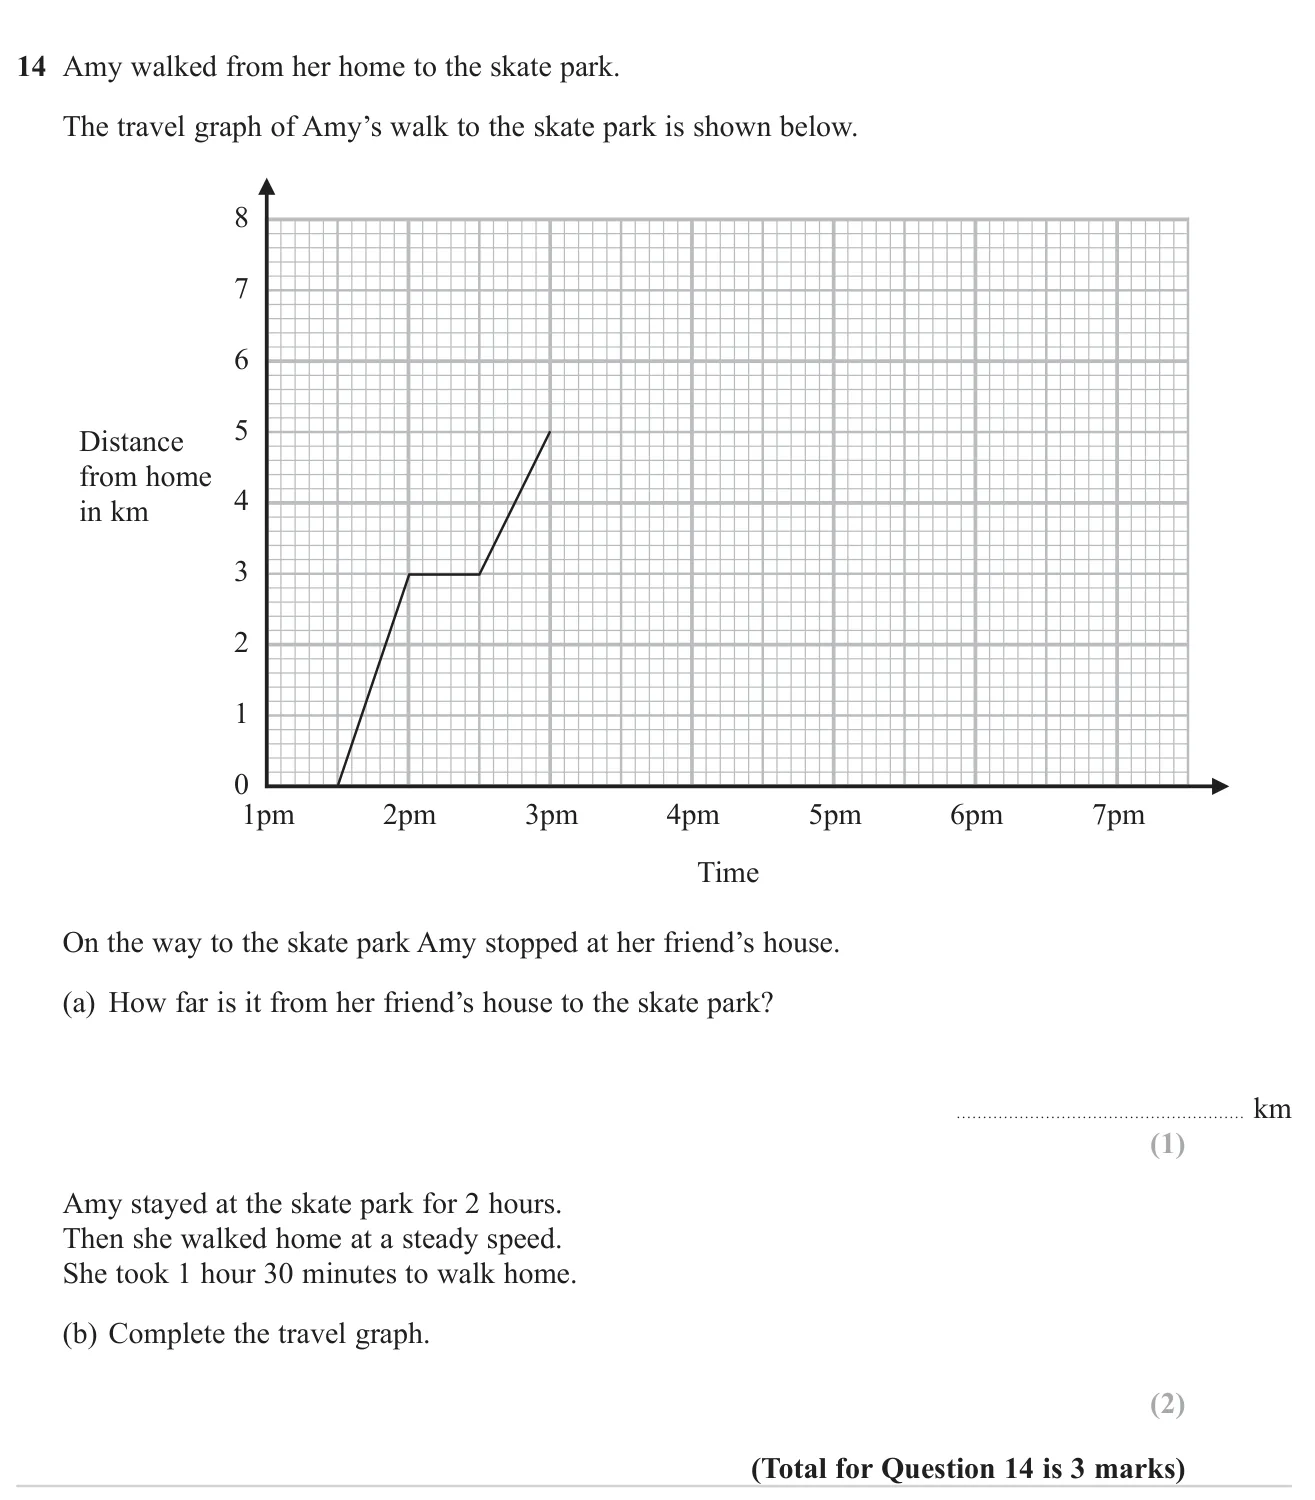
© Pearson Education Ltd. November 2024 Paper 2 (Foundation, calculator), question 14.
(a) 2 km 1 mark (b) Horizontal line from (3pm, 5) to (5pm, 5), then a straight line down to (6:30pm, 0) 2 marks
Worked solution Checked against the mark scheme
(a) The friend's house is the first flat part at 3 km; the skate park is at 5 km. 5 − 3 = 2 5 - 3 = 2 5 − 3 = 2
(b) She arrives at 3pm, stays 2 hours: flat line at 5 km until 5pm.
She then walks home in 1 1 2 1\frac{1}{2} 1 2 1
Watch out: Treating 1 hour 30 minutes as 1.3 hours when reading the time axis.
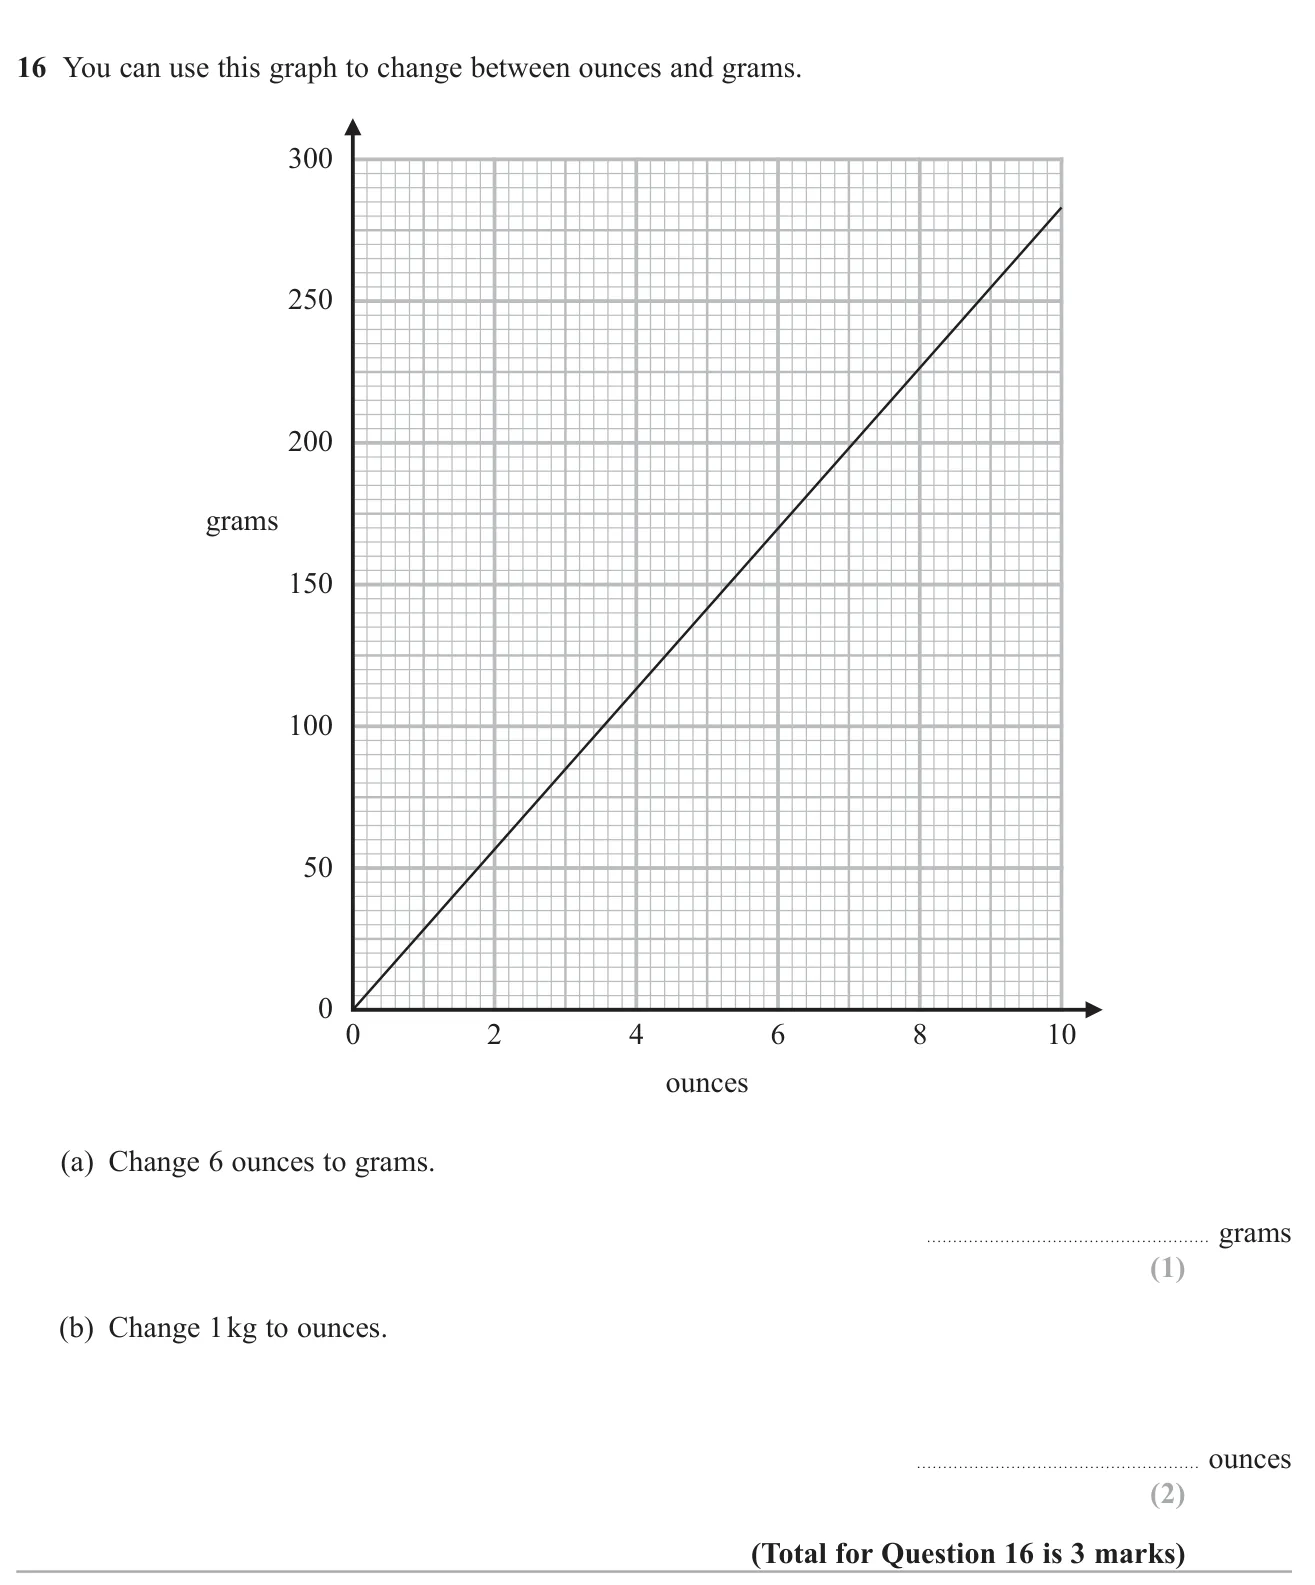
© Pearson Education Ltd. June 2024 Paper 2 (Foundation, calculator), question 16.
(a) 170 170 170 1 mark (b) 35 35 35 2 marks
Worked solution Checked against the mark scheme
(a) Go up from 6 ounces to the line and across: about 170 170 170
(b) 1 1 1 = 1000 = 1000 = 1000 200 200 200 ≈ 7 \approx 7 ≈ 7
1000 = 5 × 200 1000 = 5 \times 200 1000 = 5 × 200 1000 1000 1000 ≈ 5 × 7 = 35 \approx 5 \times 7 = 35 ≈ 5 × 7 = 35
Watch out: Reading 1000 g as 1 on the grams axis, or forgetting to convert kg to g.
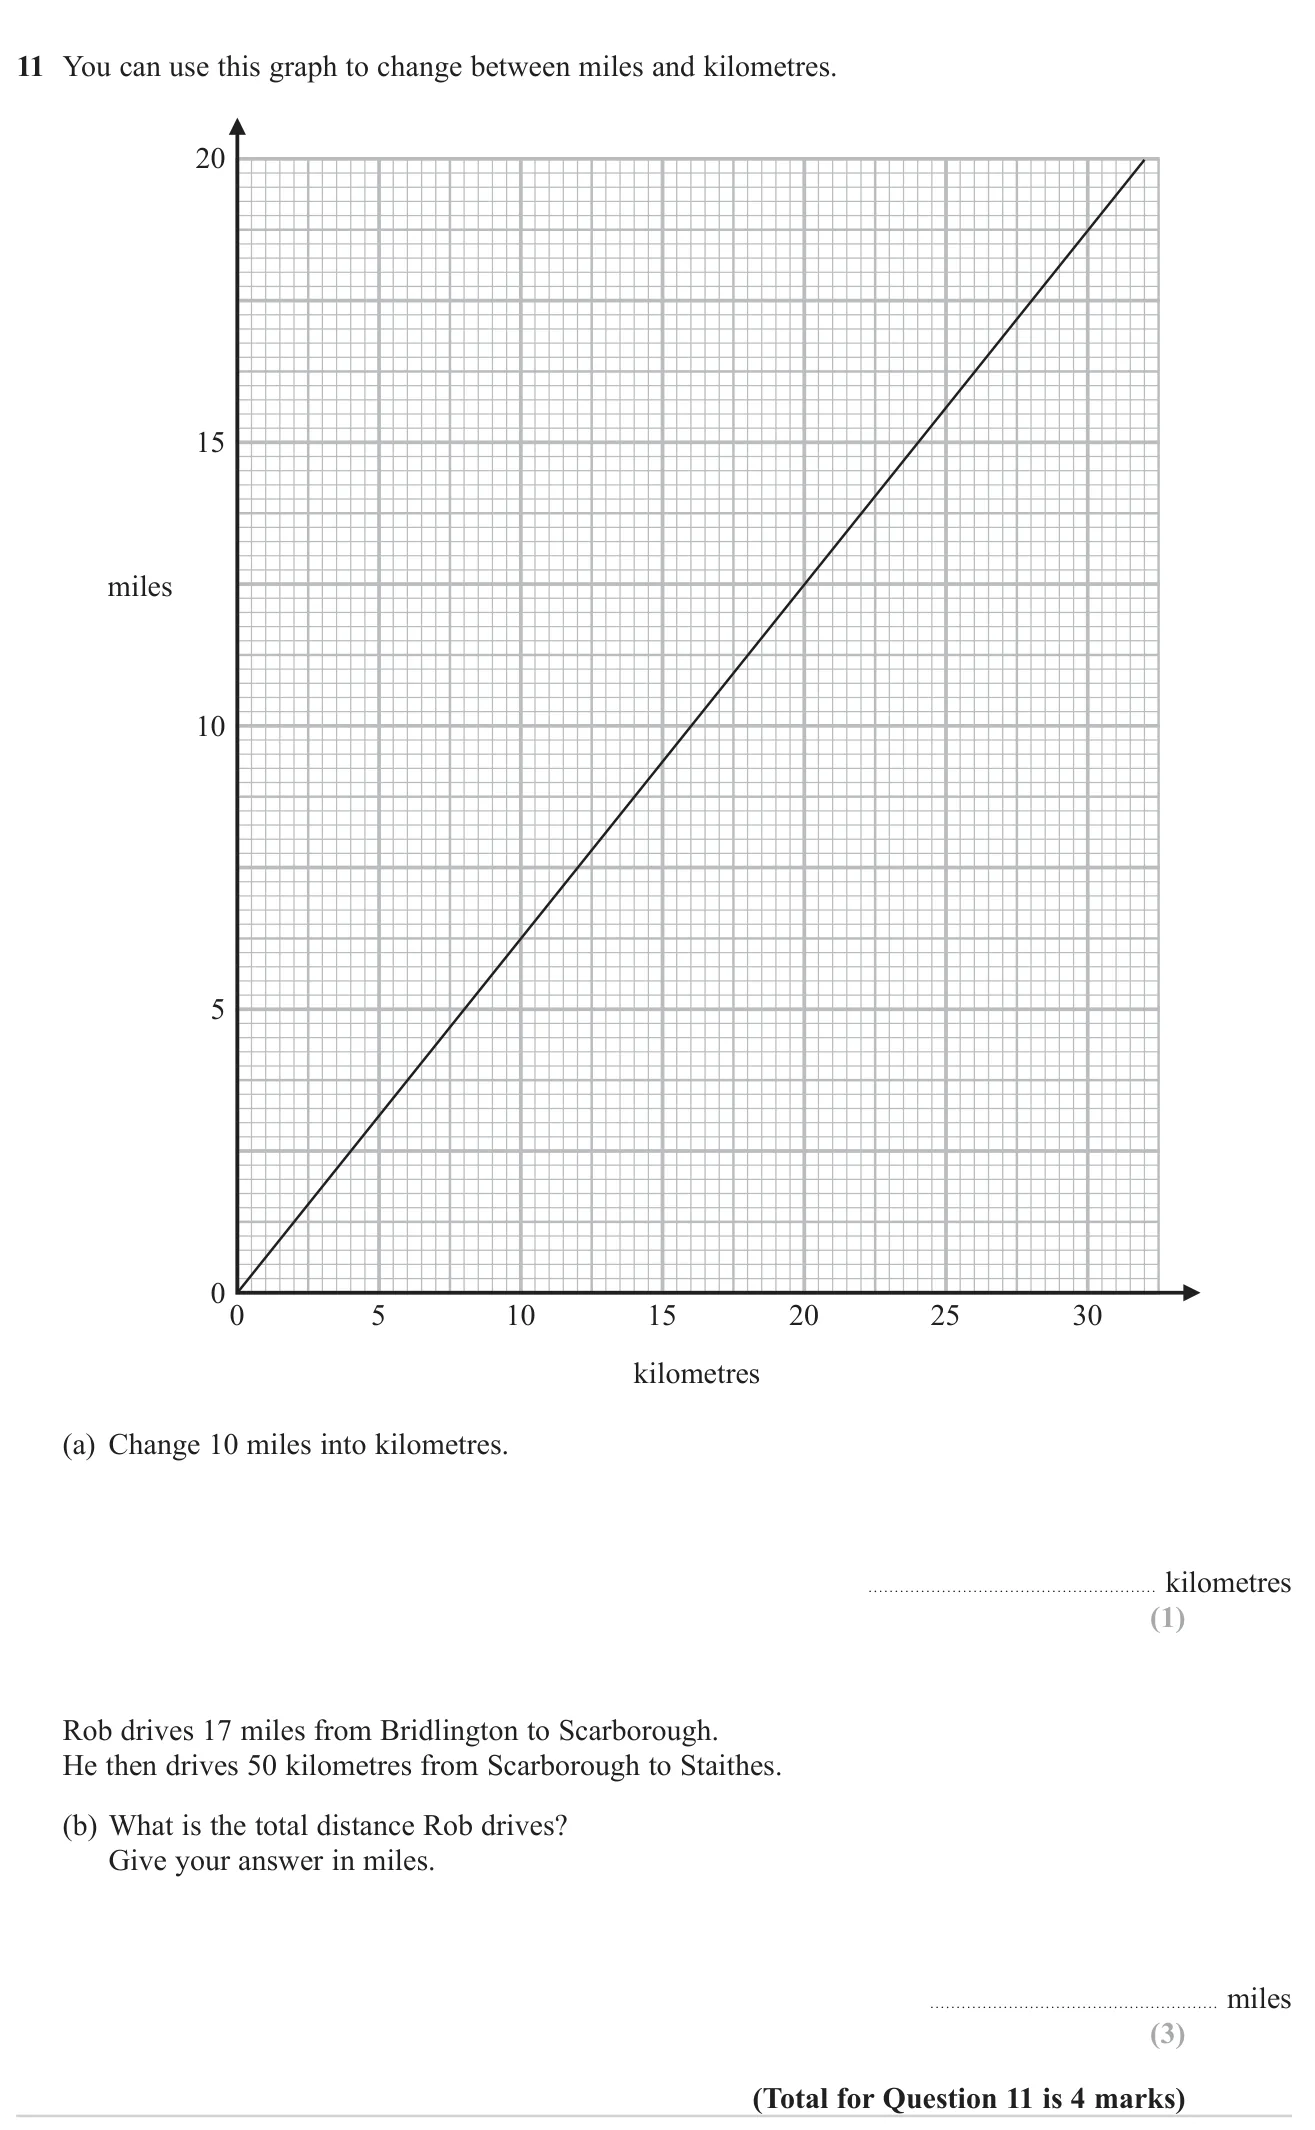
© Pearson Education Ltd. November 2024 Paper 3 (Foundation, calculator), question 11.
(a) 16 16 16 1 mark (b) 48 48 48 3 marks
Worked solution Checked against the mark scheme
(a) Read across from 10 miles: 16 km .
(b) From the graph, 25 km ≈ 15.5 \approx 15.5 ≈ 15.5 ≈ 31 \approx 31 ≈ 31
Total: 17 + 31 = 48 17 + 31 = 48 17 + 31 = 48
Watch out: Adding 17 and 50 without converting the kilometres.
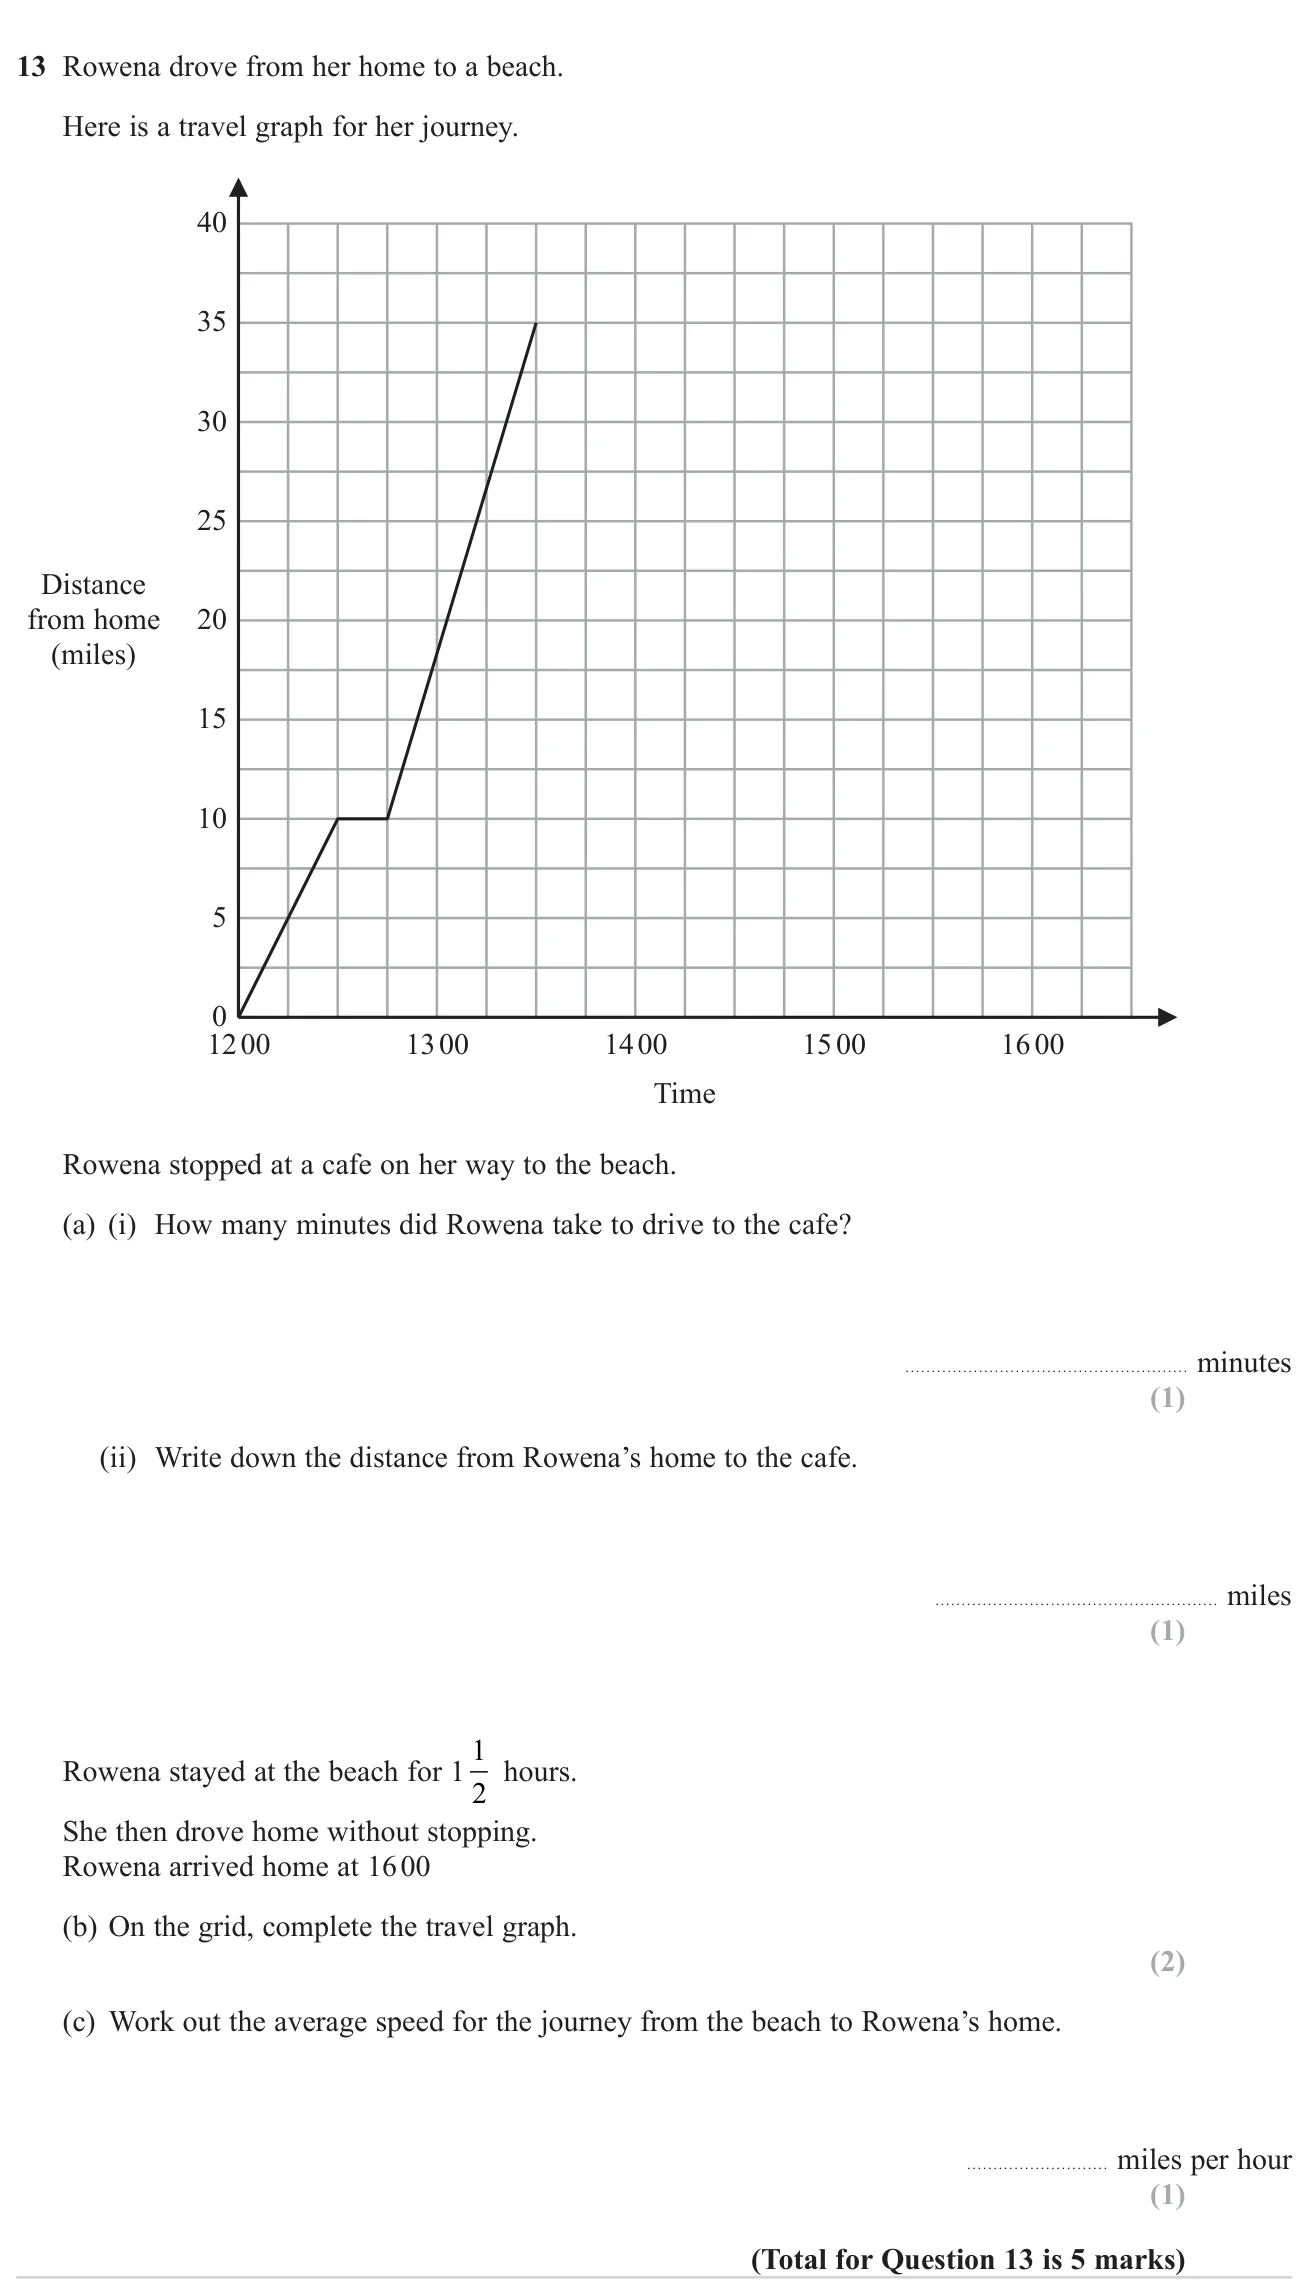
© Pearson Education Ltd. June 2023 Paper 3 (Foundation, calculator), question 13.
(a(i)) 30 1 mark (a(ii)) 10 1 mark (b) Horizontal line at 35 miles from 13:30 to 15:00, then a straight line down to 0 at 16:00 2 marks (c) 35 1 mark
Worked solution Checked against the mark scheme
(a)(i) The first line goes from 12:00 to 12:30, so 30 minutes.
(a)(ii) The flat section is at 10 miles.
(b) She reaches the beach at 13:30; draw a flat line at 35 miles to 15:00, then a straight line to 0 at 16:00.
(c) 35 miles in 1 hour, so 35 ÷ 1 = 35 35 \div 1 = 35 35 ÷ 1 = 35
Watch out: Reading each small square on the time axis as 10 minutes instead of 15.
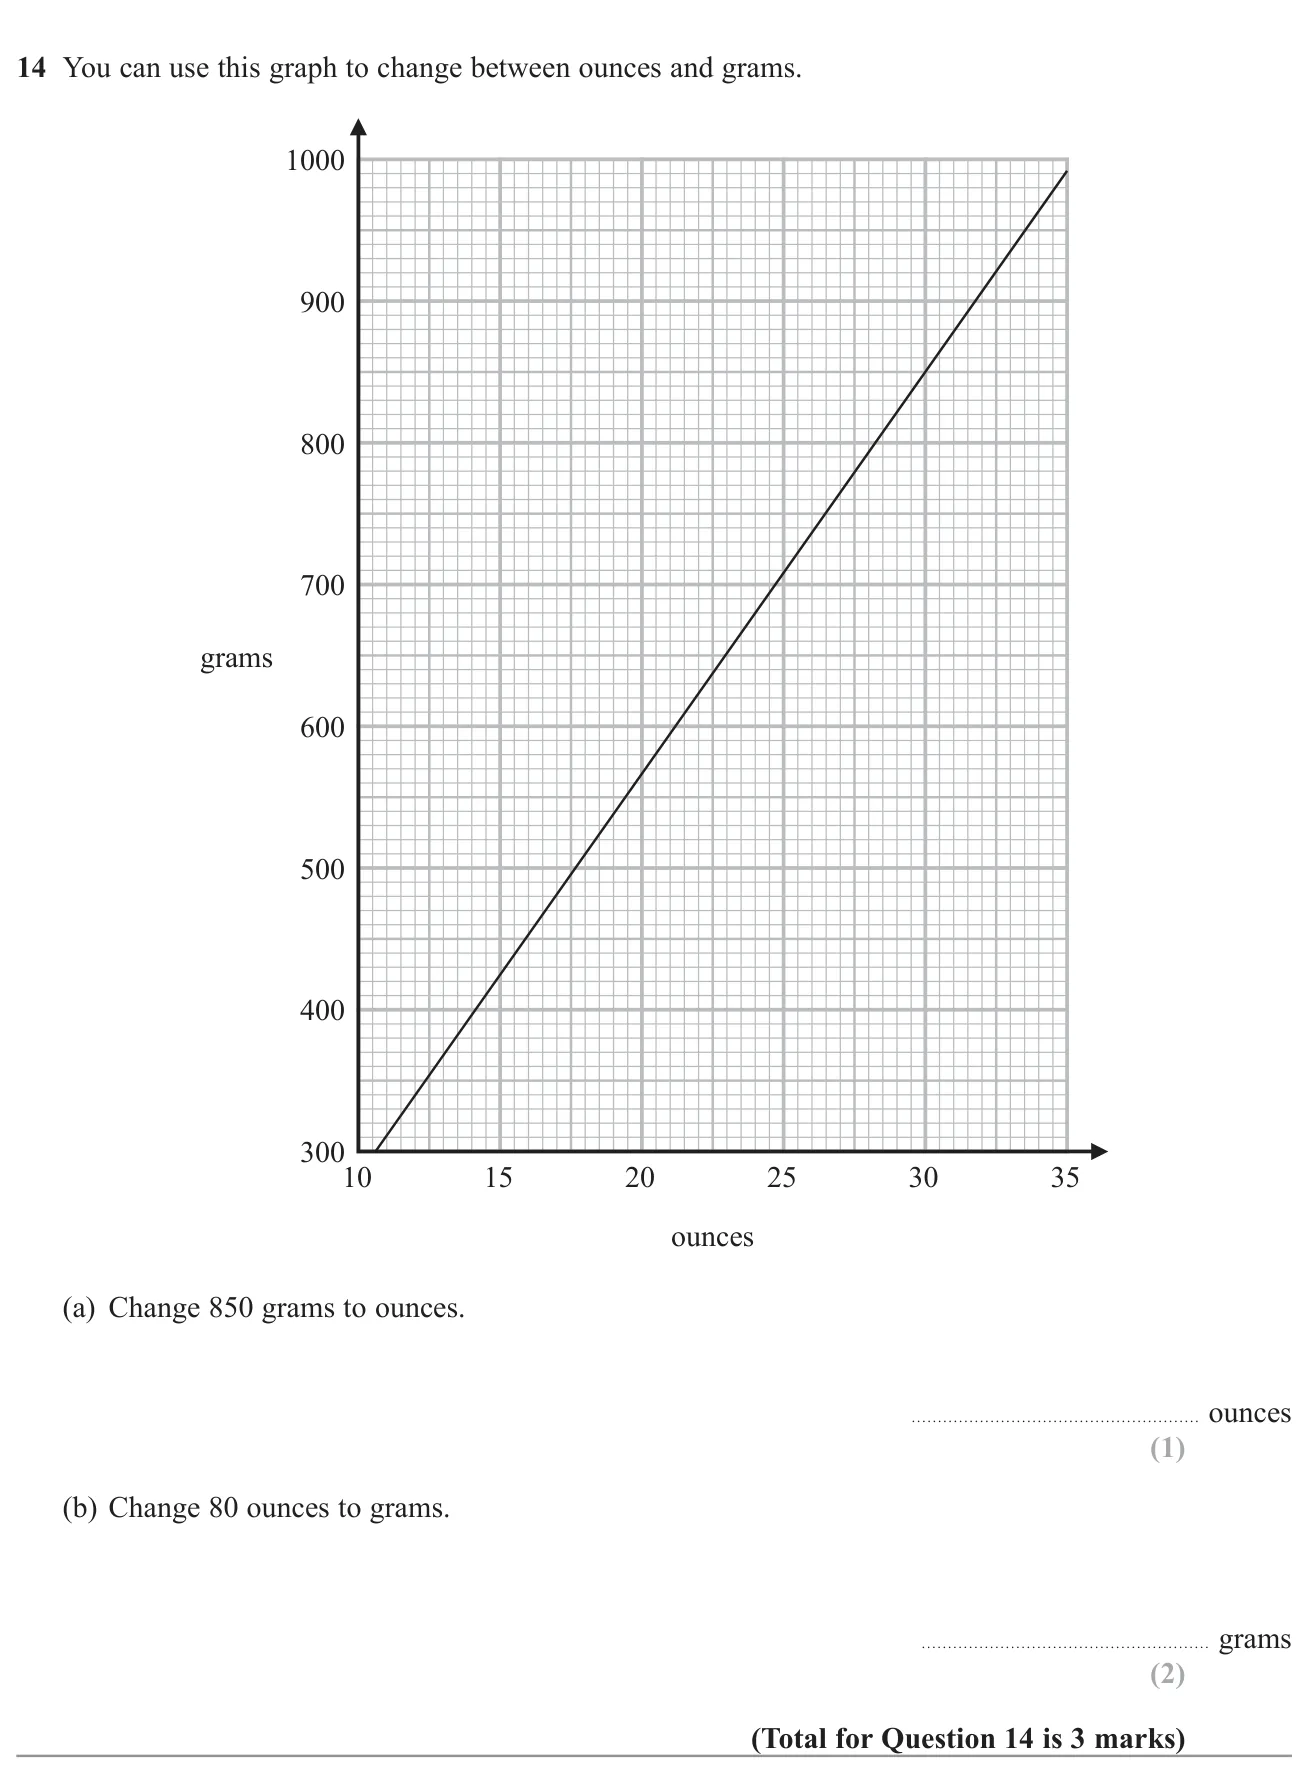
© Pearson Education Ltd. November 2022 Paper 3 (Foundation, calculator), question 14.
(a) 30 ounces 1 mark (b) About 2270 grams (2238–2296) 2 marks
Worked solution Checked against the mark scheme
(a) Across from 850 g to the line, then down: 30 ounces.
(b) 80 is off the graph, so use 20 ounces: 20 ounces ≈ 567 g.
80 = 4 × 20 80 = 4 \times 20 80 = 4 × 20 4 × 567 ≈ 2268 4 \times 567 \approx 2268 4 × 567 ≈ 2268
Watch out: Reading 80 ounces as if it were on the graph, or adding instead of multiplying.
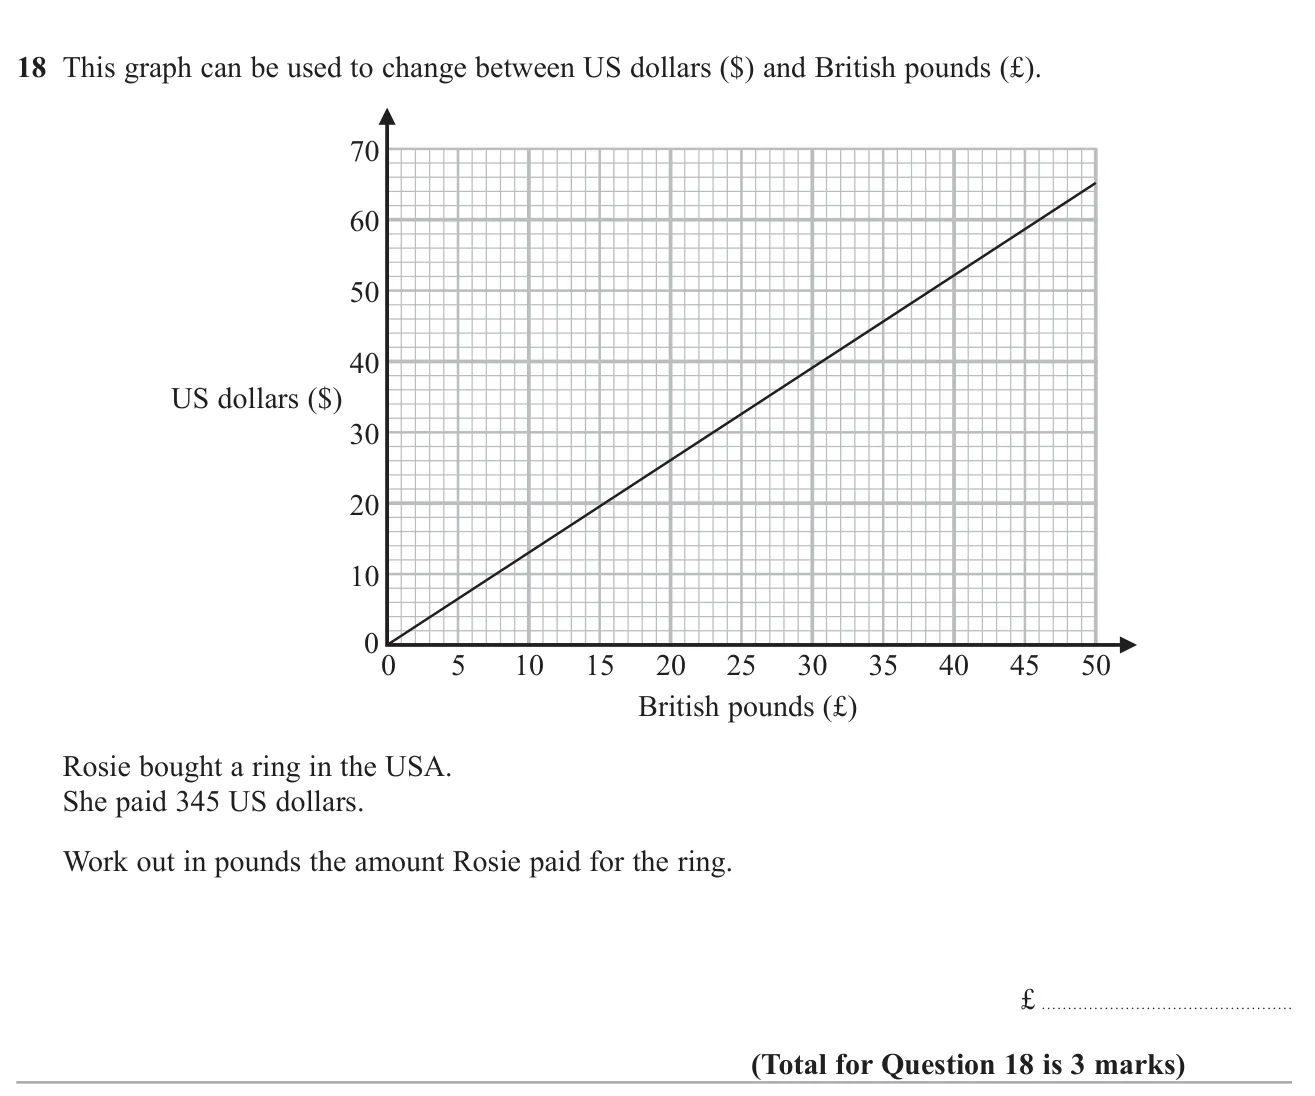
© Pearson Education Ltd. November 2020 Paper 3 (Foundation, calculator), question 18.
Answer About £265 (accept 258 to 275) 3 marks
Worked solution Checked against the mark scheme
The graph shows £50 = 65 dollars.
345 ÷ 65 = 5.307... 345 \div 65 = 5.307... 345 ÷ 65 = 5.307...
5.307... × 50 ≈ £ 265 5.307... \times 50 \approx £265 5.307... × 50 ≈ £265
Watch out: Reading the graph the wrong way round, converting pounds to dollars.
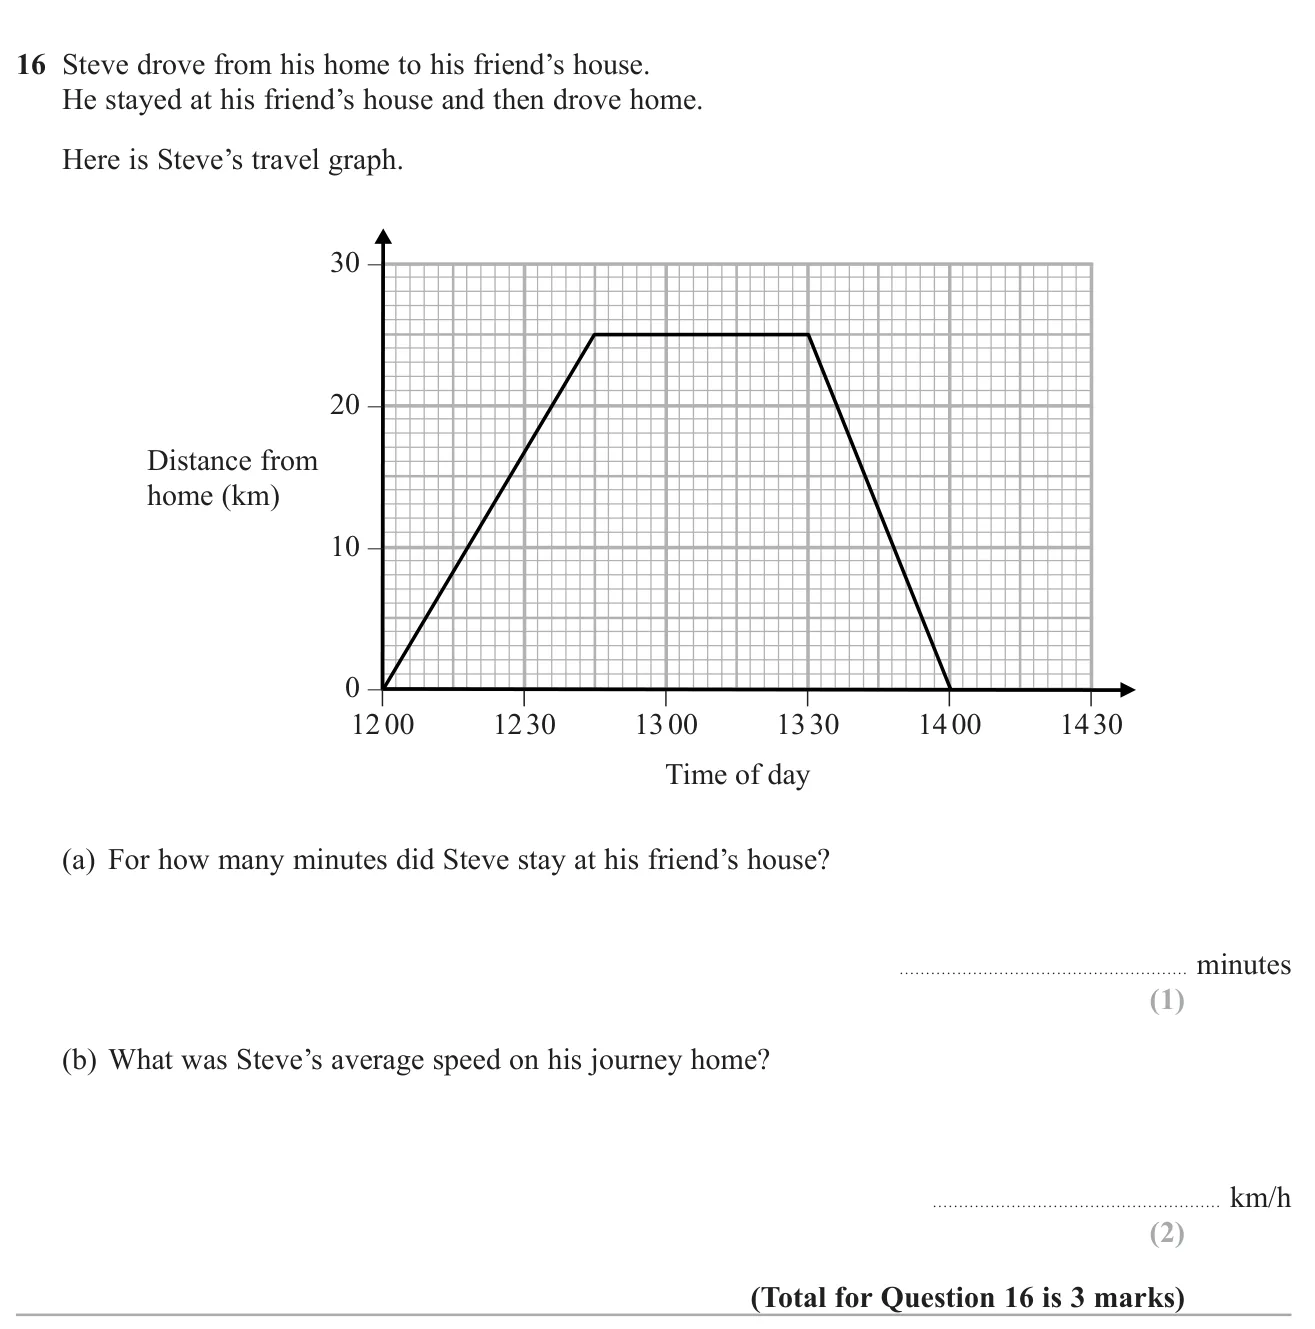
© Pearson Education Ltd. November 2019 Paper 1 (Foundation, non-calculator), question 16.
(a) 45 45 45 1 mark (b) 50 50 50 2 marks
Worked solution Checked against the mark scheme
(a) The flat part runs from 12:45 to 13:30, which is 45 minutes.
(b) He drives 25 km home between 13:30 and 14:00, which is half an hour.
Speed = 25 ÷ 0.5 = 50 = 25 \div 0.5 = 50 = 25 ÷ 0.5 = 50
Watch out: Dividing 25 by 30 (minutes) instead of by 0.5 hours.
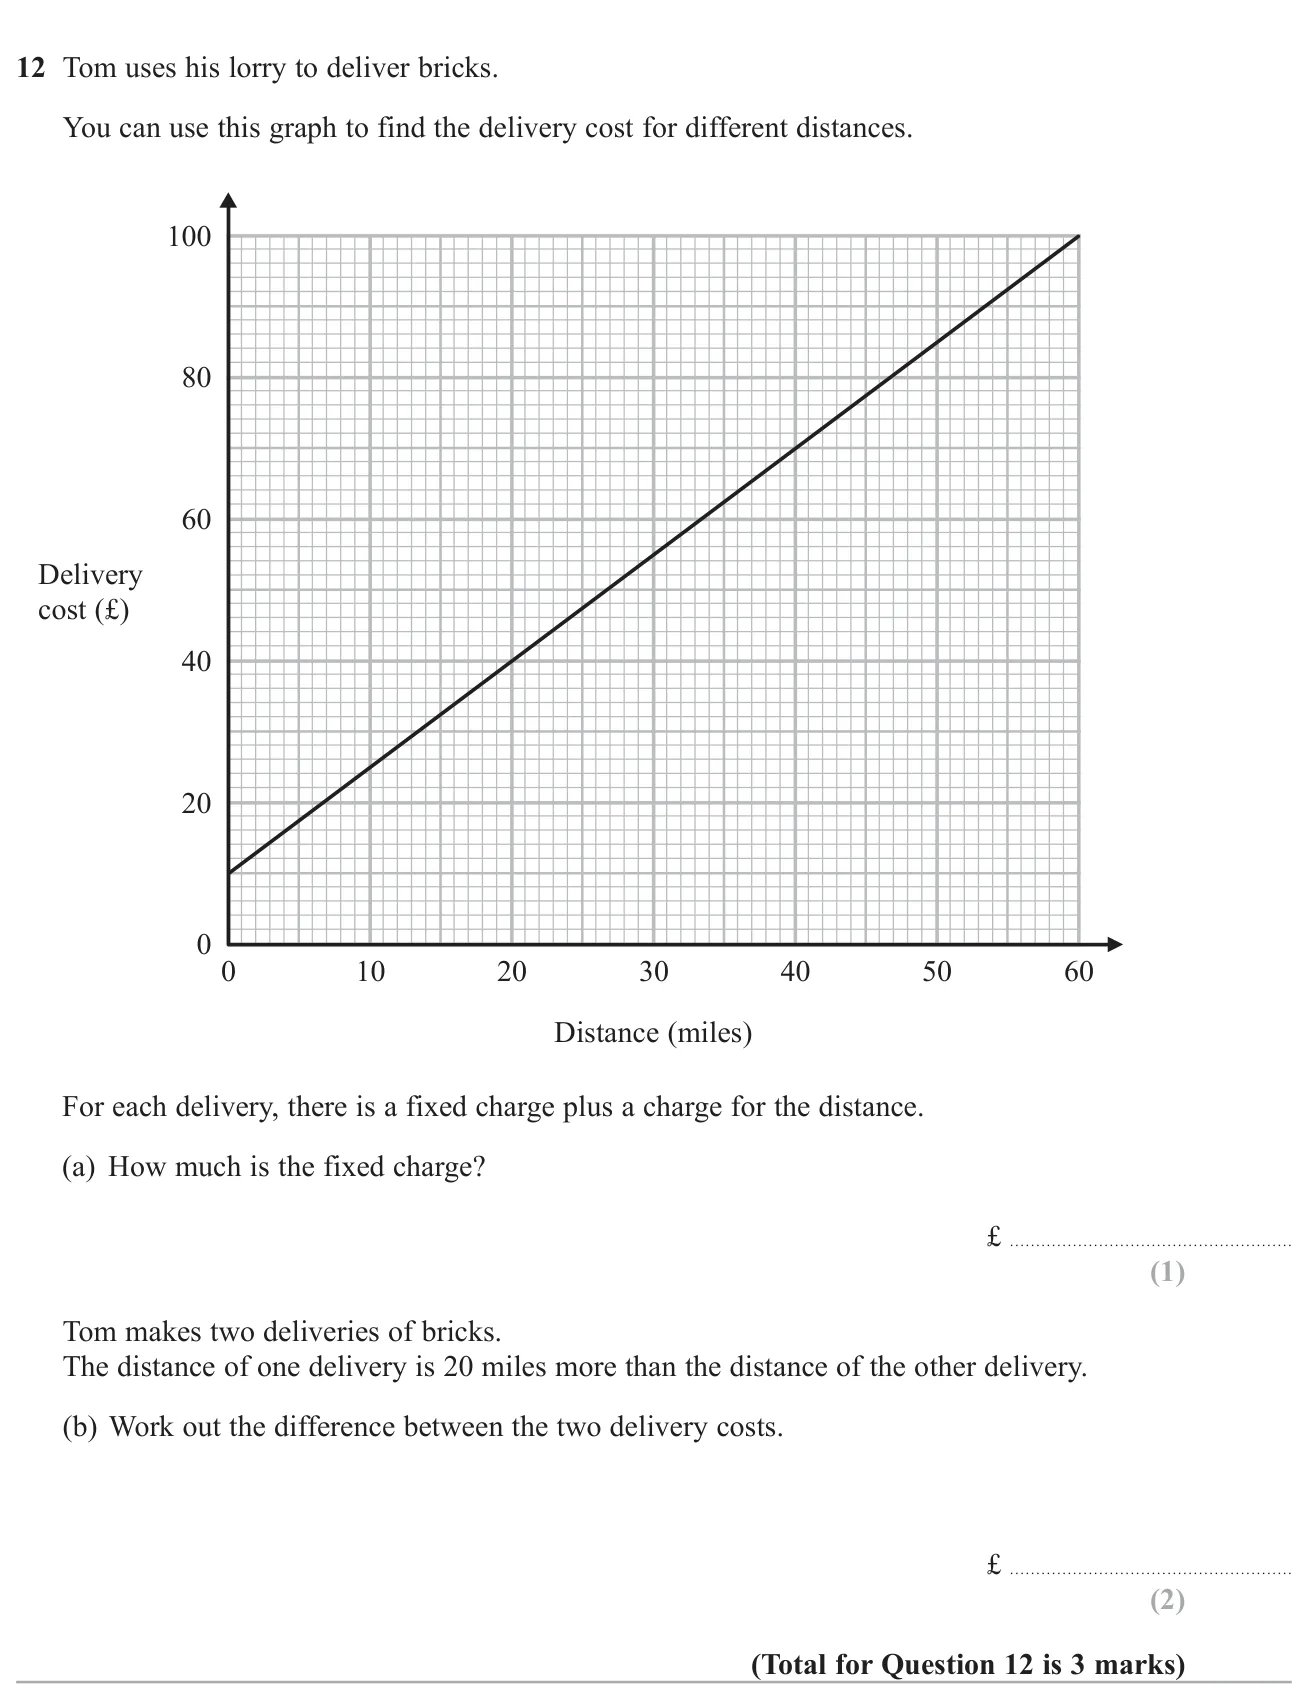
© Pearson Education Ltd. November 2018 Paper 1 (Foundation, non-calculator), question 12.
(a) £10 1 mark (b) £30 2 marks
Worked solution Checked against the mark scheme
(a) At 0 miles the line starts at £10, so the fixed charge is £10.
(b) The line rises from £10 to £100 over 60 miles, which is £1.50 per mile.
20 miles more costs 20 × 1.5 = £ 30 20 \times 1.5 = £30 20 × 1.5 = £30
Watch out: Giving the cost of a 20-mile delivery (£40) instead of the difference.
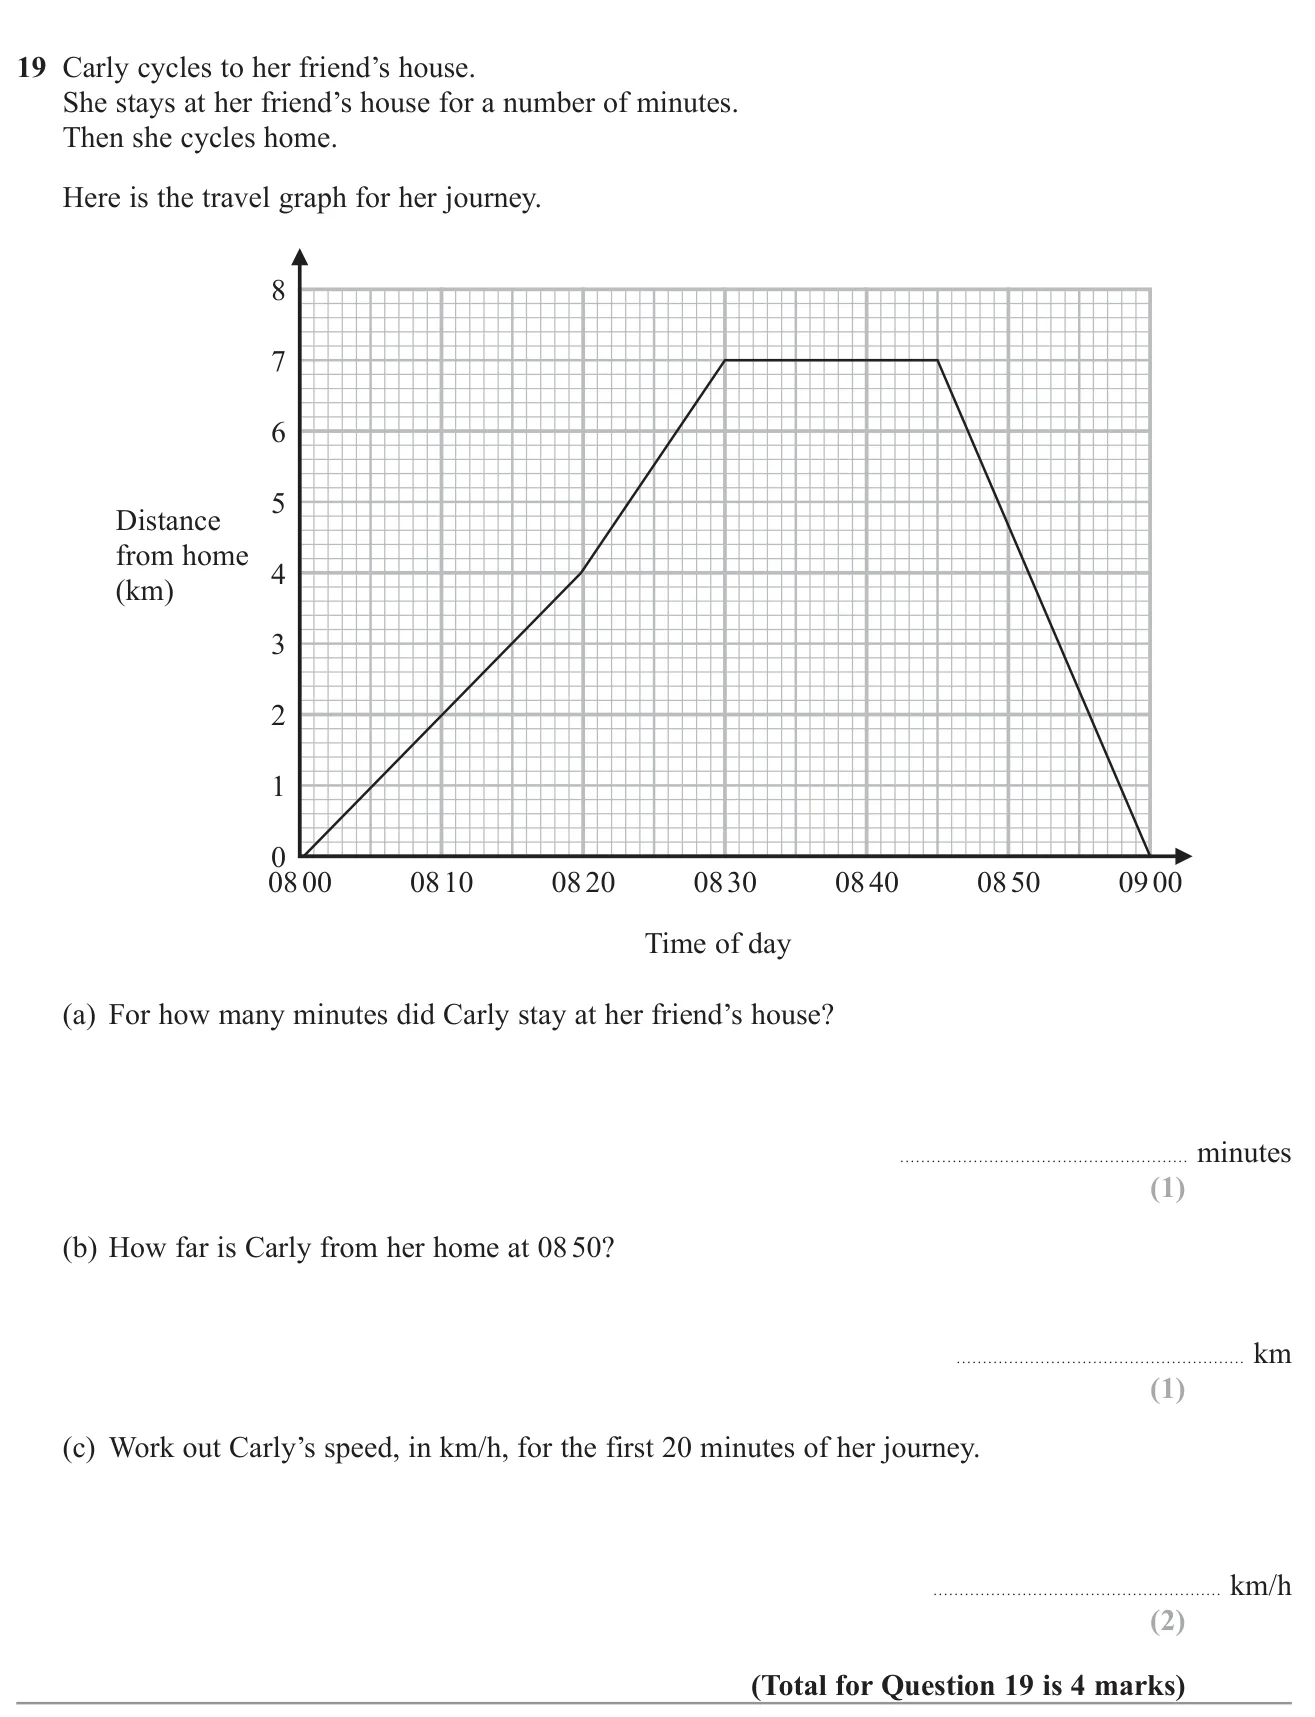
© Pearson Education Ltd. November 2022 Paper 3 (Foundation, calculator), question 19.
(a) 15 minutes 1 mark (b) 4.6 km (4.4–4.8) 1 mark (c) 12 km/h 2 marks
Worked solution Checked against the mark scheme
(a) The line is flat from 08 30 to 08 45: 15 minutes.
(b) At 08 50 the graph is at about 4.6 km.
(c) She travels 4 km in 20 minutes. 20 minutes = 1 3 = \frac{1}{3} = 3 1
Speed = 4 ÷ 1 3 = 12 = 4 \div \frac{1}{3} = 12 = 4 ÷ 3 1 = 12
Watch out: Giving 0.2 (km per minute) instead of converting to km/h.
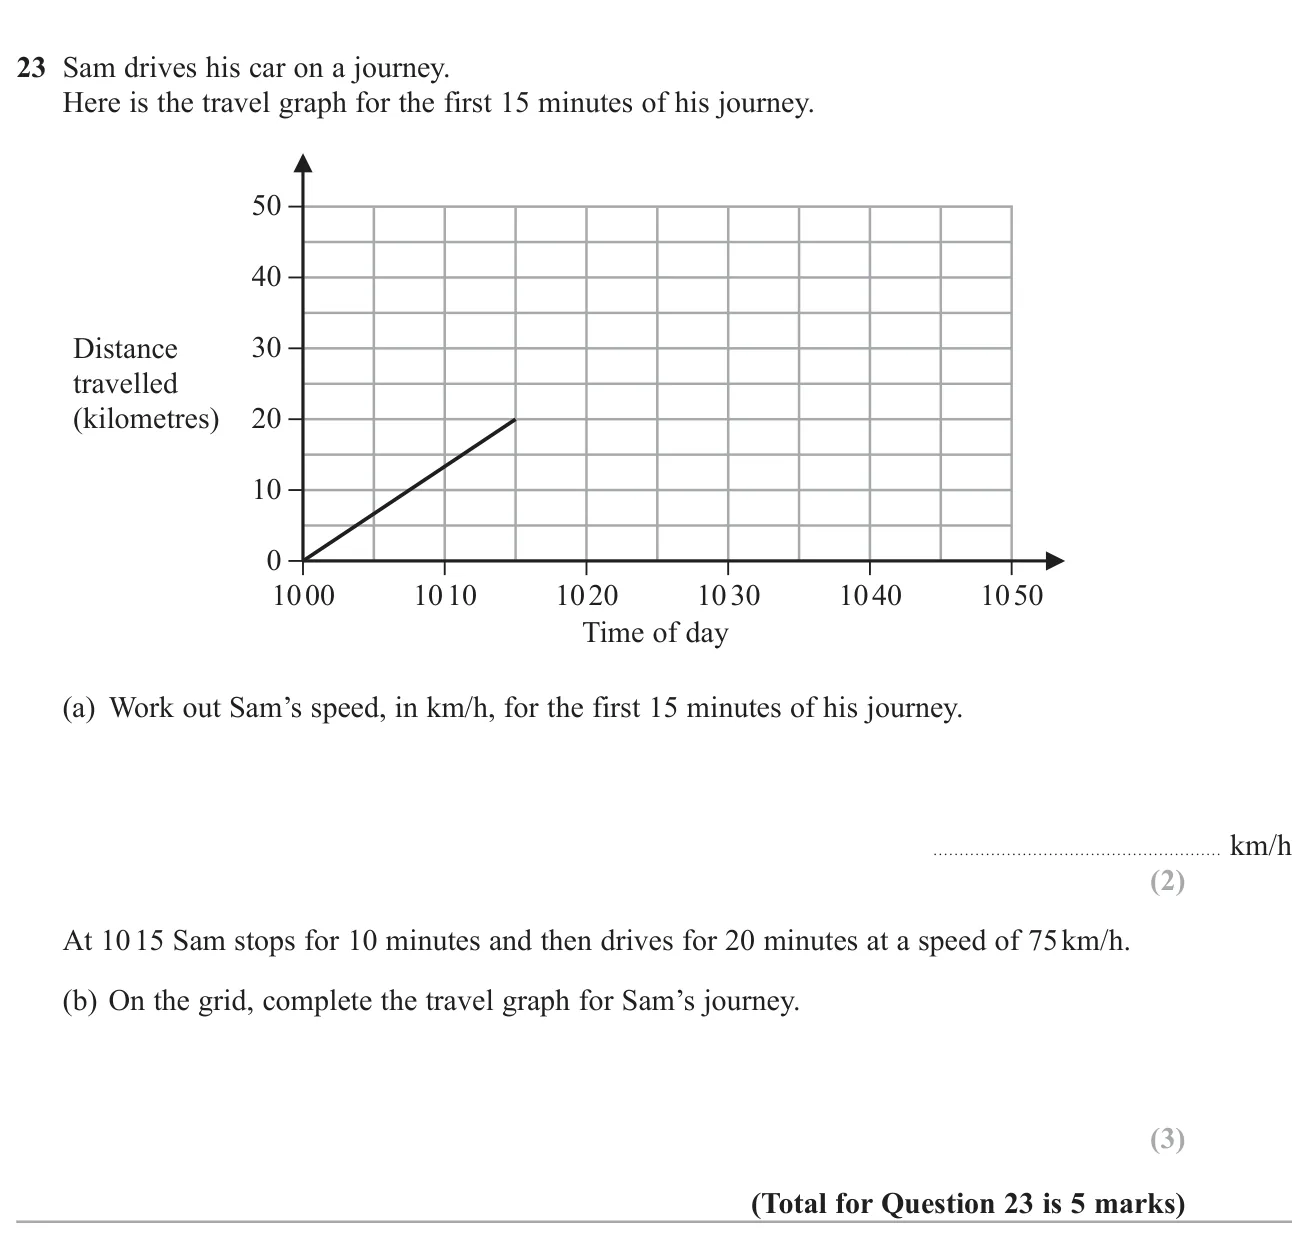
© Pearson Education Ltd. November 2021 Paper 2 (Foundation, calculator), question 23.
(a) 80 2 marks (b) Horizontal line from (10 15, 20) to (10 25, 20), then a straight line to (10 45, 45) 3 marks
Worked solution Checked against the mark scheme
(a) 20 km in 15 minutes. There are four lots of 15 minutes in an hour, so 20 × 4 = 80 20 \times 4 = 80 20 × 4 = 80
(b) Stop: flat line at 20 km from 10 15 to 10 25.
In 20 minutes at 75 km/h: 75 × 20 60 = 25 75 \times \frac{20}{60} = 25 75 × 60 20 = 25
Draw a line from (10 25, 20) to (10 45, 45).
Watch out: Using 20 minutes as 0.2 hours.
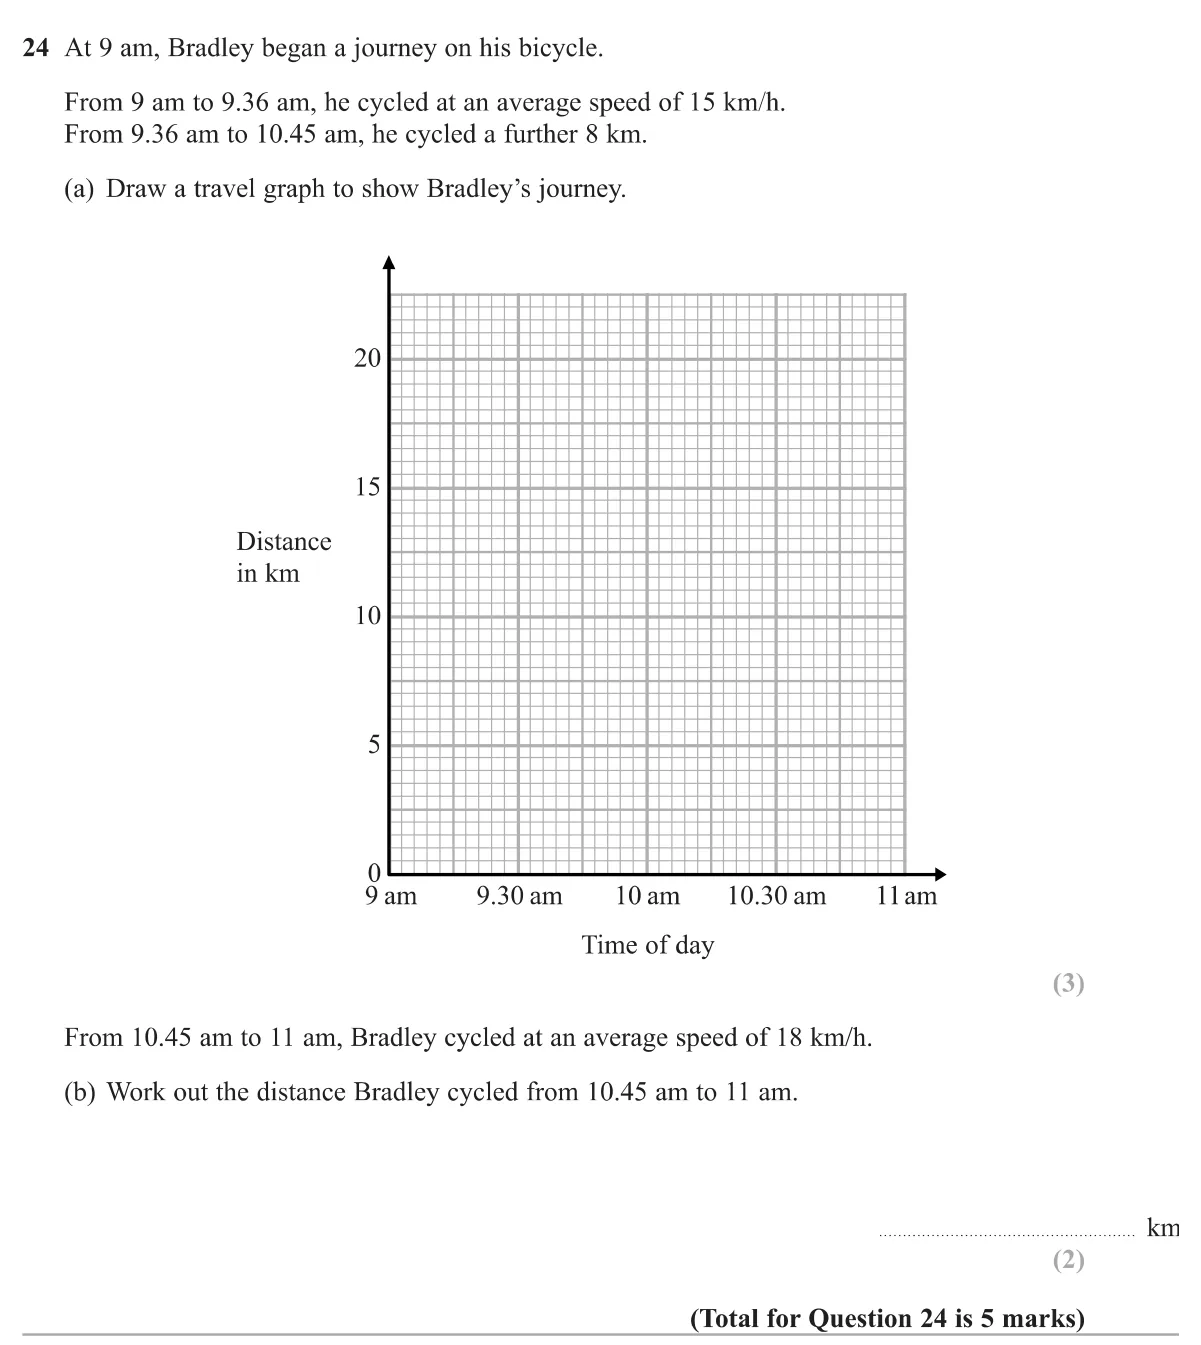
© Pearson Education Ltd. Specimen Paper 2 (Foundation, calculator), question 24.
(a) Line from (9 am, 0) to (9.36 am, 9 km), then to (10.45 am, 17 km) 3 marks (b) 4.5 km 2 marks
Worked solution Checked against the mark scheme
(a) 36 minutes = 0.6 = 0.6 = 0.6 = 15 × 0.6 = 9 = 15 \times 0.6 = 9 = 15 × 0.6 = 9
Plot (9 am, 0) to (9.36 am, 9), then on to (10.45 am, 17).
(b) 15 minutes = 0.25 = 0.25 = 0.25
Distance = 18 × 0.25 = 4.5 = 18 \times 0.25 = 4.5 = 18 × 0.25 = 4.5
Watch out: Using 0.36 hours for 36 minutes.
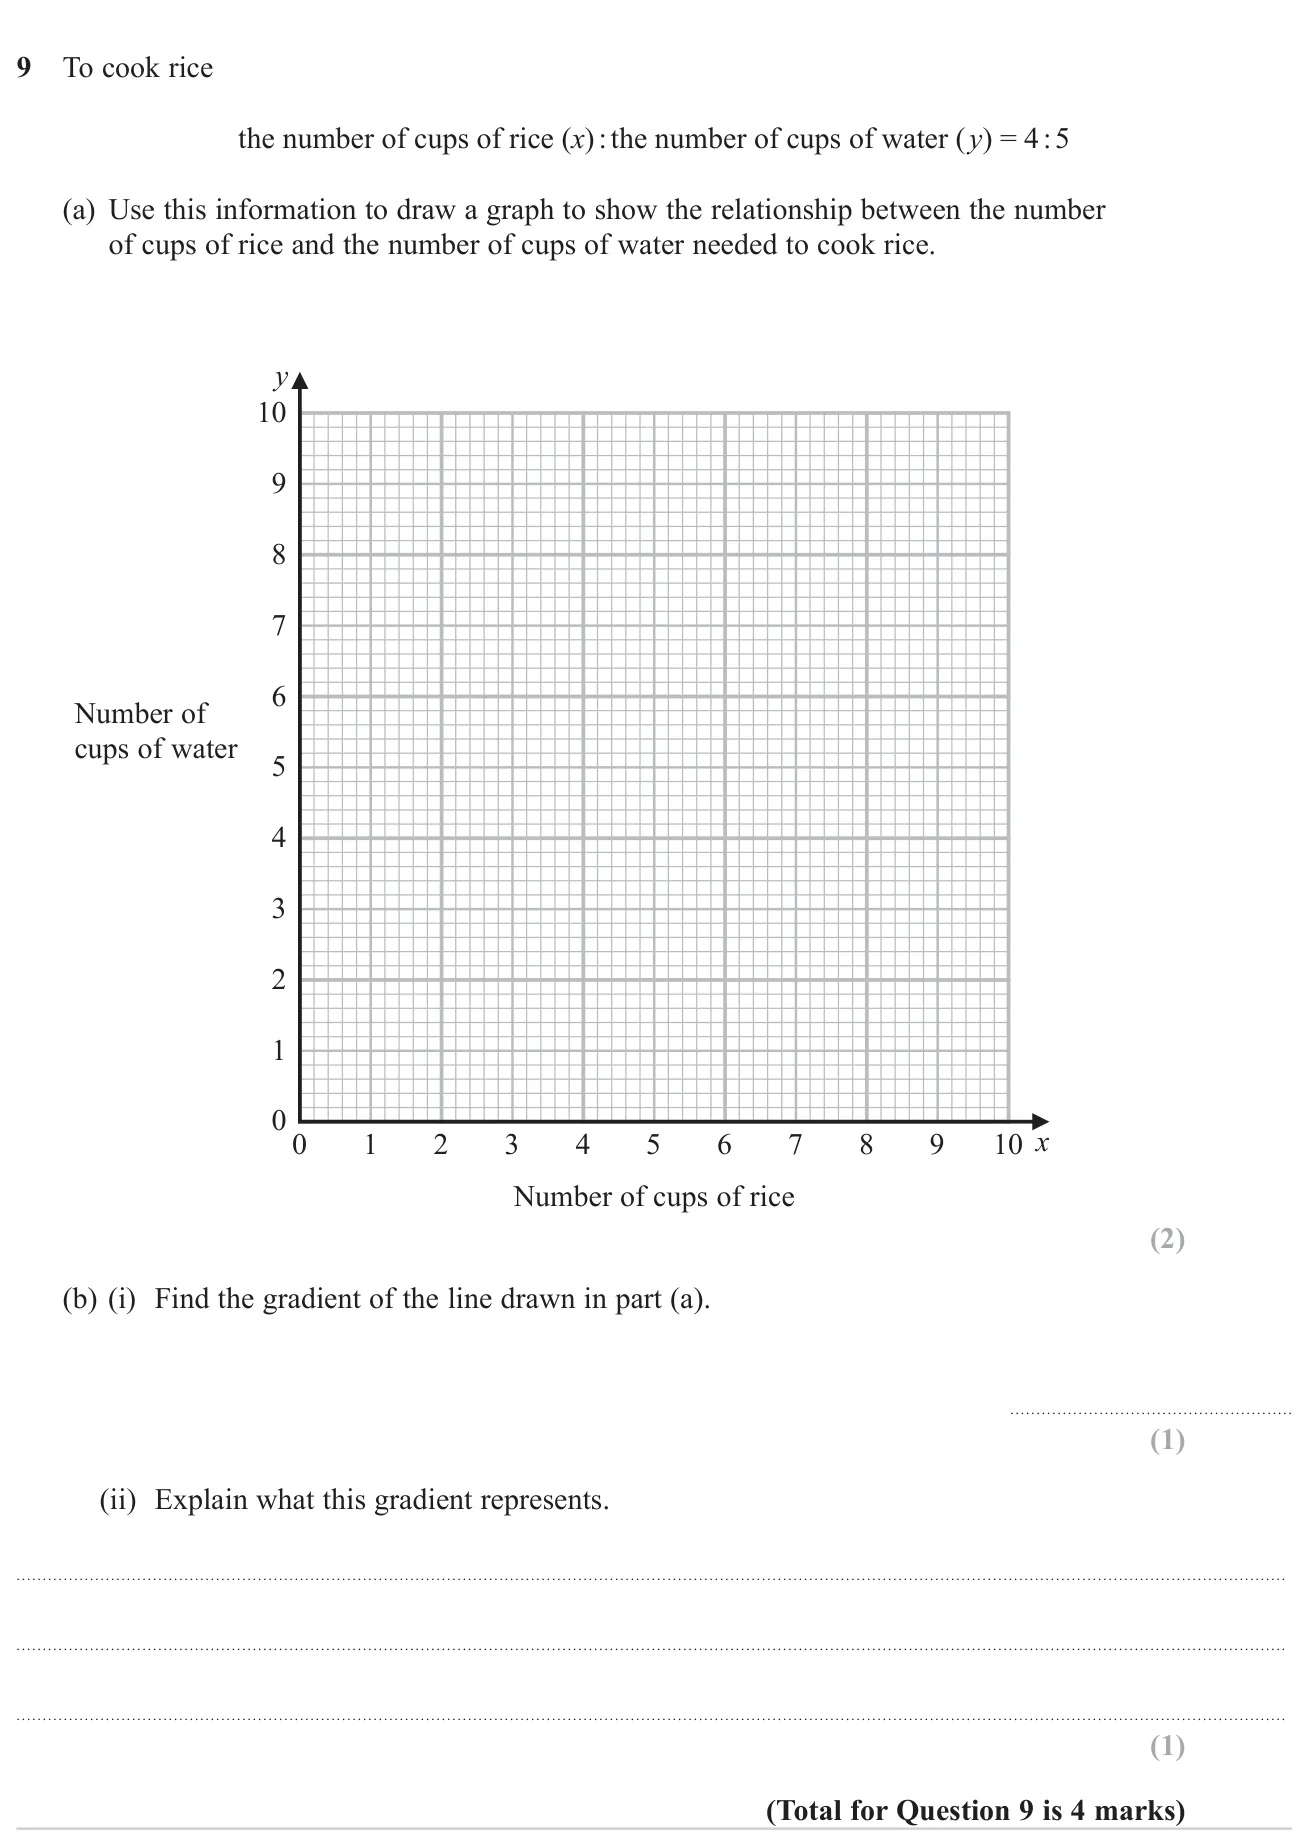
© Pearson Education Ltd. November 2023 Paper 1 (Higher, non-calculator), question 9.
(a) Straight line through ( 0 , 0 ) (0, 0) ( 0 , 0 ) ( 4 , 5 ) (4, 5) ( 4 , 5 ) ( 8 , 10 ) (8, 10) ( 8 , 10 ) 2 marks (b(i)) 1.25 1.25 1.25 1 mark (b(ii)) The number of cups of water needed for each cup of rice 1 mark
Worked solution Checked against the mark scheme
(a) 4 cups of rice need 5 cups of water, and 0 need 0. Plot ( 0 , 0 ) (0, 0) ( 0 , 0 ) ( 4 , 5 ) (4, 5) ( 4 , 5 ) ( 8 , 10 ) (8, 10) ( 8 , 10 )
(b)(i) Gradient = rise run = 5 4 = 1.25 = \frac{\text{rise}}{\text{run}} = \frac{5}{4} = 1.25 = run rise = 4 5 = 1.25
(b)(ii) It is the number of cups of water used for every cup of rice.
Watch out: Interpreting the gradient the wrong way round (cups of rice per cup of water).
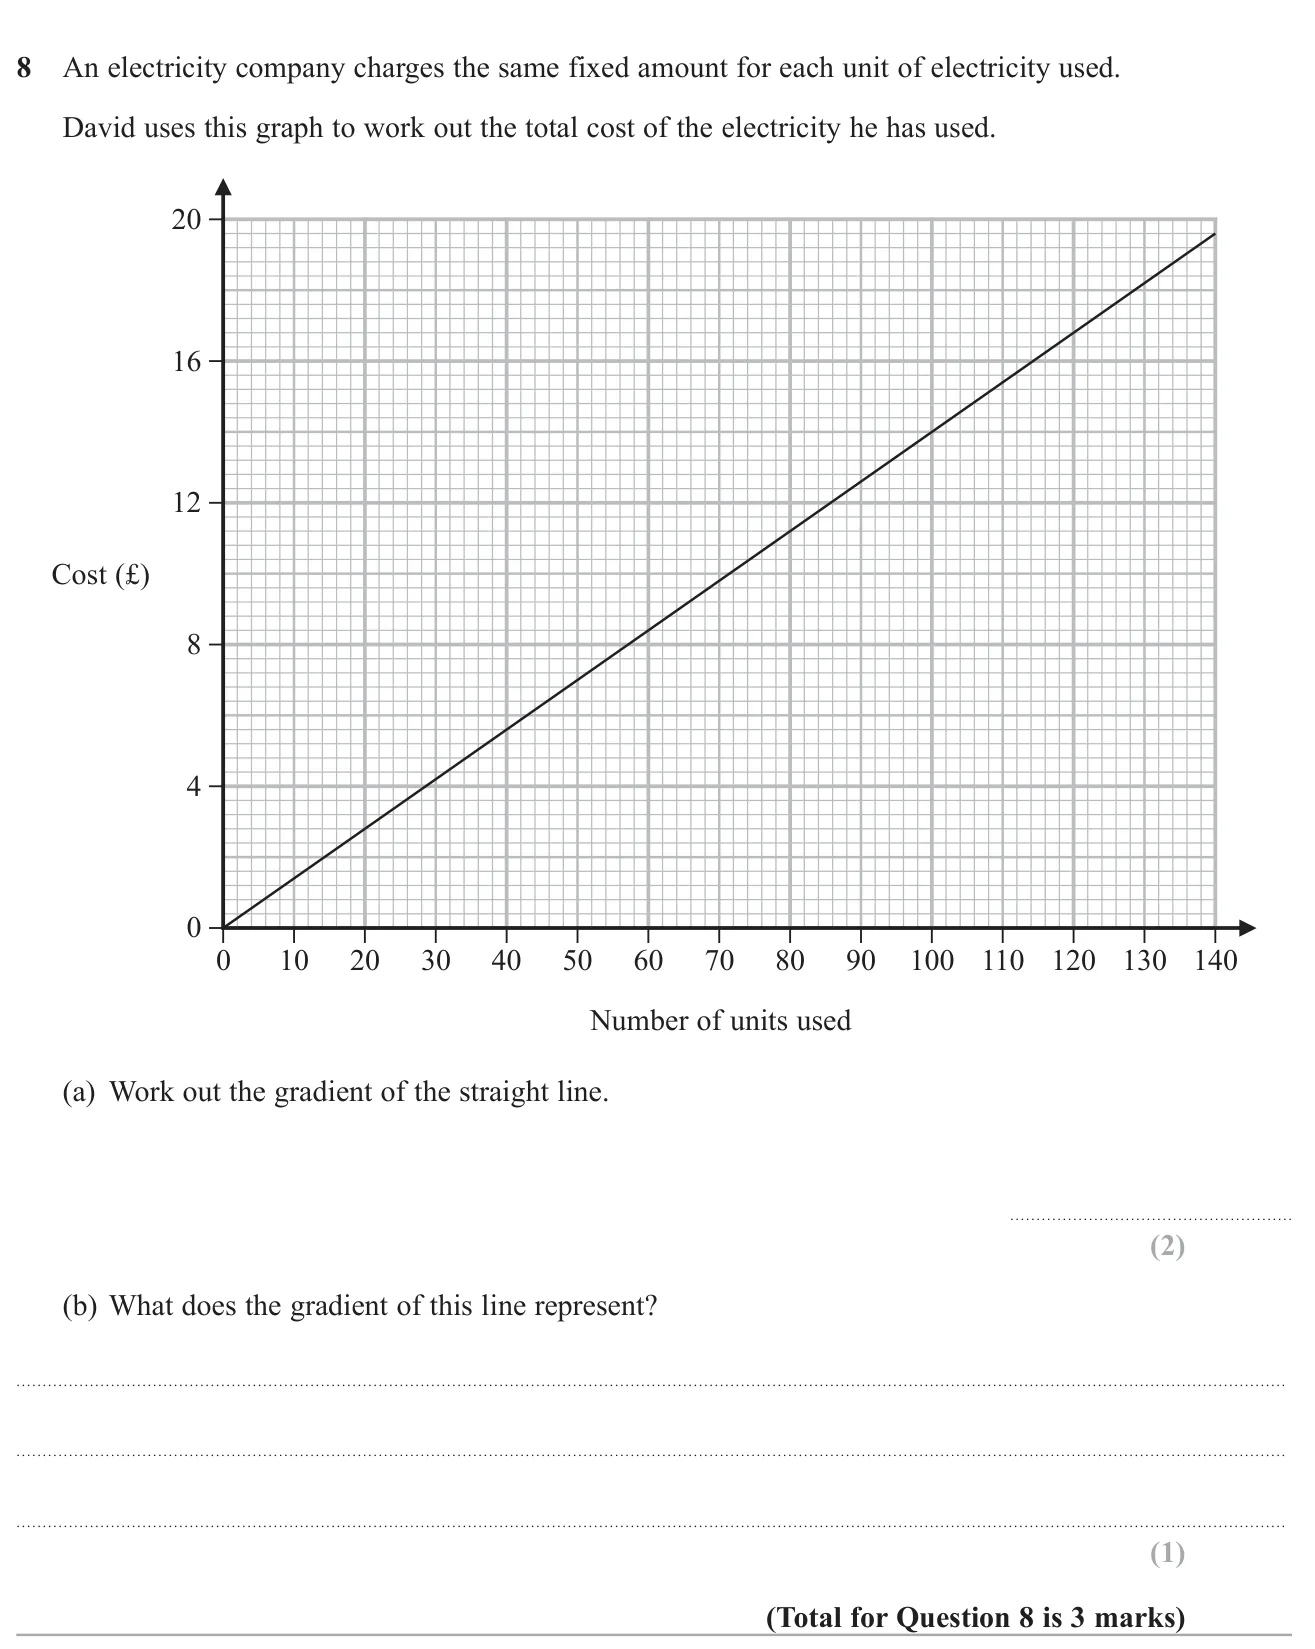
© Pearson Education Ltd. June 2022 Paper 3 (Higher, calculator), question 8.
(a) 0.14 0.14 0.14 2 marks (b) The cost of each unit of electricity (£0.14, i.e. 14p per unit) 1 mark
Worked solution Checked against the mark scheme
(a) The line passes through ( 0 , 0 ) (0, 0) ( 0 , 0 ) ( 100 , 14 ) (100, 14) ( 100 , 14 )
Gradient = 14 100 = 0.14 = \frac{14}{100} = 0.14 = 100 14 = 0.14
(b) The gradient is pounds per unit, so it is the price of one unit of electricity: 14p.
Watch out: In (b), saying only that it shows how steep the line is, without linking it to cost per unit.
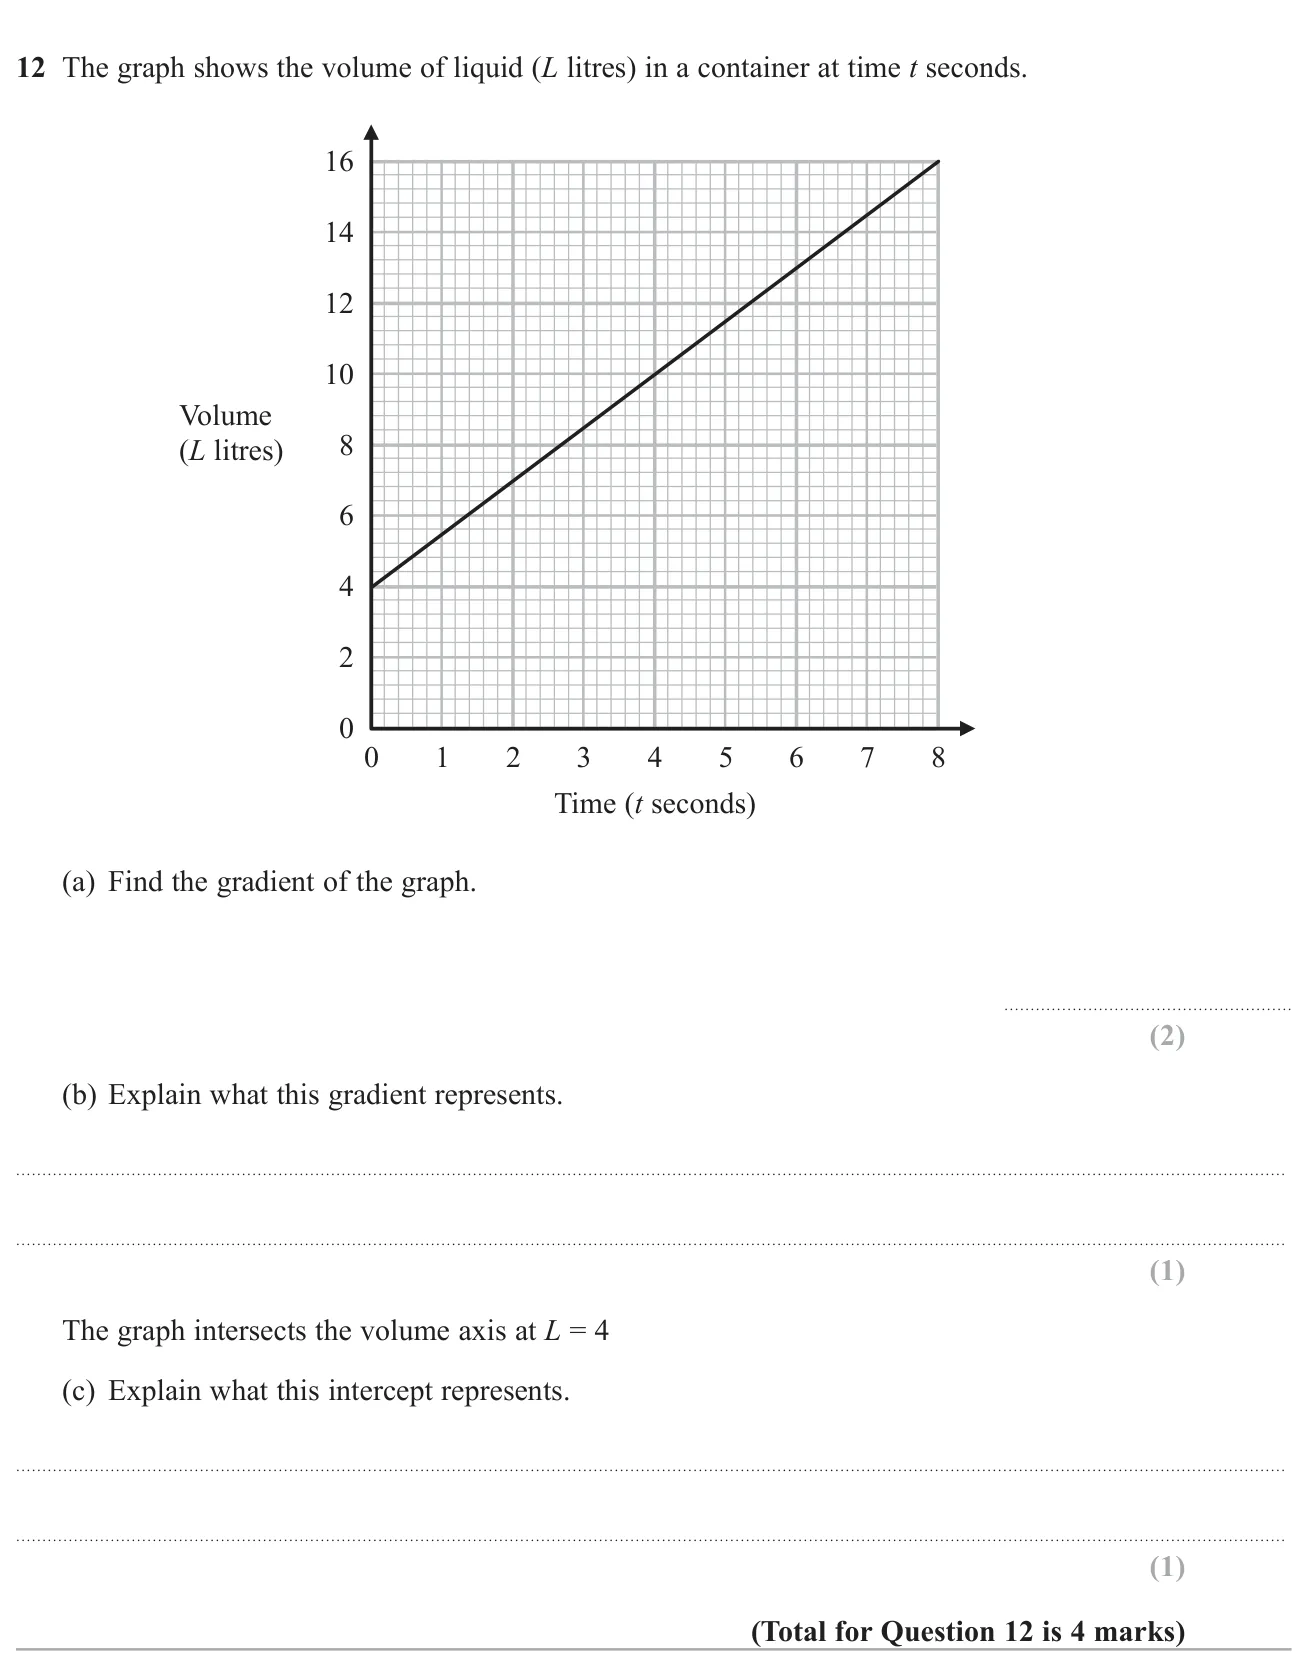
© Pearson Education Ltd. June 2018 Paper 3 (Higher, calculator), question 12.
(a) 1.5 2 marks (b) The rate at which liquid goes into the container (litres per second) 1 mark (c) The volume of liquid in the container at the start (t = 0 t = 0 t = 0 1 mark
Worked solution Checked against the mark scheme
(a) From ( 0 , 4 ) (0, 4) ( 0 , 4 ) ( 8 , 16 ) (8, 16) ( 8 , 16 ) = 16 − 4 8 − 0 = 12 8 = 1.5 = \frac{16-4}{8-0} = \frac{12}{8} = 1.5 = 8 − 0 16 − 4 = 8 12 = 1.5
(b) The volume rises 1.5 litres every second, so the gradient is the rate the container fills, in litres per second.
(c) At t = 0 t = 0 t = 0
Watch out: Counting grid squares instead of using the axis scales.
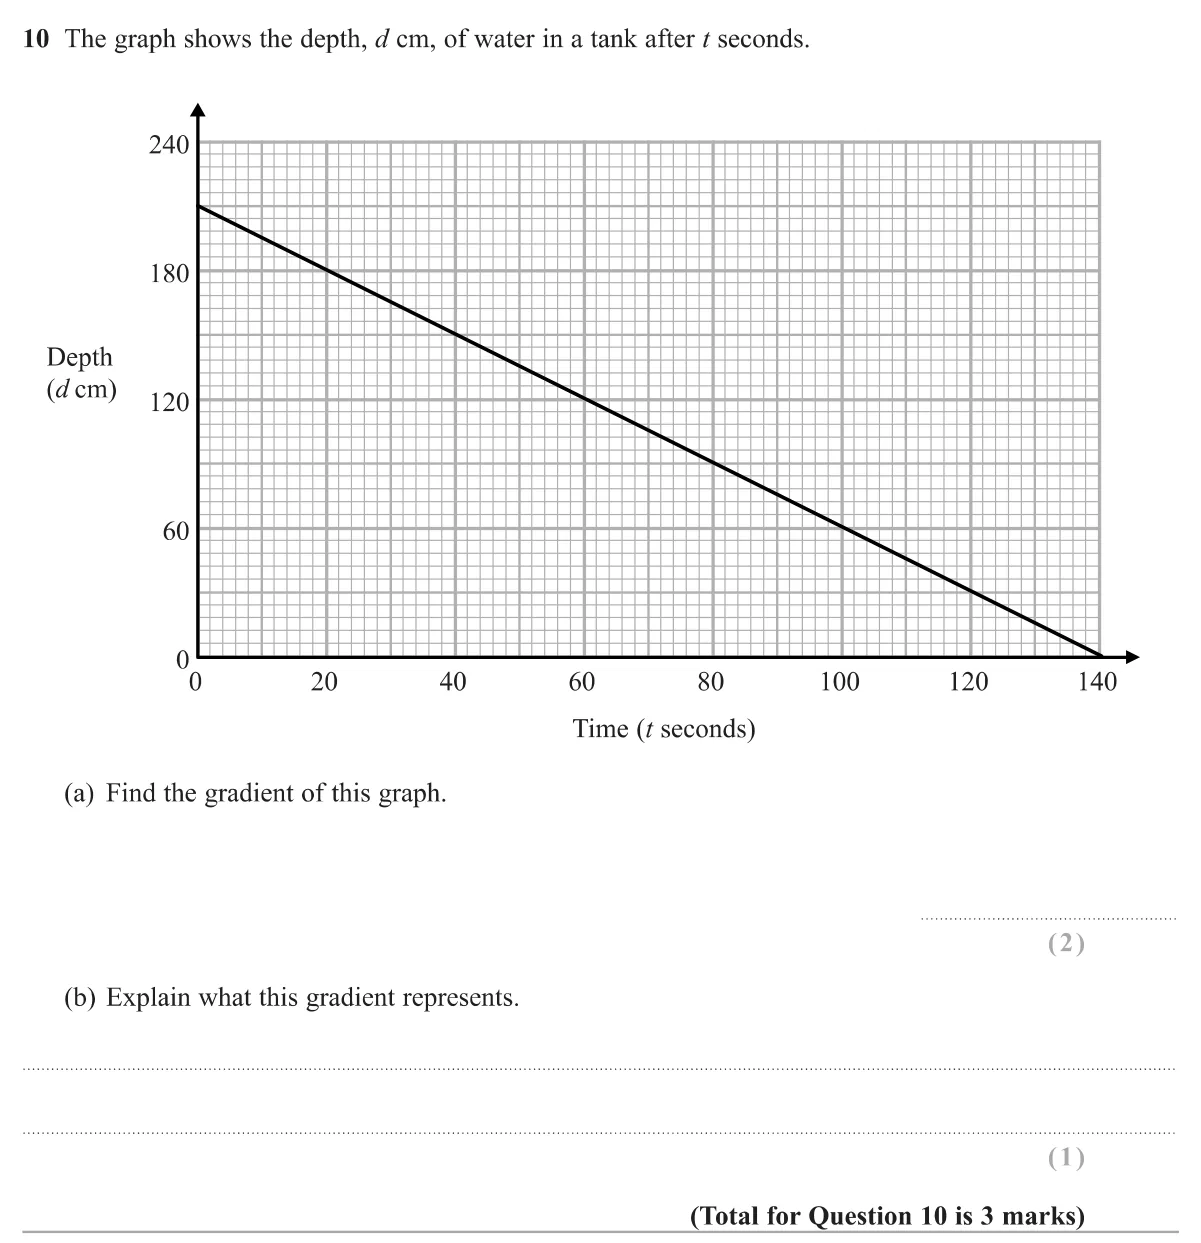
© Pearson Education Ltd. Specimen Paper 2 (Higher, calculator), question 10.
(a) − 1.5 -1.5 − 1.5 2 marks (b) The rate at which the depth of water falls: 1.5 cm per second 1 mark
Worked solution Checked against the mark scheme
(a) The line goes from (0, 210) to (140, 0).
Gradient = 0 − 210 140 − 0 = − 1.5 = \frac{0 - 210}{140 - 0} = -1.5 = 140 − 0 0 − 210 = − 1.5
(b) The depth of water goes down by 1.5 cm every second: it is the rate the tank is emptying.
Watch out: Giving 1.5 without the minus sign.
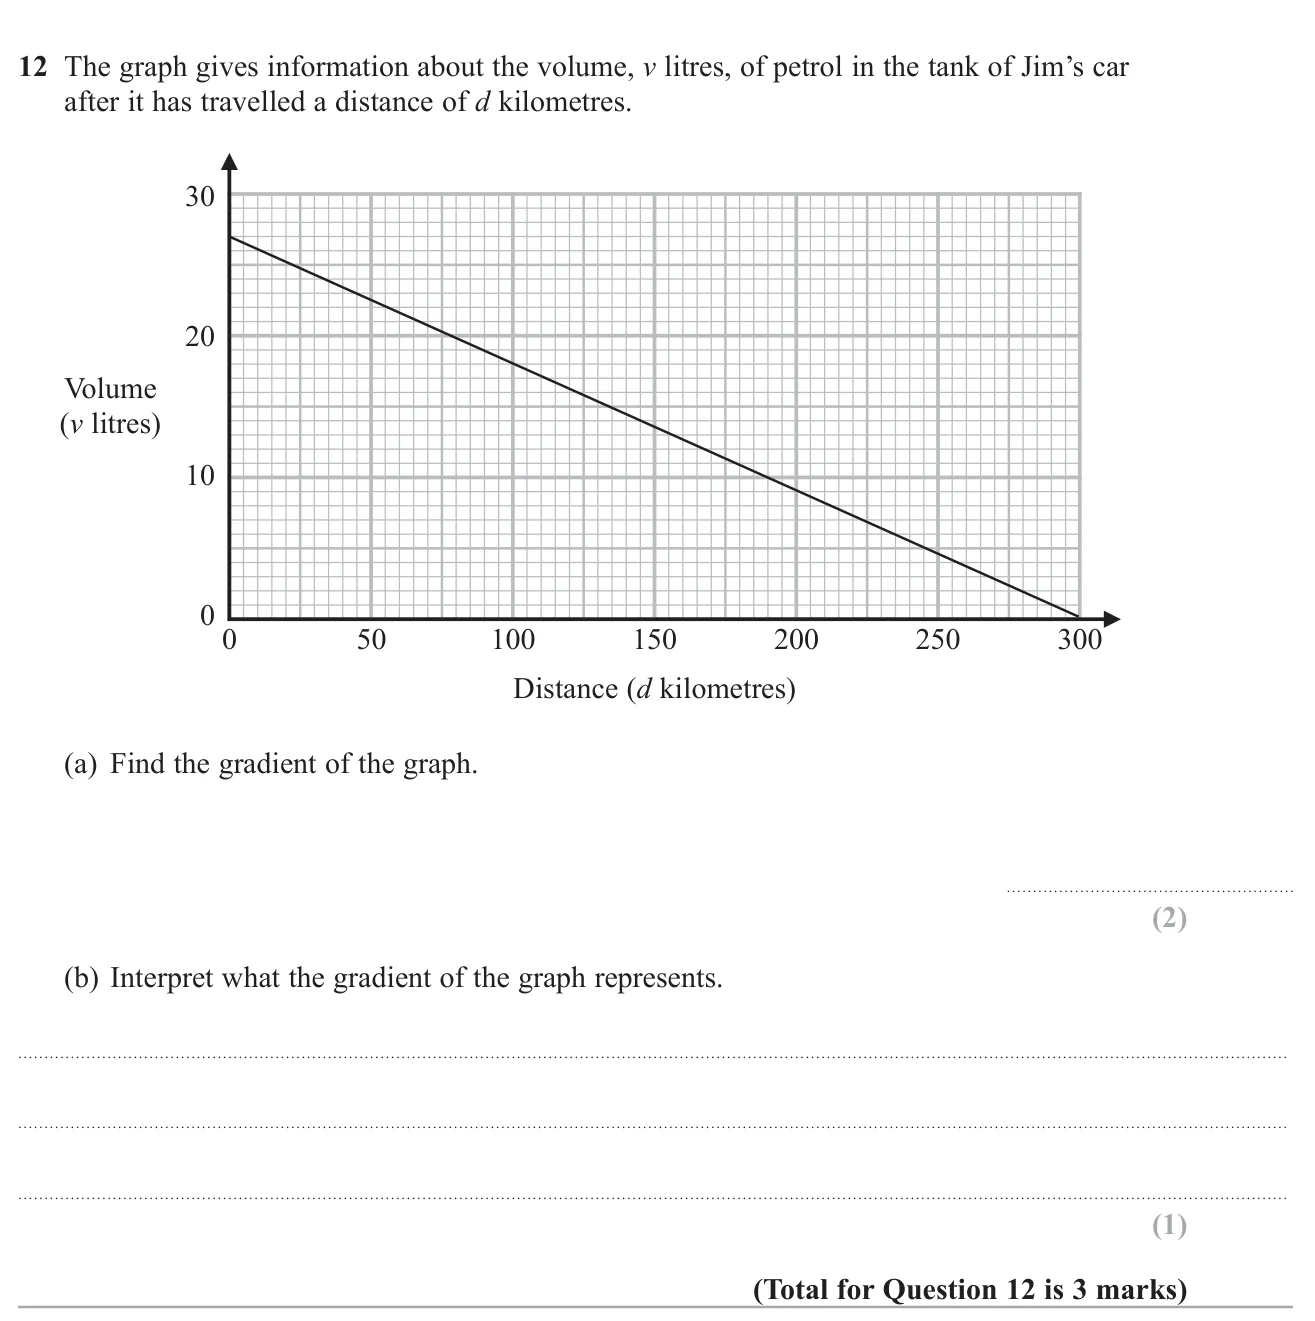
© Pearson Education Ltd. November 2020 Paper 2 (Higher, calculator), question 12.
(a) − 0.09 -0.09 − 0.09 2 marks (b) The petrol used per kilometre travelled (0.09 litres per km) 1 mark
Worked solution Checked against the mark scheme
(a) The line starts at 27 litres when d = 0 d = 0 d = 0 d = 300 d = 300 d = 300
Gradient = 0 − 27 300 − 0 = − 0.09 = \frac{0 - 27}{300 - 0} = -0.09 = 300 − 0 0 − 27 = − 0.09
(b) The car uses 0.09 litres of petrol for each kilometre it travels (the rate of fuel consumption).
Watch out: Leaving out the negative sign, or writing the gradient as distance over volume.
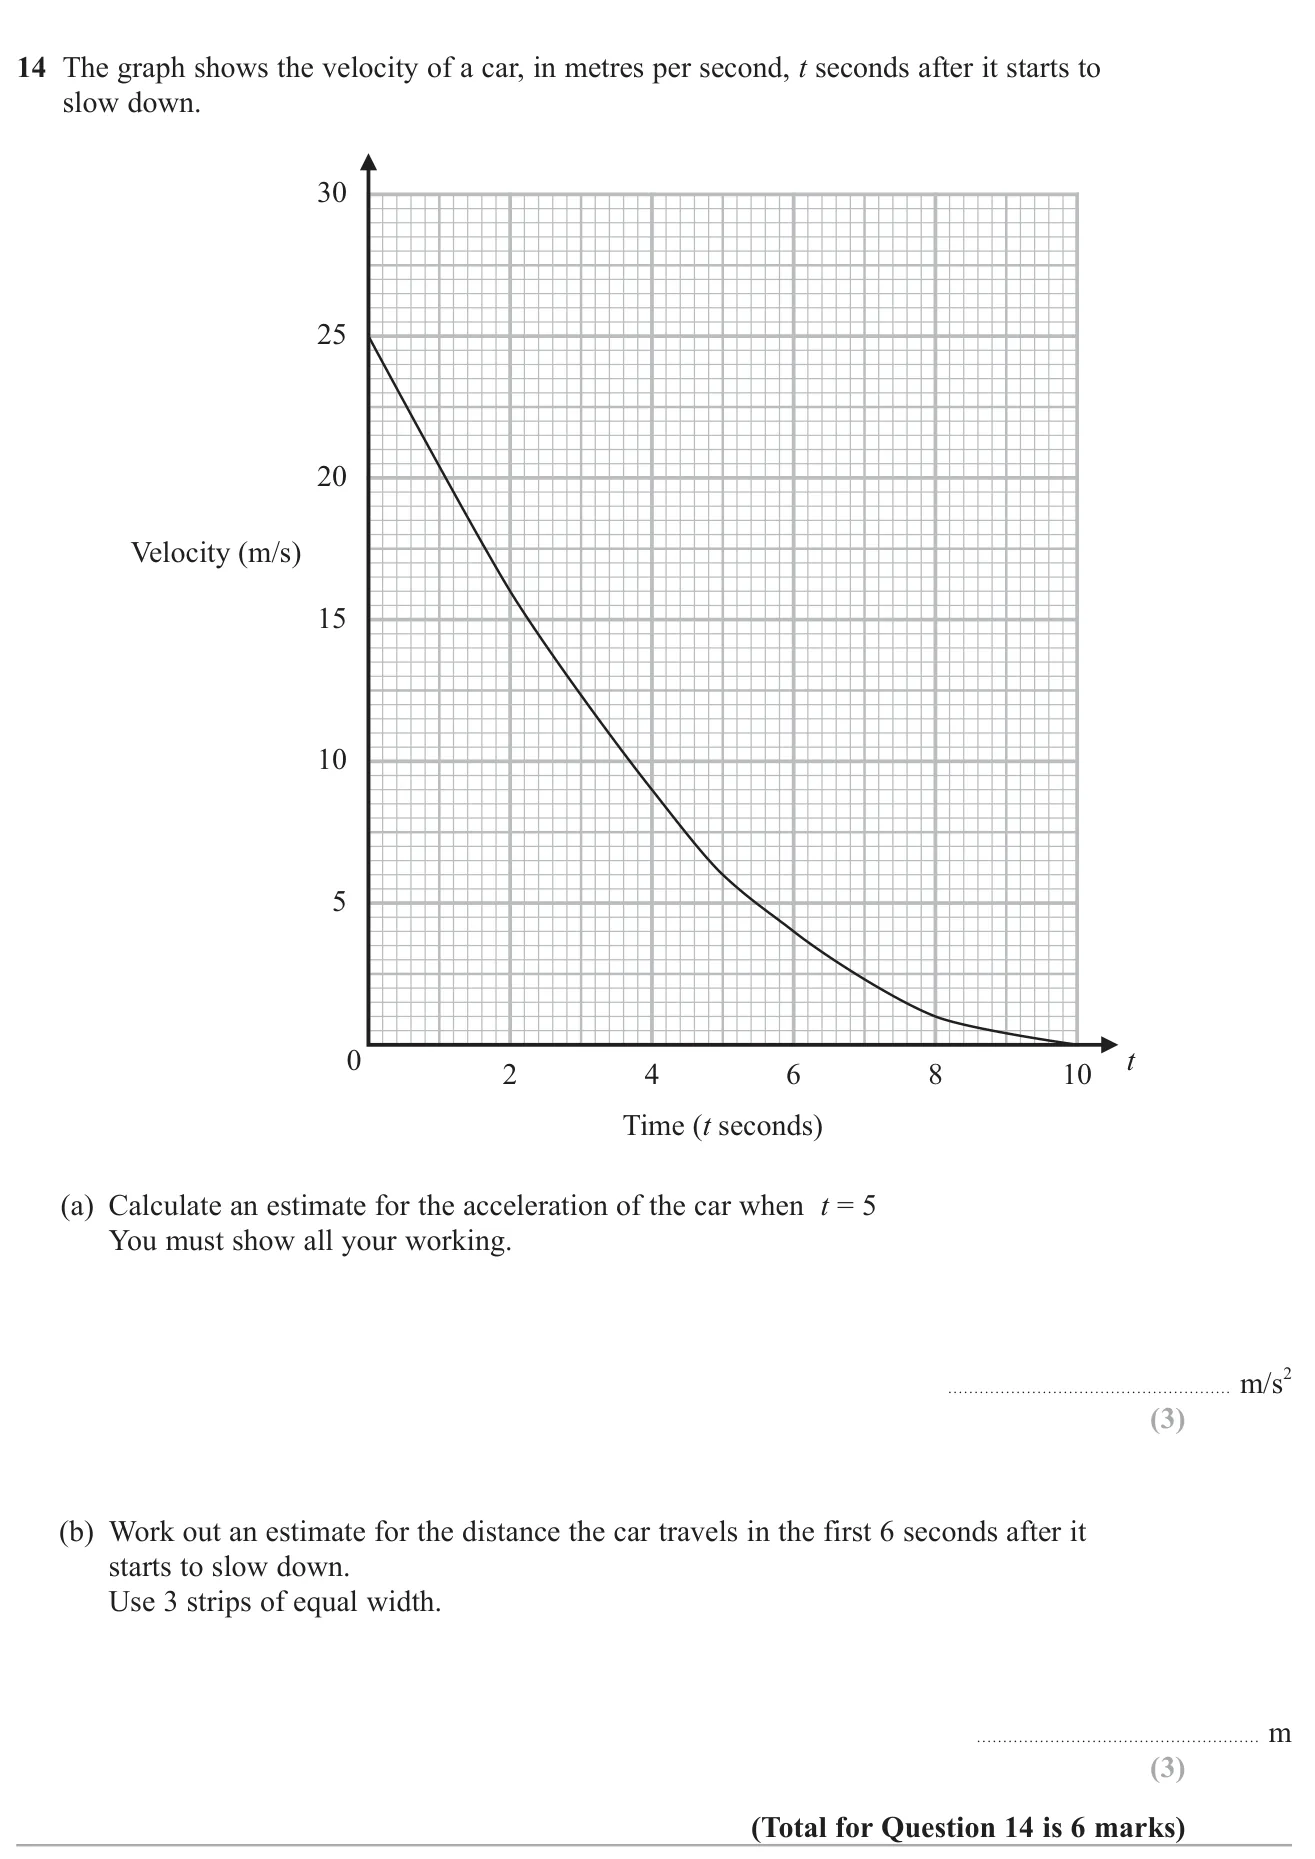
© Pearson Education Ltd. June 2024 Paper 2 (Higher, calculator), question 14.
(a) About − 2.5 -2.5 − 2.5 − 2.0 -2.0 − 2.0 − 2.8 -2.8 − 2.8 3 marks (b) 79 79 79 3 marks
Worked solution Checked against the mark scheme
(a) Draw a tangent to the curve at t = 5 t = 5 t = 5 ≈ − 10 ÷ 4 = − 2.5 \approx -10 \div 4 = -2.5 ≈ − 10 ÷ 4 = − 2.5
(b) Readings: v ( 0 ) = 25 , v ( 2 ) = 16 , v ( 4 ) = 9 , v ( 6 ) = 4 v(0)=25, v(2)=16, v(4)=9, v(6)=4 v ( 0 ) = 25 , v ( 2 ) = 16 , v ( 4 ) = 9 , v ( 6 ) = 4
1 2 × 2 × ( 25 + 16 ) + 1 2 × 2 × ( 16 + 9 ) + 1 2 × 2 × ( 9 + 4 ) = 41 + 25 + 13 = 79 \frac12 \times 2 \times (25+16) + \frac12 \times 2 \times (16+9) + \frac12 \times 2 \times (9+4) = 41 + 25 + 13 = 79 2 1 × 2 × ( 25 + 16 ) + 2 1 × 2 × ( 16 + 9 ) + 2 1 × 2 × ( 9 + 4 ) = 41 + 25 + 13 = 79
Watch out: Joining two points on the curve (a chord) instead of drawing a tangent, or forgetting the negative sign for deceleration.
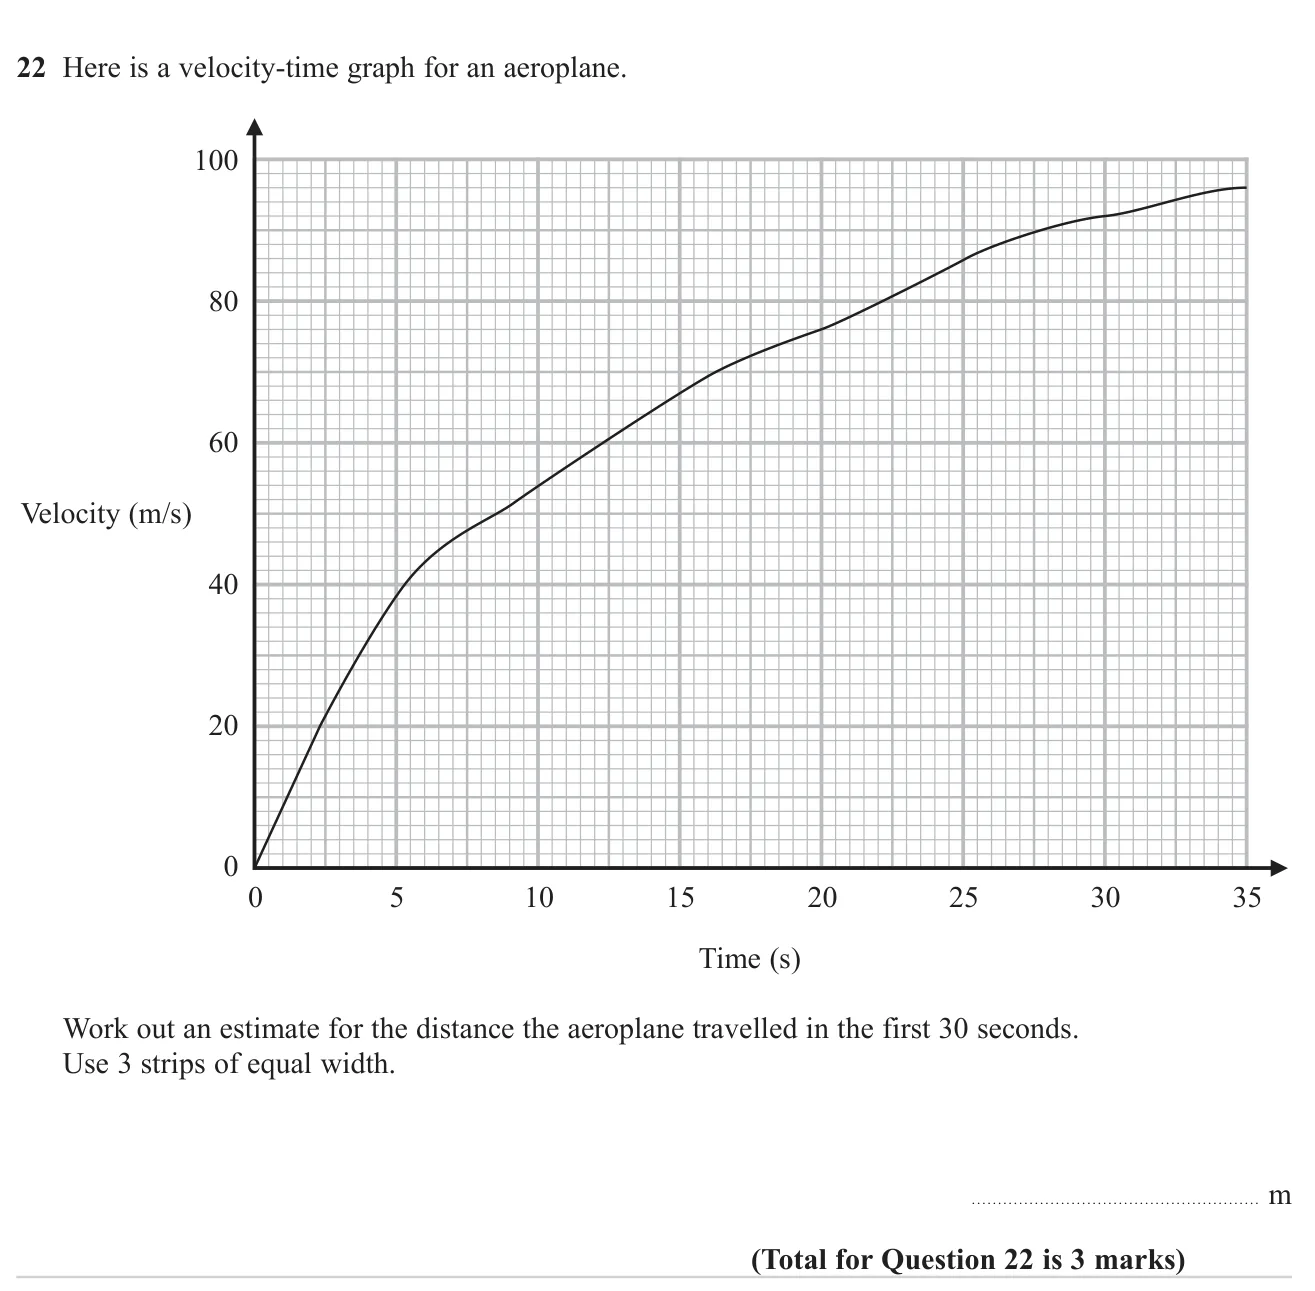
© Pearson Education Ltd. November 2024 Paper 3 (Higher, calculator), question 22.
Answer 1760 1760 1760 3 marks
Worked solution Checked against the mark scheme
Split 0–30 s into strips of width 10. Read velocities: 0, 54, 76, 92 m/s.
Triangle: 1 2 × 10 × 54 = 270 \frac{1}{2} \times 10 \times 54 = 270 2 1 × 10 × 54 = 270
Trapezium: 1 2 × 10 × ( 54 + 76 ) = 650 \frac{1}{2} \times 10 \times (54 + 76) = 650 2 1 × 10 × ( 54 + 76 ) = 650
Trapezium: 1 2 × 10 × ( 76 + 92 ) = 840 \frac{1}{2} \times 10 \times (76 + 92) = 840 2 1 × 10 × ( 76 + 92 ) = 840
Distance ≈ 270 + 650 + 840 = 1760 \approx 270 + 650 + 840 = 1760 ≈ 270 + 650 + 840 = 1760
Watch out: Using strips of width 5 or reading the graph at the wrong times.
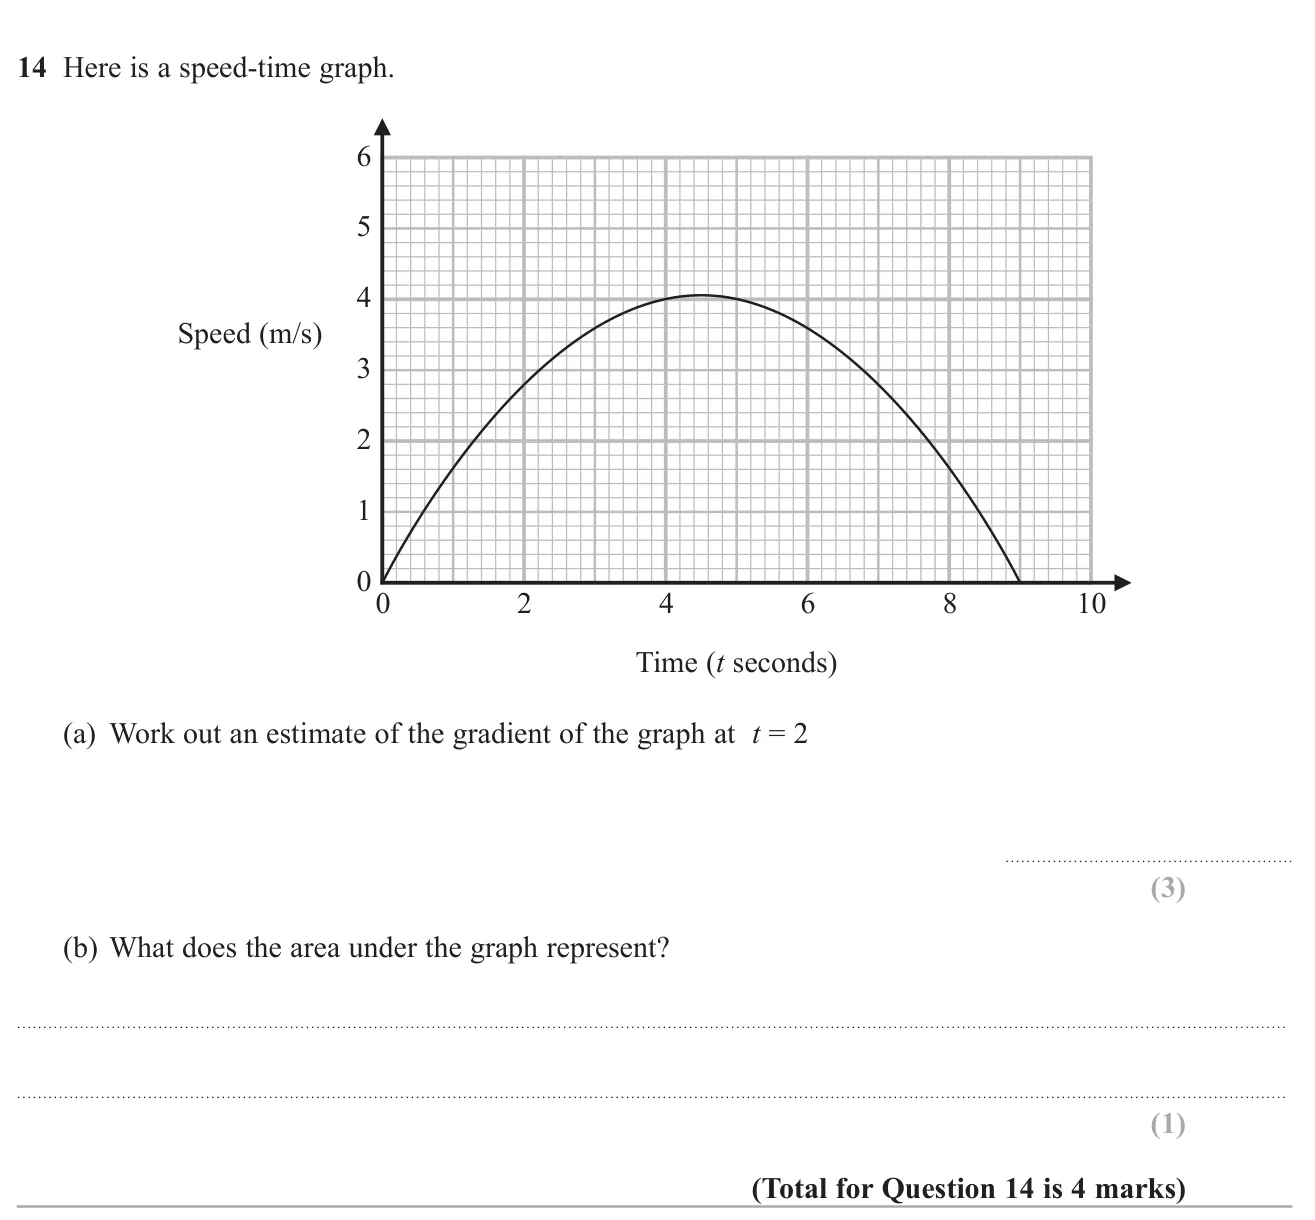
© Pearson Education Ltd. June 2022 Paper 1 (Higher, non-calculator), question 14.
(a) About 0.9 (0.7 to 1.1) 3 marks (b) The distance travelled 1 mark
Worked solution Checked against the mark scheme
(a) Draw a tangent touching the curve at t = 2 t = 2 t = 2 ( 0 , 1 ) (0, 1) ( 0 , 1 ) ( 3 , 3.7 ) (3, 3.7) ( 3 , 3.7 )
Gradient ≈ 3.7 − 1 3 − 0 = 2.7 3 = 0.9 \approx \frac{3.7 - 1}{3 - 0} = \frac{2.7}{3} = 0.9 ≈ 3 − 0 3.7 − 1 = 3 2.7 = 0.9
(b) Area under a speed-time graph gives the distance travelled.
Watch out: Drawing a chord from the origin to the curve instead of a tangent at t = 2.
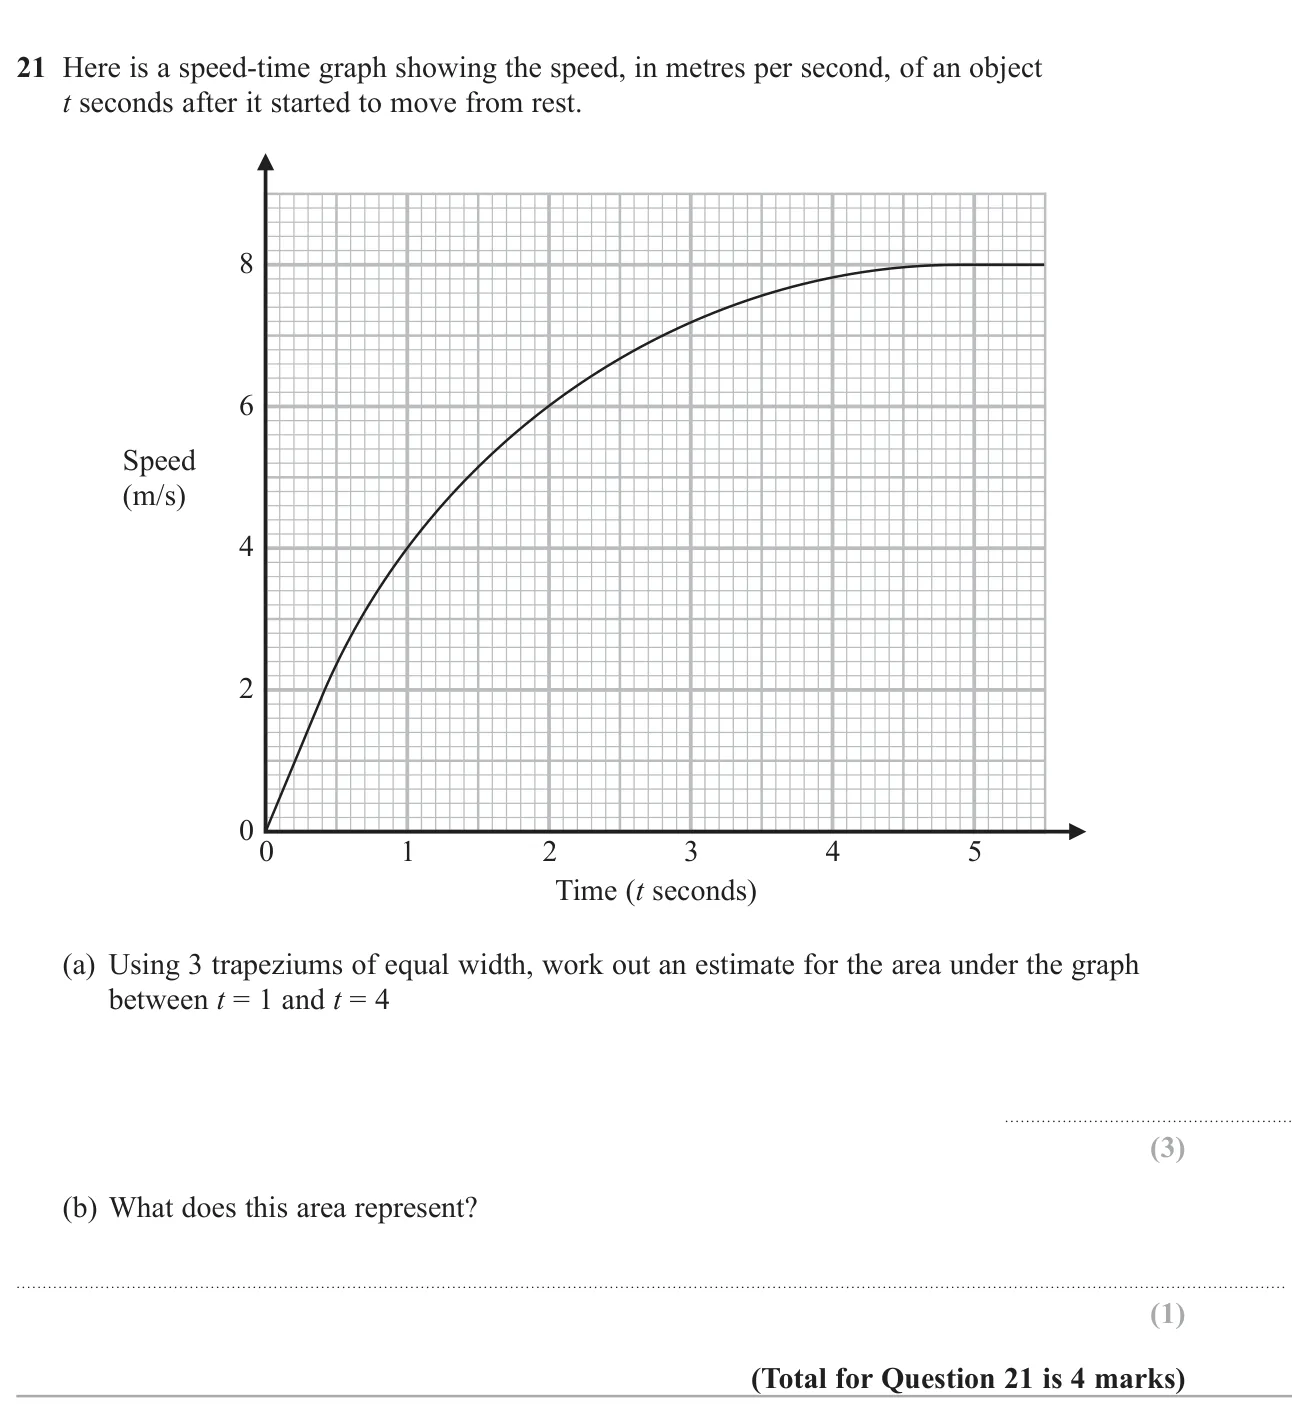
© Pearson Education Ltd. November 2021 Paper 3 (Higher, calculator), question 21.
(a) 19.1 19.1 19.1 3 marks (b) The distance travelled (in metres) between t = 1 t = 1 t = 1 t = 4 t = 4 t = 4 1 mark
Worked solution Checked against the mark scheme
(a) Read the speeds: at t = 1 , 2 , 3 , 4 t = 1, 2, 3, 4 t = 1 , 2 , 3 , 4 4 , 6 , 7.2 , 7.8 4, 6, 7.2, 7.8 4 , 6 , 7.2 , 7.8
1 2 ( 4 + 6 ) + 1 2 ( 6 + 7.2 ) + 1 2 ( 7.2 + 7.8 ) = 5 + 6.6 + 7.5 = 19.1 \frac{1}{2}(4 + 6) + \frac{1}{2}(6 + 7.2) + \frac{1}{2}(7.2 + 7.8) = 5 + 6.6 + 7.5 = 19.1 2 1 ( 4 + 6 ) + 2 1 ( 6 + 7.2 ) + 2 1 ( 7.2 + 7.8 ) = 5 + 6.6 + 7.5 = 19.1
(b) Area under a speed–time graph is the distance travelled, so this is the distance in metres between 1 and 4 seconds.
Watch out: Using widths starting from t = 0 or reading 7.2 as 7.
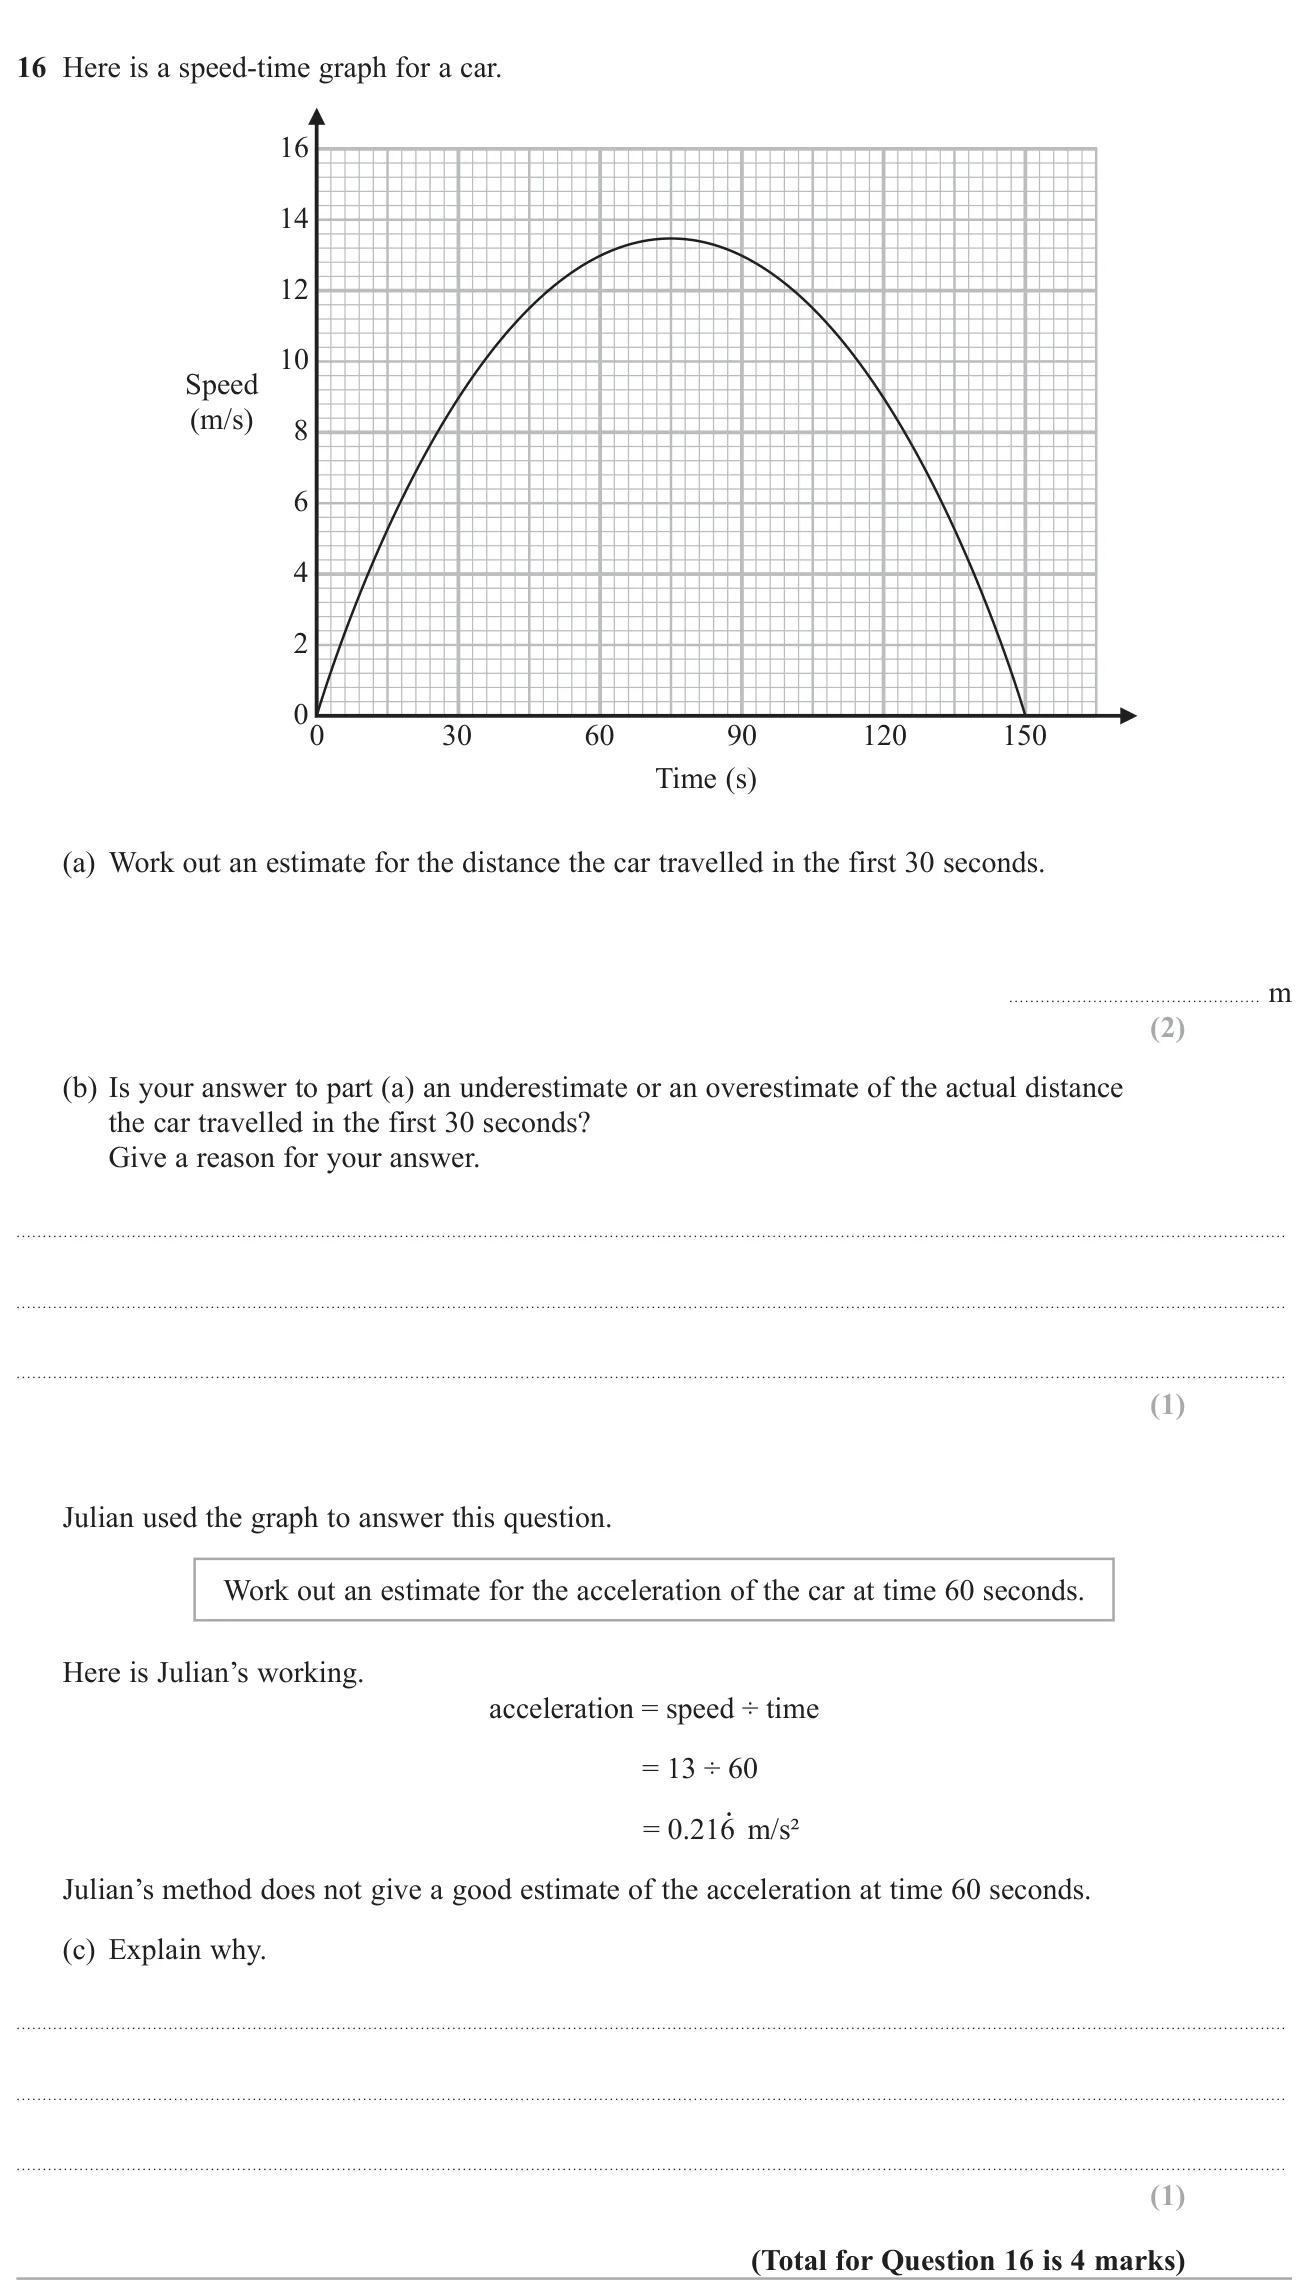
© Pearson Education Ltd. November 2020 Paper 3 (Higher, calculator), question 16.
(a) About 135 135 135 2 marks (b) Underestimate: the curve lies above the straight line, so area is missed 1 mark (c) He found the average acceleration over 60 s; he should draw a tangent at 60 s and find its gradient 1 mark
Worked solution Checked against the mark scheme
(a) At 30 s the speed is about 9 m/s. Treat the area as a triangle: 1 2 × 30 × 9 = 135 \frac{1}{2} \times 30 \times 9 = 135 2 1 × 30 × 9 = 135
(b) The curve bulges above the straight line from ( 0 , 0 ) (0,0) ( 0 , 0 ) ( 30 , 9 ) (30,9) ( 30 , 9 ) underestimate .
(c) Speed ÷ time gives the average acceleration from 0 to 60 s. The acceleration at 60 s is the gradient of the tangent to the curve at that point.
Watch out: Using a rectangle 30 × 9 in (a), which overestimates.
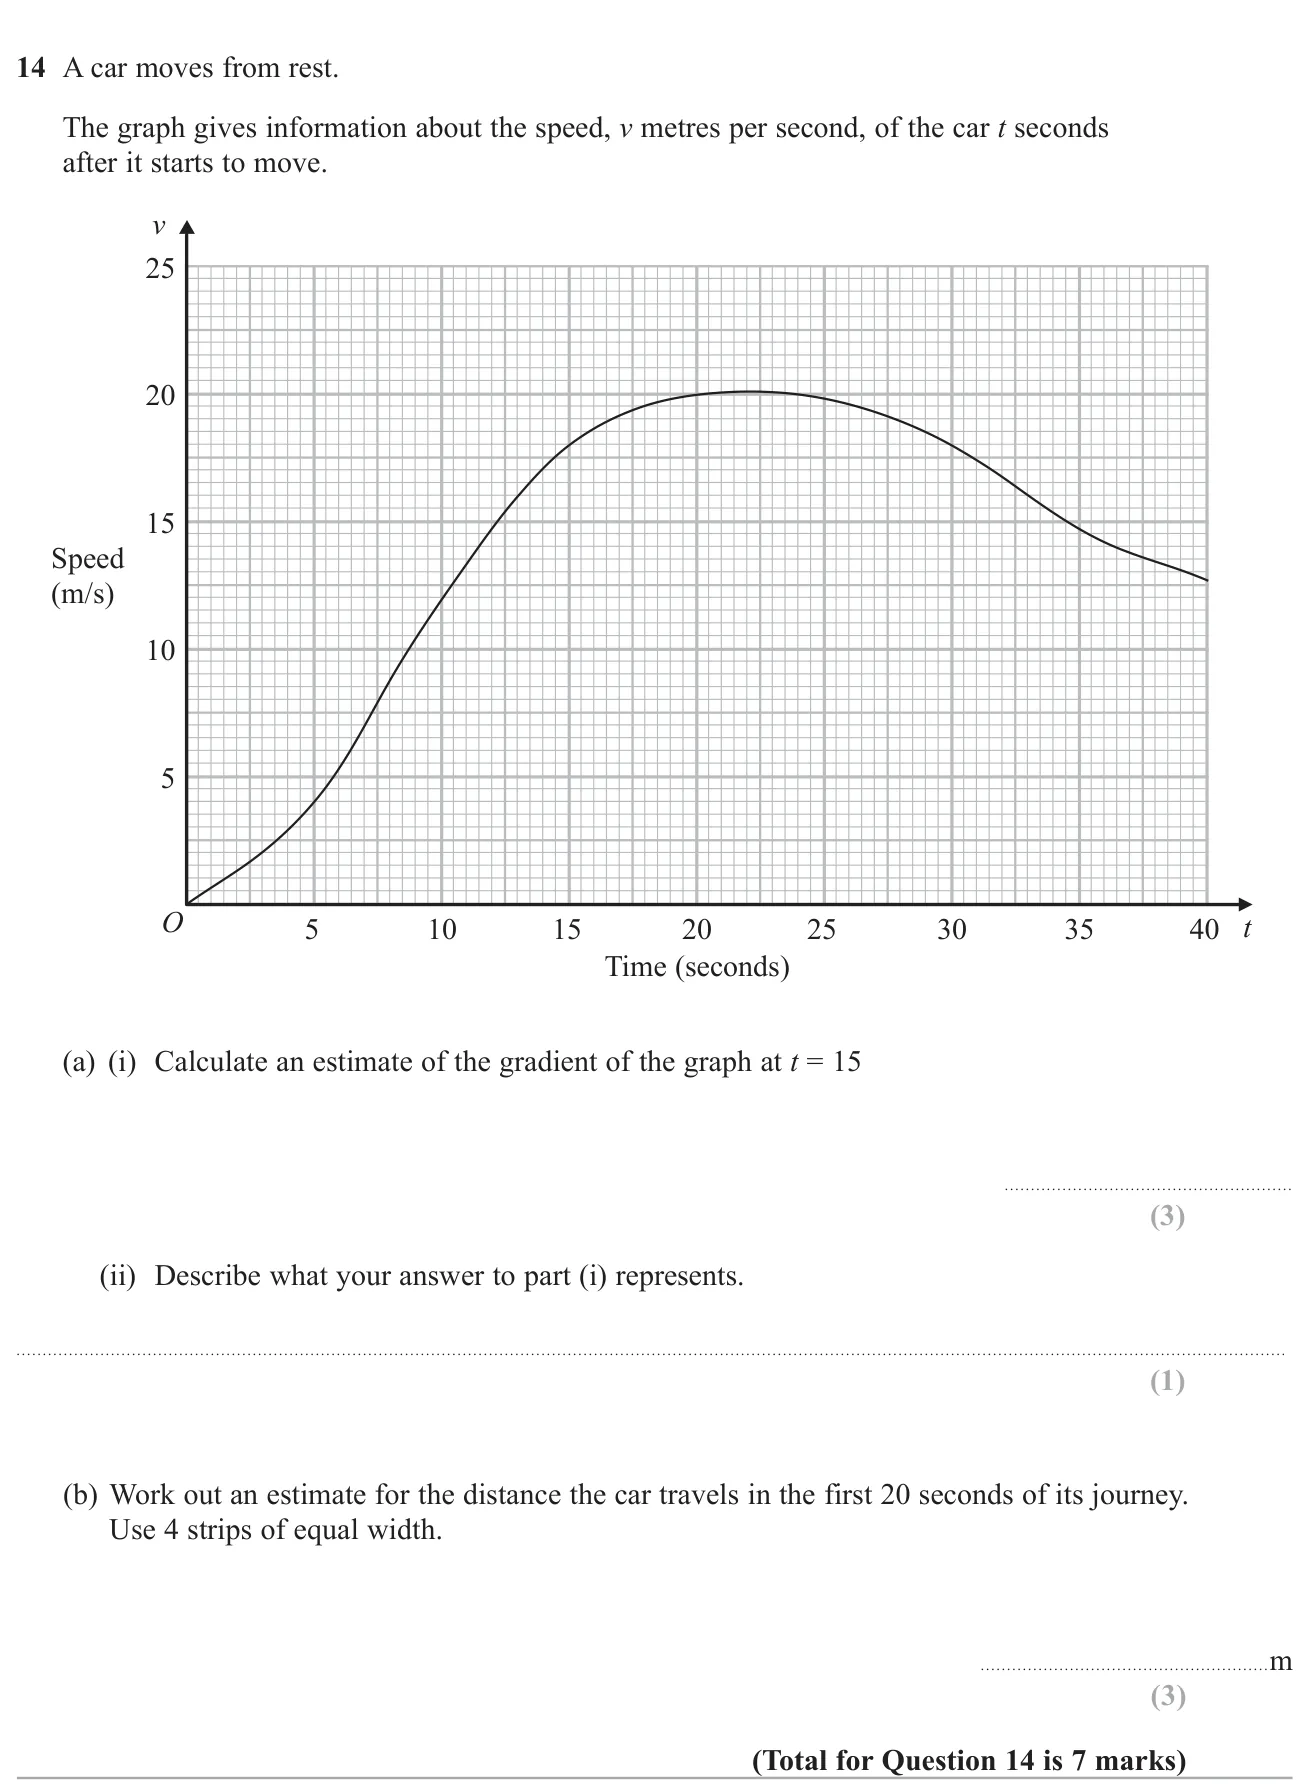
© Pearson Education Ltd. June 2019 Paper 2 (Higher, calculator), question 14.
(a(i)) About 0.83 0.83 0.83 3 marks (a(ii)) The acceleration of the car at 15 seconds (m/s²) 1 mark (b) 220 220 220 3 marks
Worked solution Checked against the mark scheme
(a)(i) Draw a tangent at t = 15 t = 15 t = 15
gradient ≈ 7.5 ÷ 9 = 0.83 \approx 7.5 \div 9 = 0.83 ≈ 7.5 ÷ 9 = 0.83
(ii) This is the car's acceleration in m/s² at 15 seconds.
(b) Speeds at t = 0 , 5 , 10 , 15 , 20 t = 0, 5, 10, 15, 20 t = 0 , 5 , 10 , 15 , 20 0 , 4 , 12 , 18 , 20 0, 4, 12, 18, 20 0 , 4 , 12 , 18 , 20
Area = 5 2 ( 0 + 4 ) + 5 2 ( 4 + 12 ) + 5 2 ( 12 + 18 ) + 5 2 ( 18 + 20 ) = 10 + 40 + 75 + 95 = 220 = \frac{5}{2}(0+4) + \frac{5}{2}(4+12) + \frac{5}{2}(12+18) + \frac{5}{2}(18+20) = 10 + 40 + 75 + 95 = 220 = 2 5 ( 0 + 4 ) + 2 5 ( 4 + 12 ) + 2 5 ( 12 + 18 ) + 2 5 ( 18 + 20 ) = 10 + 40 + 75 + 95 = 220
Watch out: Saying the gradient is just 'rate of change' without naming speed.
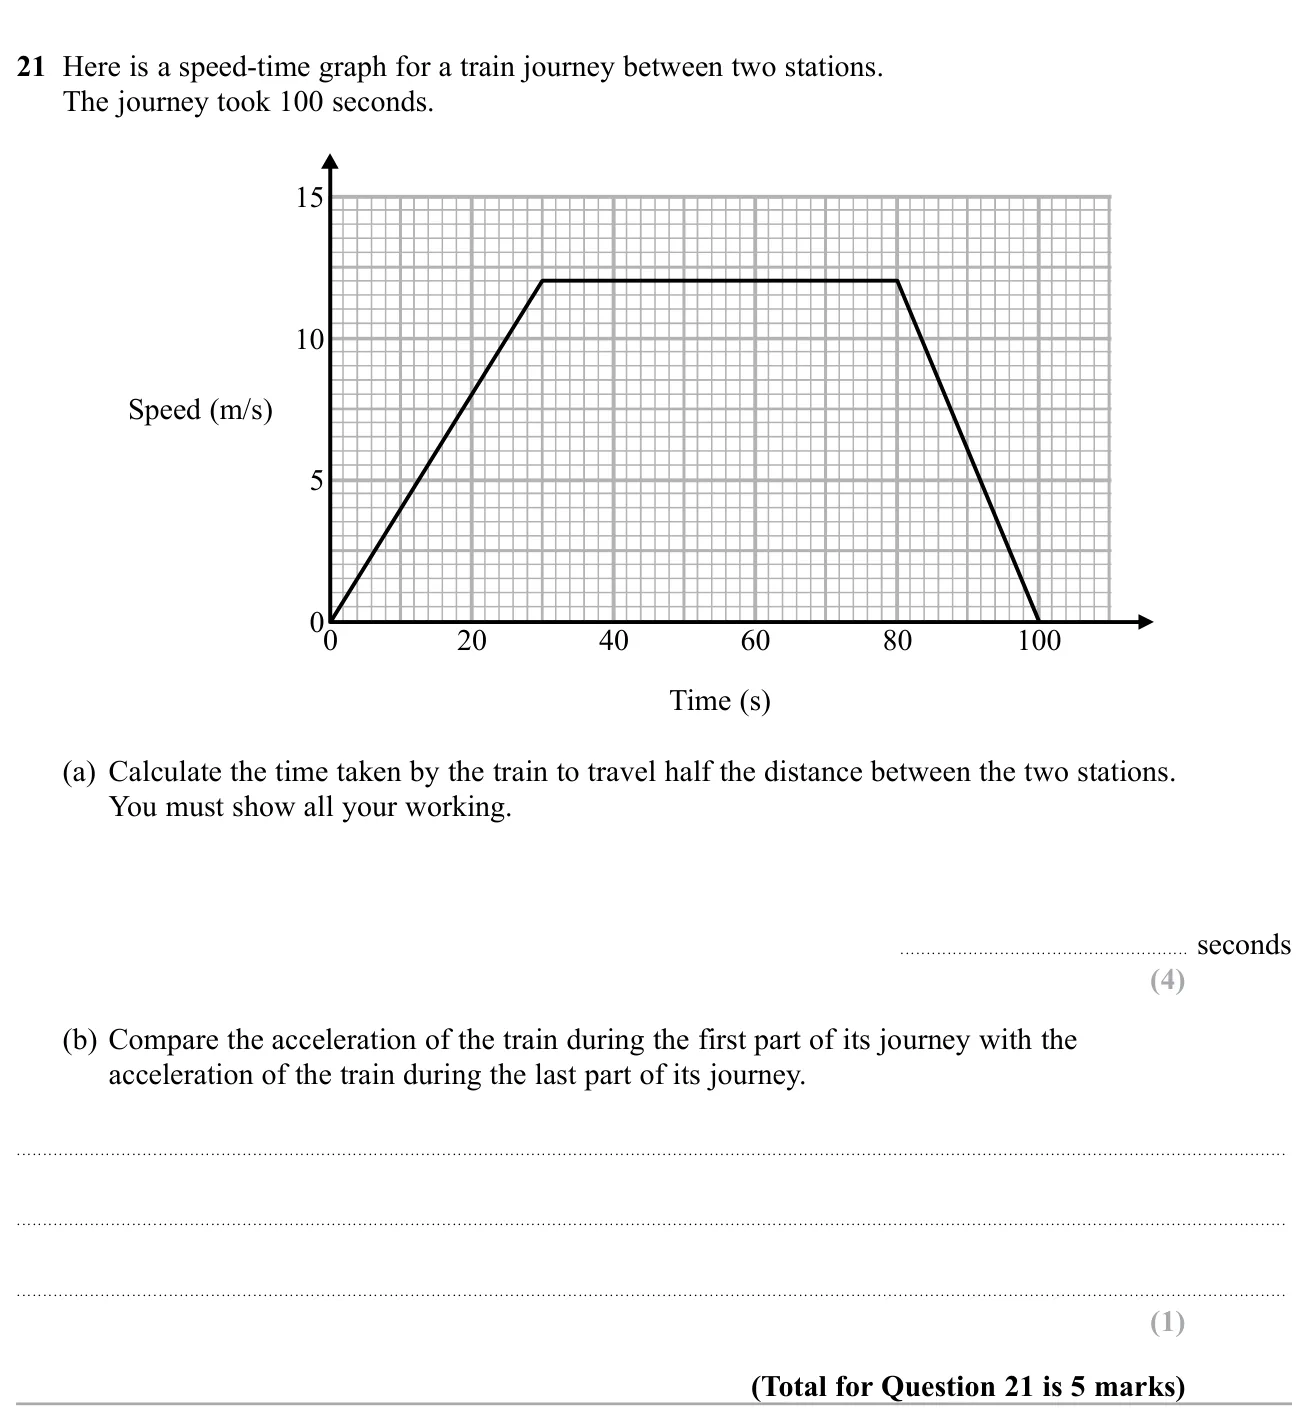
© Pearson Education Ltd. November 2019 Paper 2 (Higher, calculator), question 21.
(a) 52.5 seconds 4 marks (b) The train speeds up at 0.4 m/s² but slows down at 0.6 m/s², so the deceleration at the end is greater (steeper) 1 mark
Worked solution Checked against the mark scheme
(a) Distance = area: 1 2 ( 30 ) ( 12 ) + 50 ( 12 ) + 1 2 ( 20 ) ( 12 ) = 180 + 600 + 120 = 900 \frac{1}{2}(30)(12) + 50(12) + \frac{1}{2}(20)(12) = 180 + 600 + 120 = 900 2 1 ( 30 ) ( 12 ) + 50 ( 12 ) + 2 1 ( 20 ) ( 12 ) = 180 + 600 + 120 = 900
Half distance = 450 = 450 = 450 270 270 270 270 ÷ 12 = 22.5 270 \div 12 = 22.5 270 ÷ 12 = 22.5
Time = 30 + 22.5 = 52.5 = 30 + 22.5 = 52.5 = 30 + 22.5 = 52.5
(b) First part: 12 ÷ 30 = 0.4 m/s 2 12 \div 30 = 0.4\text{ m/s}^2 12 ÷ 30 = 0.4 m/s 2 − 12 ÷ 20 = − 0.6 m/s 2 -12 \div 20 = -0.6\text{ m/s}^2 − 12 ÷ 20 = − 0.6 m/s 2
Watch out: Answering 50 s (half the time) instead of the time for half the distance.
Also tested in these questions Their main topic is different, but part of each one tests this topic.