Revision guide by The Full Marks
Charts, graphs and time series: what you need to know Charts and graphs turn data into pictures so patterns are easy to see. You need to draw and read pictograms, bar charts, pie charts, line graphs, stem and leaf diagrams, two-way tables and frequency polygons, and choose a sensible one.
Key facts Pictograms need a key; part of a symbol stands for part of the value (if a whole symbol is 4, a quarter is 1). Bar charts: equal widths, labelled axes and an evenly spaced (linear) scale. A dual bar chart needs a key. Pie charts: angle = frequency total × 360 ∘ = \frac{\text{frequency}}{\text{total}} \times 360^\circ = total frequency × 36 0 ∘ Stem and leaf diagrams must be ordered and need a key, e.g. 3 ∣ 7 3 \mid 7 3 ∣ 7 Two-way tables: each row and column adds up to its total, so fill in any cell where only one value is missing, then check the totals. Line graphs (time series) and frequency polygons join points with straight lines. A frequency polygon plots each frequency at the midpoint of its class. Drawing a pie chart Add up the frequencies to get the total. Work out 360 ÷ total: the degrees for one item. Multiply each frequency by that number. Check the angles add to 360°, then draw with a protractor. Reading a pie chart Find how many items one degree stands for, using a sector you know. Multiply by the angle of the sector you want. Worked examples Example 1 Foundation · grade 3
60 students chose their favourite fruit: apple 20, banana 15, grape 10, orange 15. Work out the angles for a pie chart.
Show the solution 360 ÷ 60 = 6° per student20 × 6 = 120 ° 20 \times 6 = 120° 20 × 6 = 120° 15 × 6 = 90 ° 15 \times 6 = 90° 15 × 6 = 90° 10 × 6 = 60 ° 10 \times 6 = 60° 10 × 6 = 60° 15 × 6 = 90 ° 15 \times 6 = 90° 15 × 6 = 90°
Example 2 Foundation · grade 4
In a pie chart, a sector of 72° represents 18 people. (a) How many people are shown in the whole chart? (b) How many people does a sector of 120° represent?
Show the solution (a) 18 ÷ 72 = 0.25 people per degree0.25 × 360 = 90 0.25 \times 360 = 90 0.25 × 360 = 90 0.25 × 120 = 30 0.25 \times 120 = 30 0.25 × 120 = 30
Common mistakes Using the frequencies as the pie chart angles. Giving the frequency as the mode. The mode is the category, e.g. 'bus', not 9. Reading the top of a stacked (composite) bar instead of the height of just that section. Plotting a frequency polygon at the class ends instead of the midpoints, or joining the first and last points. Exam tips Angles drawn within 2° of the correct size normally get the marks, so use a sharp pencil and a protractor. When asked what is wrong with a chart, point to real faults: an uneven scale, a wrong bar height, a missing key or labels, points not at midpoints. 'It has no title' does not score, and a frequency polygon does not need to start at the origin. When comparing two pie charts, remember they may show different totals: a bigger angle does not always mean more people. Questions people ask How do you work out the angles for a pie chart? Divide 360 by the total frequency, then multiply each frequency by that answer. The angles should add up to 360°.
When should you use a bar chart or a line graph? Use a bar chart to compare separate categories. Use a line graph for data that changes over time, like monthly temperatures.
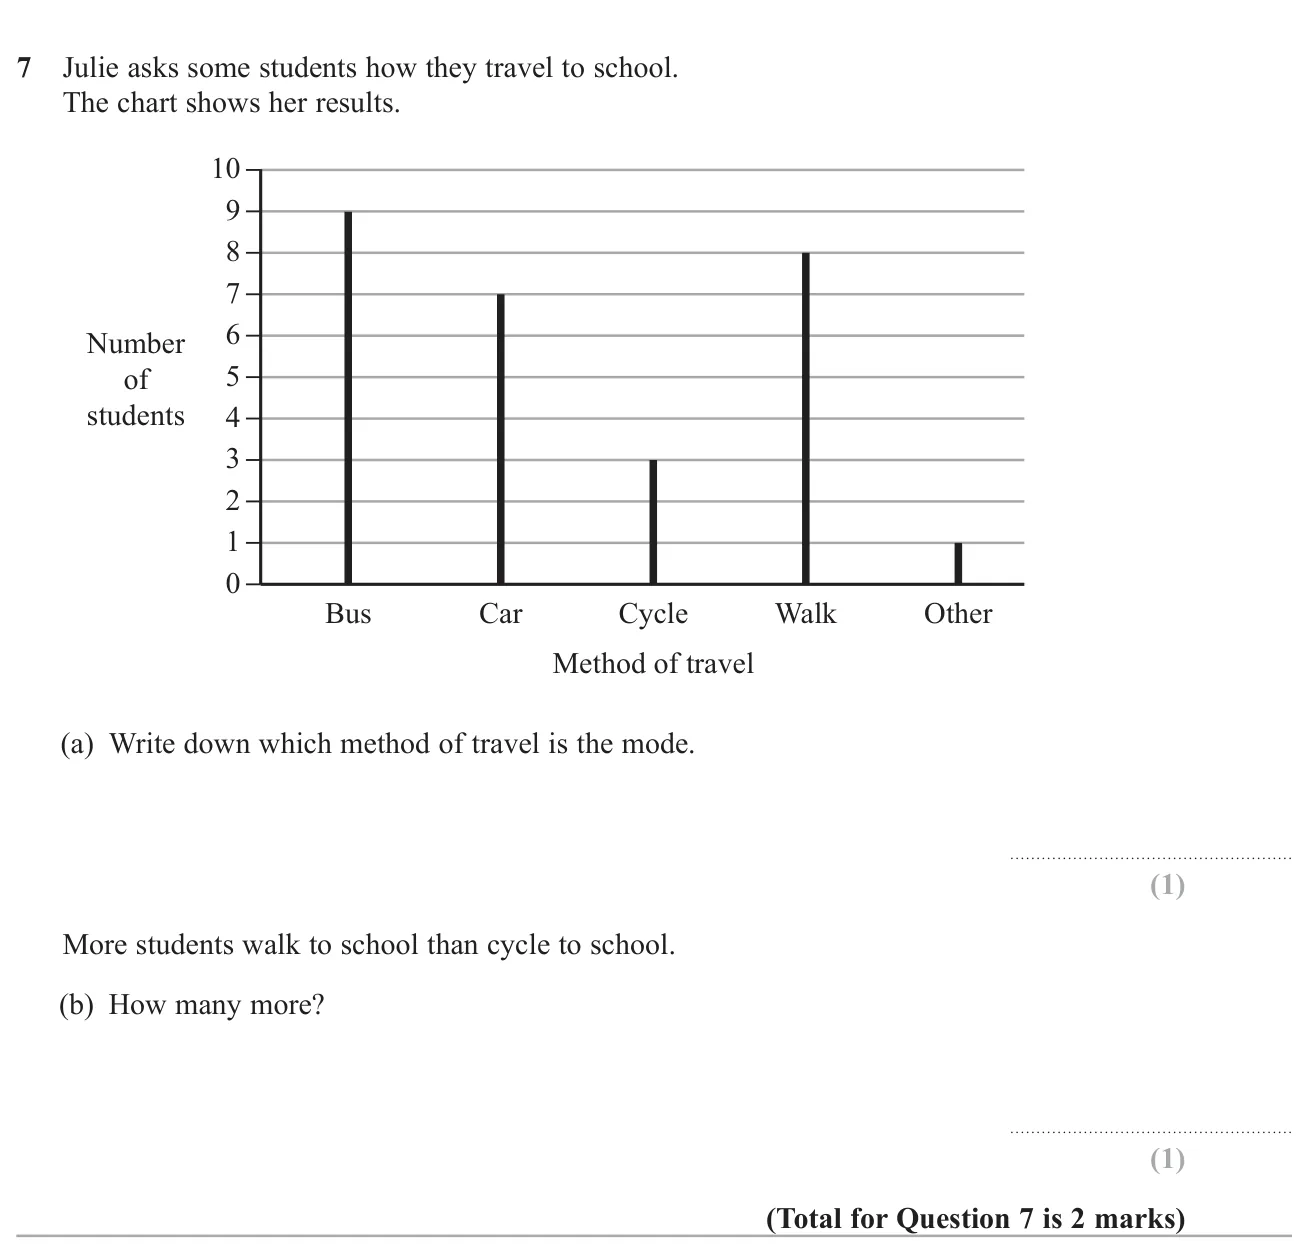
Exam questions: Charts, graphs and time series (51, easiest first) © Pearson Education Ltd. June 2024 Paper 3 (Foundation, calculator), question 7.
Worked solution Checked against the mark scheme
(a) The tallest bar is Bus (9 students), so the mode is Bus.
(b) Walk = 8, Cycle = 3, so 8 − 3 = 5 8 - 3 = 5 8 − 3 = 5
Watch out: Giving the frequency 9 instead of the category for the mode.
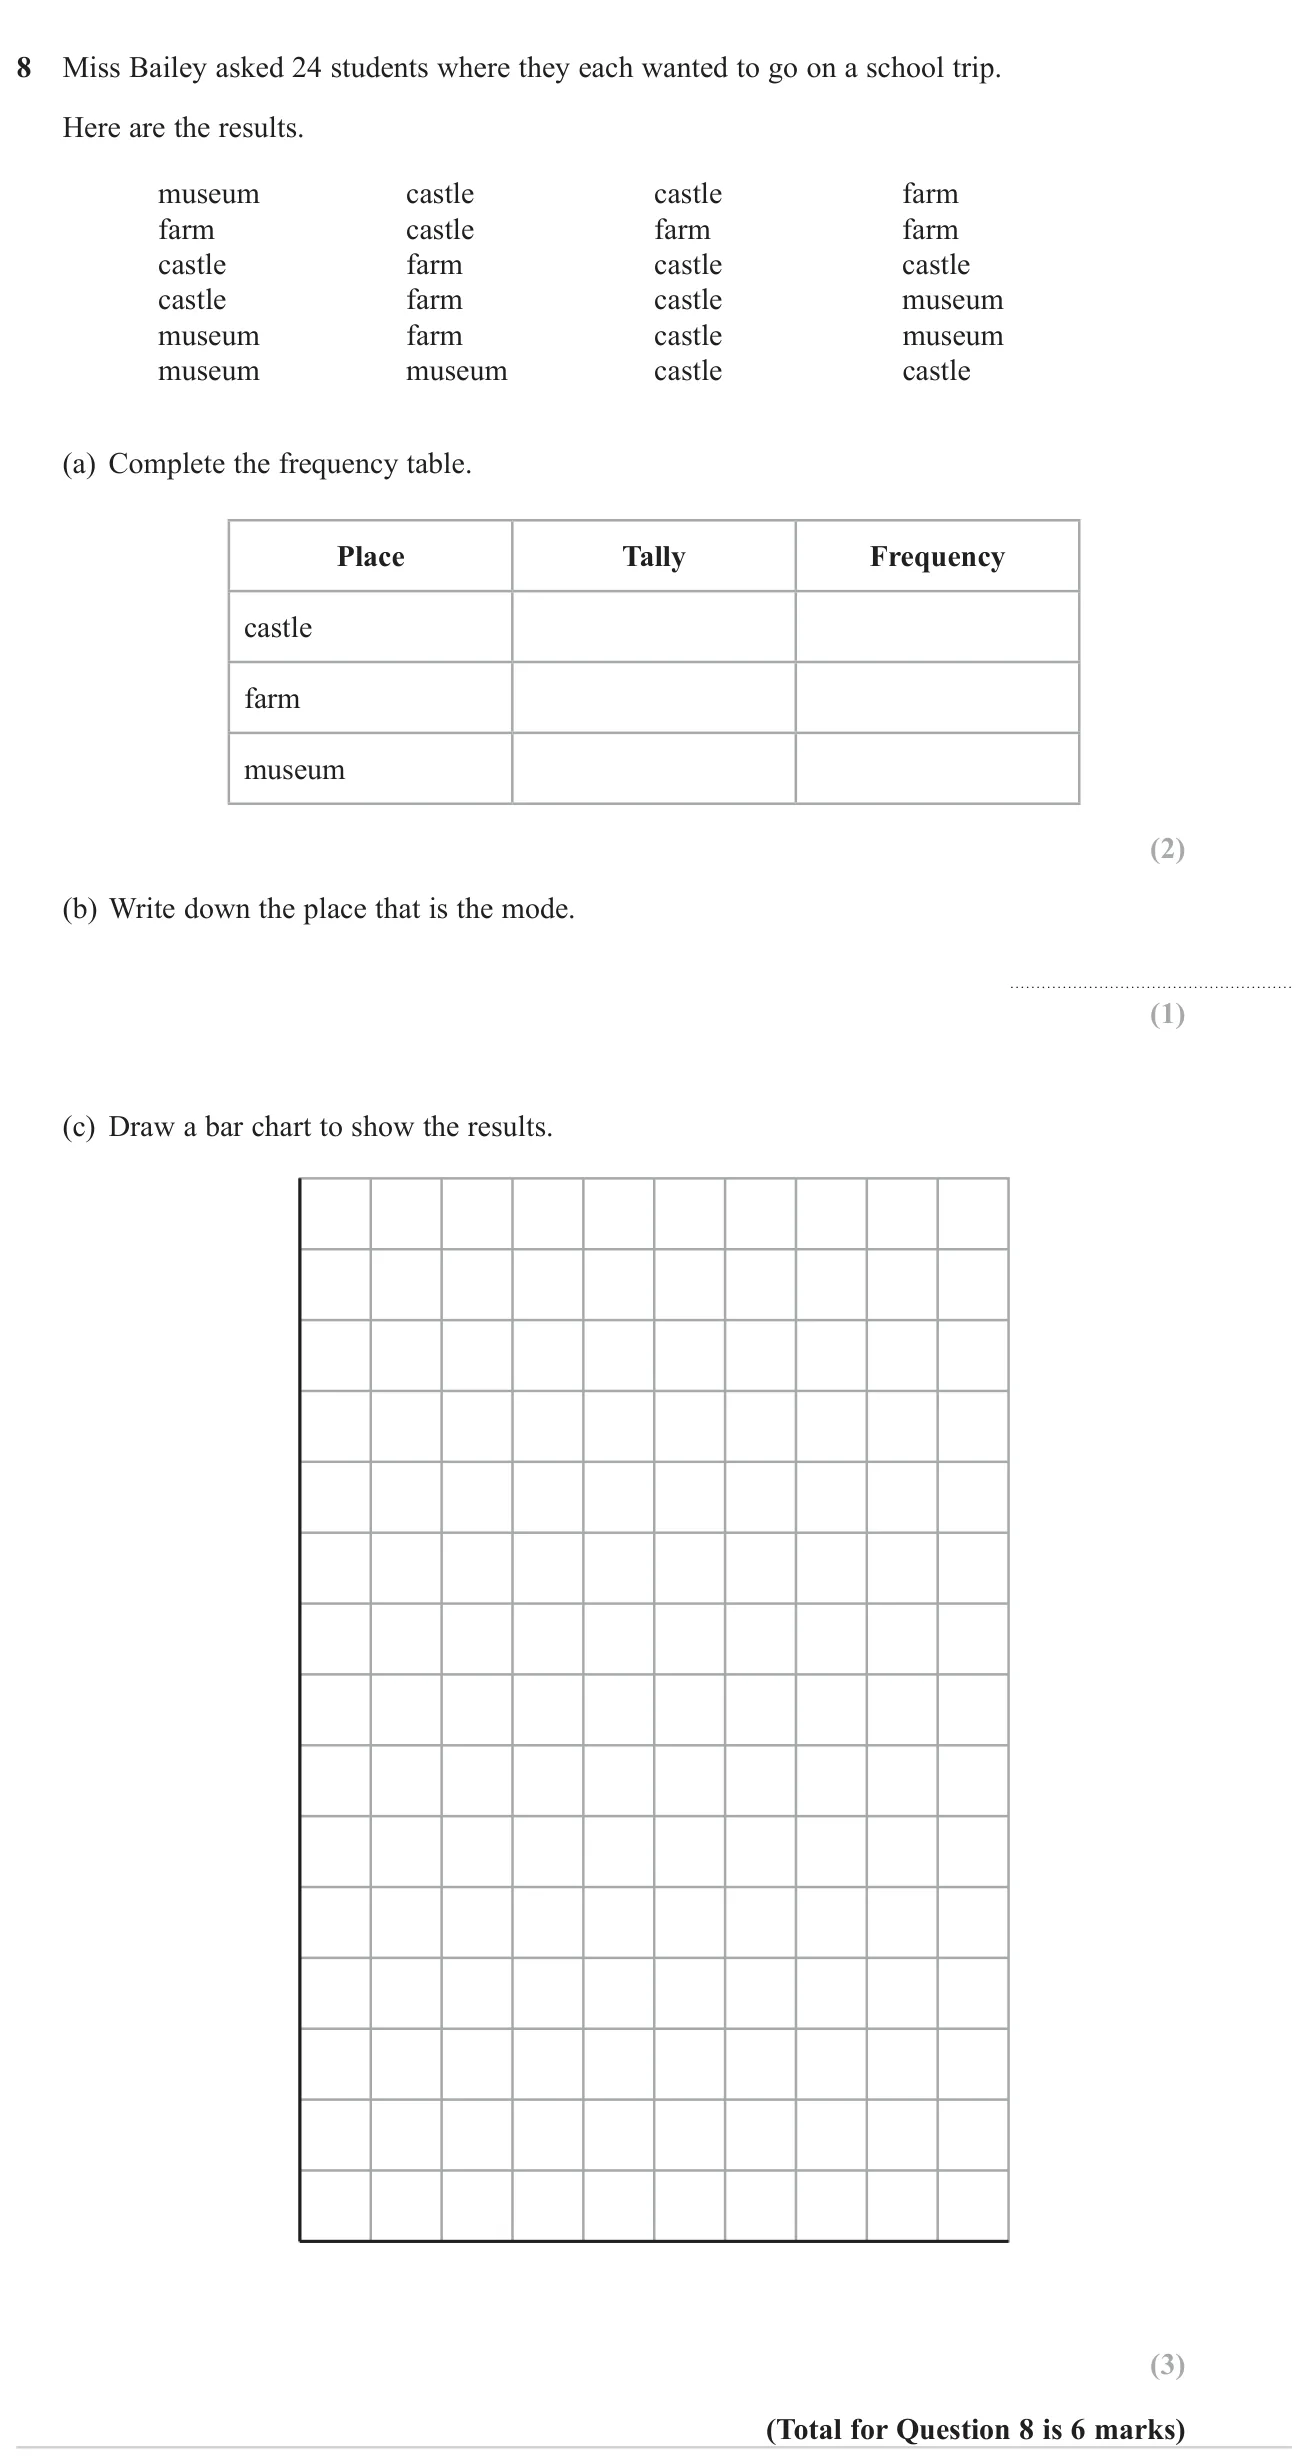
© Pearson Education Ltd. November 2023 Paper 1 (Foundation, non-calculator), question 8.
(a) castle 11, farm 7, museum 6 2 marks (b) castle 1 mark (c) Bar chart with bars of height 11, 7 and 6 3 marks
Worked solution Checked against the mark scheme
(a) Count each place: castle 11, farm 7, museum 6. Check: 11 + 7 + 6 = 24 11 + 7 + 6 = 24 11 + 7 + 6 = 24
(b) The mode is the most common choice: castle .
(c) Label the horizontal axis with the three places and the vertical axis 0 to 12 in equal steps. Draw bars of height 11, 7 and 6 with equal widths.
Watch out: Giving the frequency 11 as the mode instead of the place.
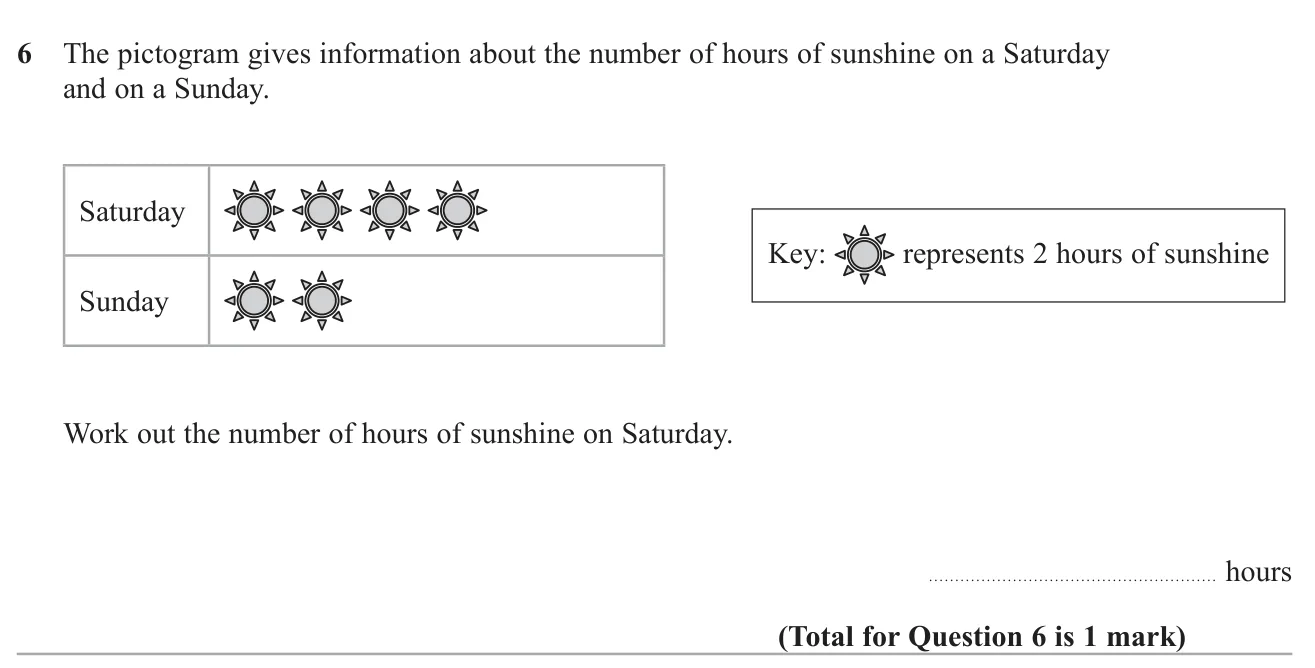
© Pearson Education Ltd. June 2022 Paper 1 (Foundation, non-calculator), question 6.
Worked solution Checked against the mark scheme
Saturday has 4 symbols and each symbol stands for 2 hours.
4 × 2 = 8 4 \times 2 = 8 4 × 2 = 8
Watch out: Counting the symbols (4) and forgetting the key.
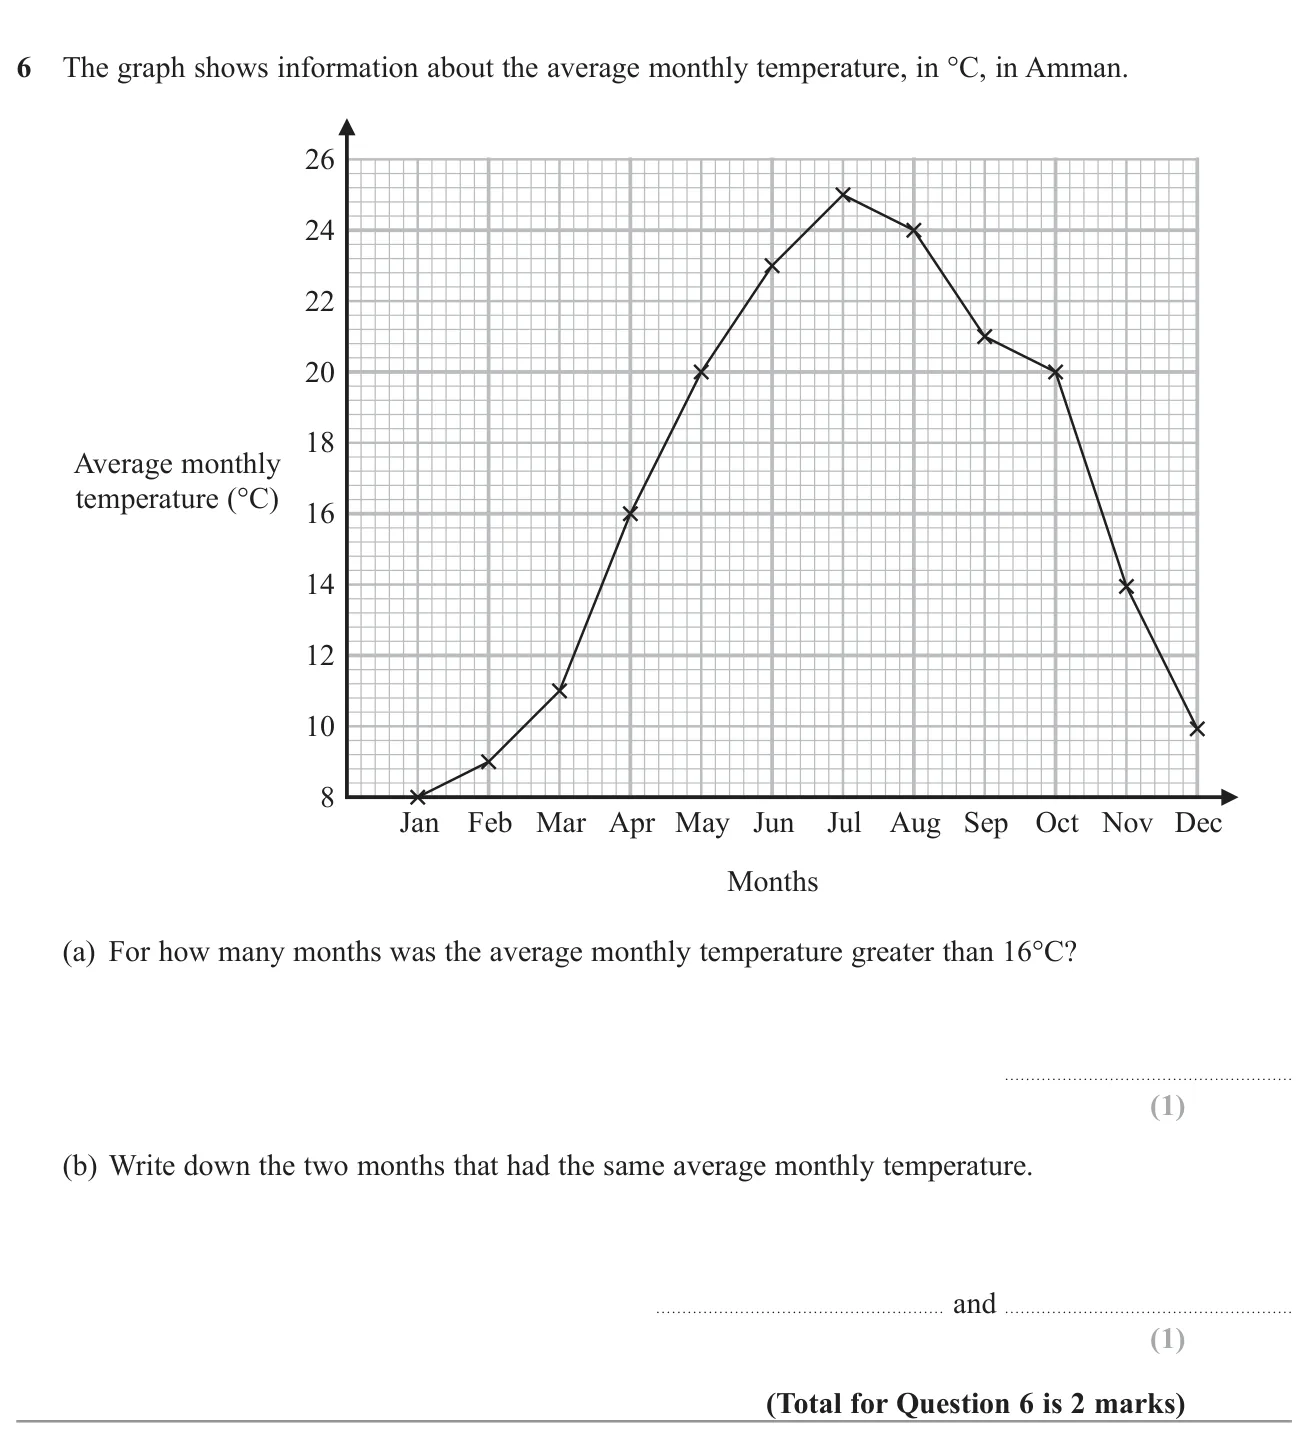
© Pearson Education Ltd. November 2022 Paper 3 (Foundation, calculator), question 6.
(a) 6 1 mark (b) May and October 1 mark
Worked solution Checked against the mark scheme
(a) Months above 16°C: May, Jun, Jul, Aug, Sep, Oct, so 6 months (April is exactly 16°C, not above).
(b) May and October are both at 20°C.
Watch out: Counting April, which is exactly 16°C, not greater than it.
© Pearson Education Ltd. November 2021 Paper 1 (Foundation, non-calculator), question 8.
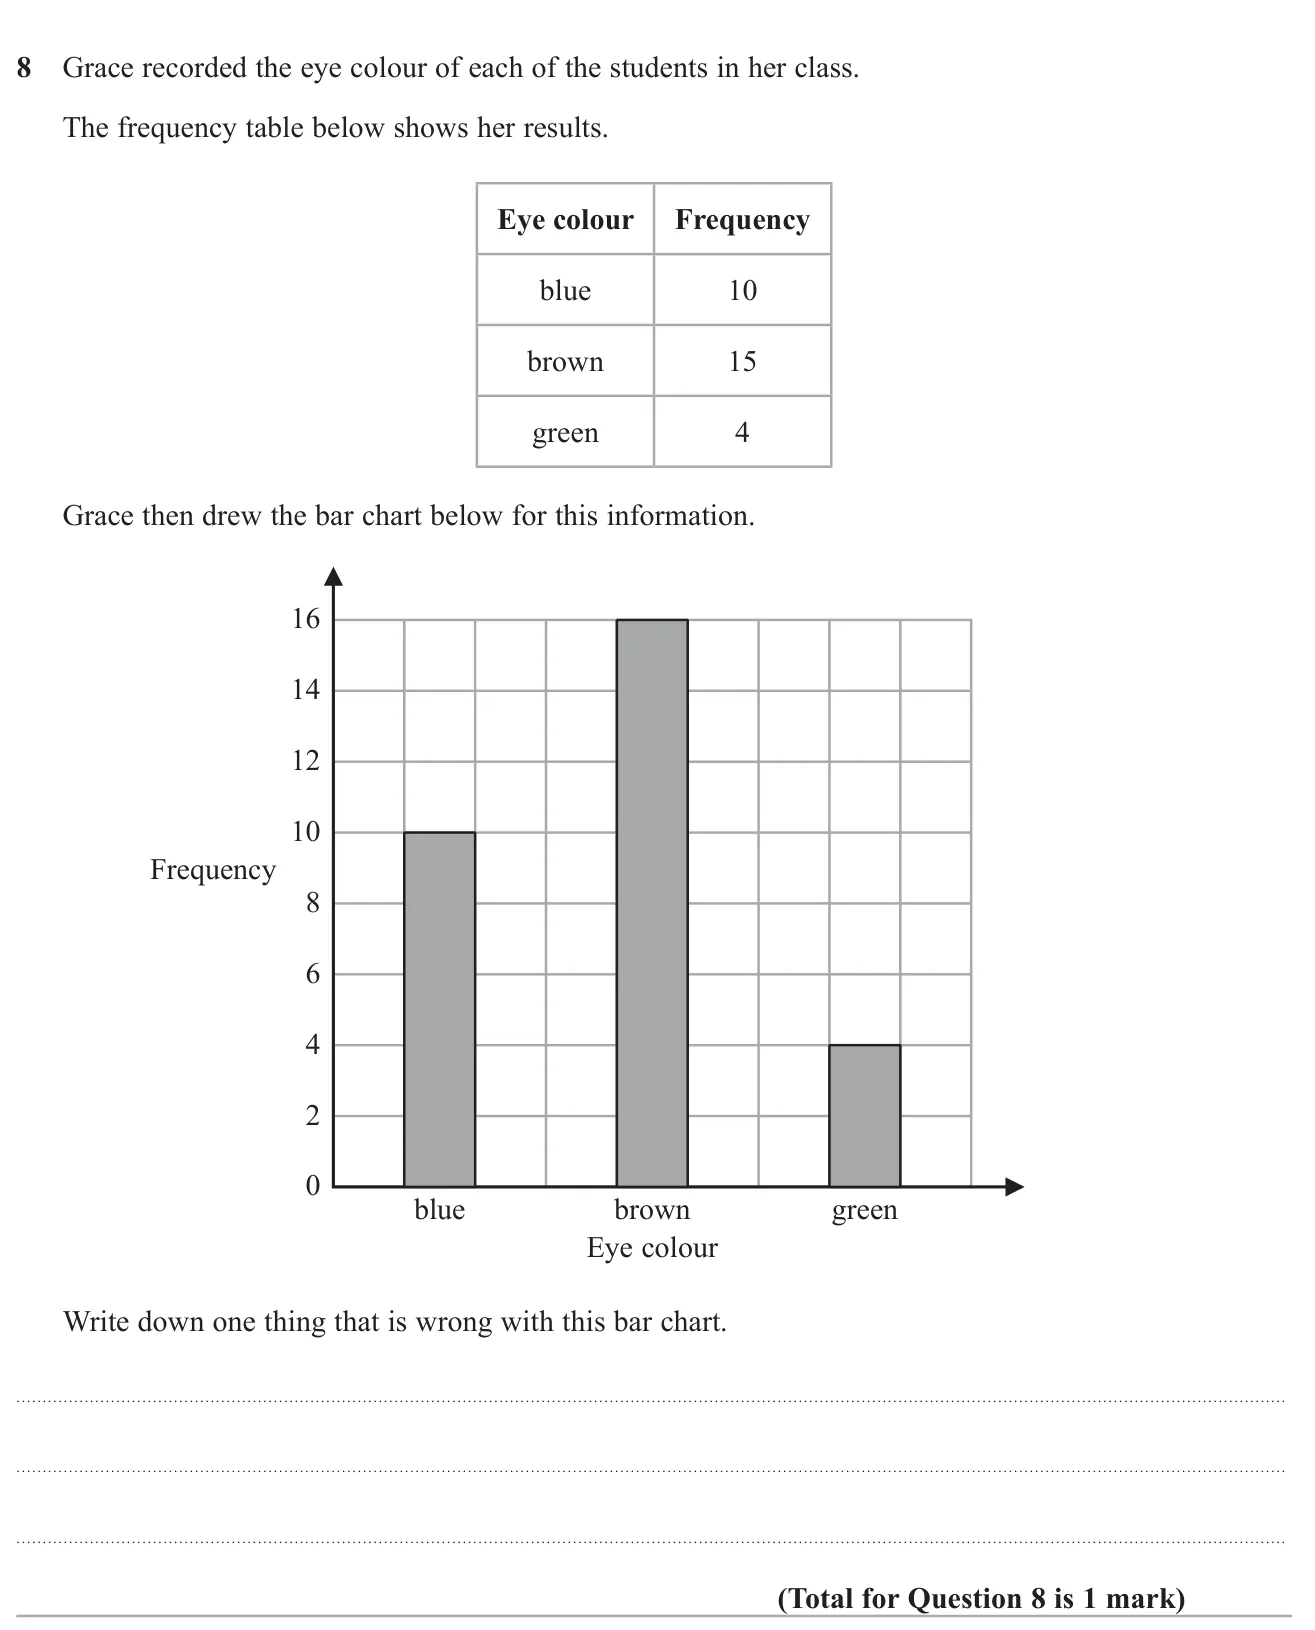
Answer The bar for brown goes up to 16 but should go up to 15 1 mark
Worked solution Checked against the mark scheme
Check each bar against the table.
Blue: 10 and 10. Green: 4 and 4. Brown: the table says 15 but the bar reaches 16.
So the brown bar is one too tall.
Watch out: Commenting on the gaps or a missing title, which are not errors here.
© Pearson Education Ltd. November 2020 Paper 3 (Foundation, calculator), question 6.
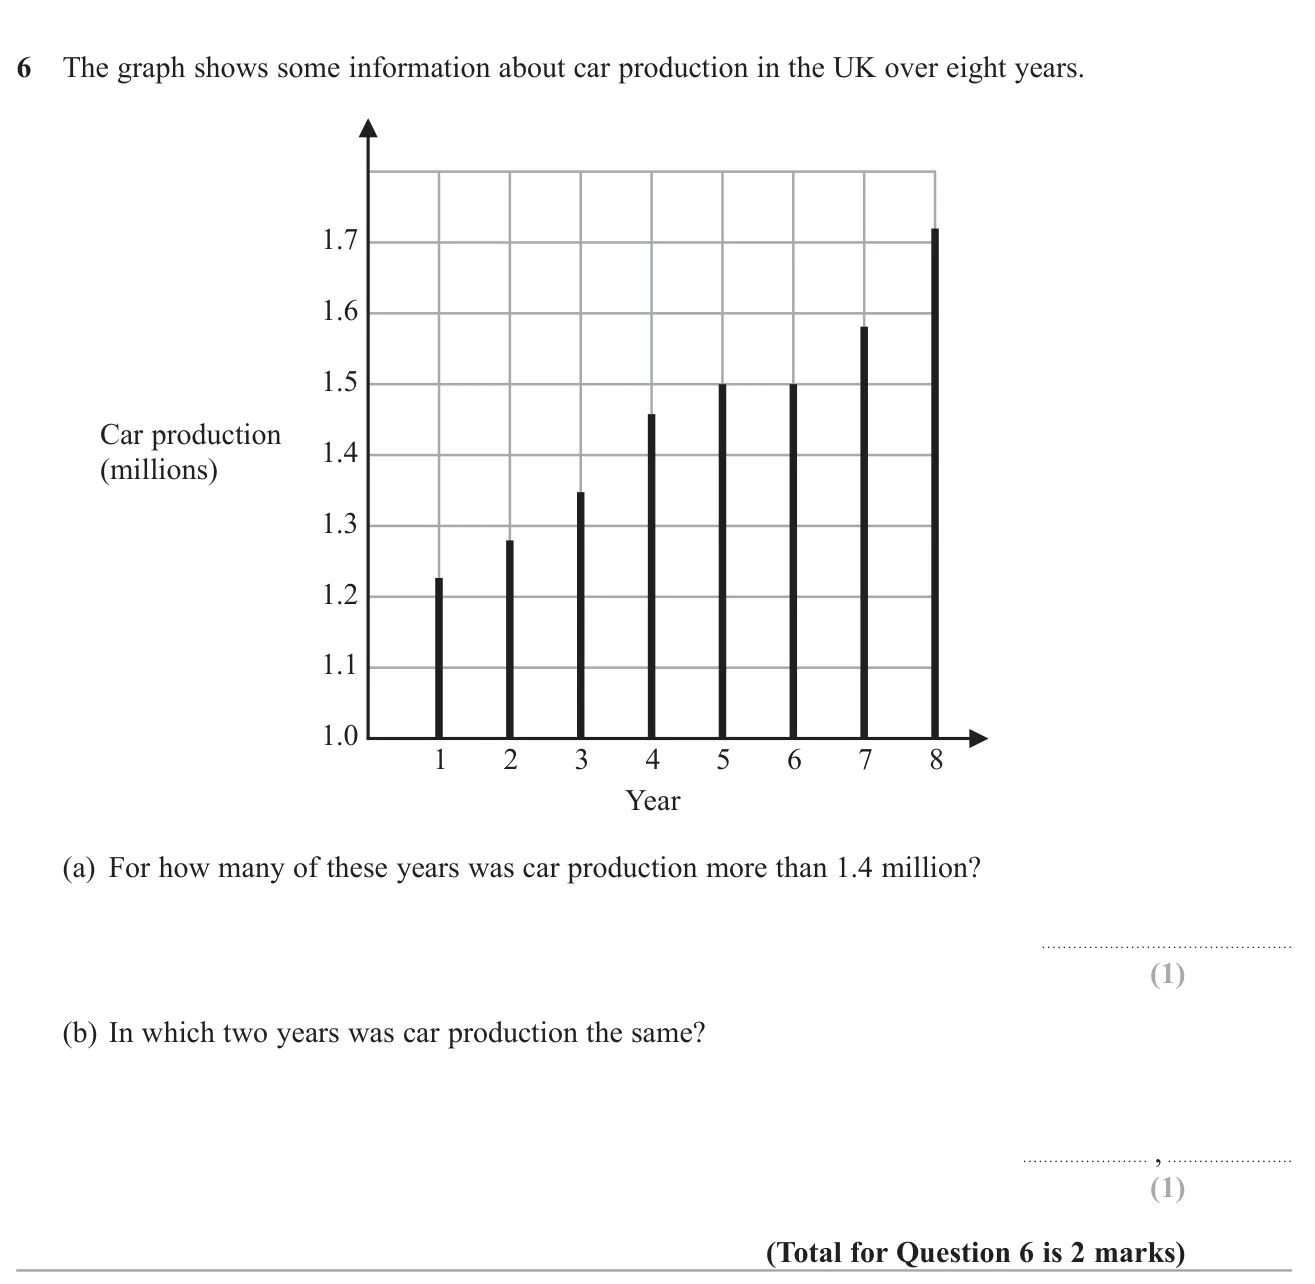
(a) 5 1 mark (b) Years 5 and 6 1 mark
Worked solution Checked against the mark scheme
(a) Bars above the 1.4 line: years 4, 5, 6, 7 and 8, so 5 years.
(b) Years 5 and 6 both reach exactly 1.5 million.
Watch out: Missing year 4, which is only just above 1.4.
© Pearson Education Ltd. November 2024 Paper 1 (Foundation, non-calculator), question 9.
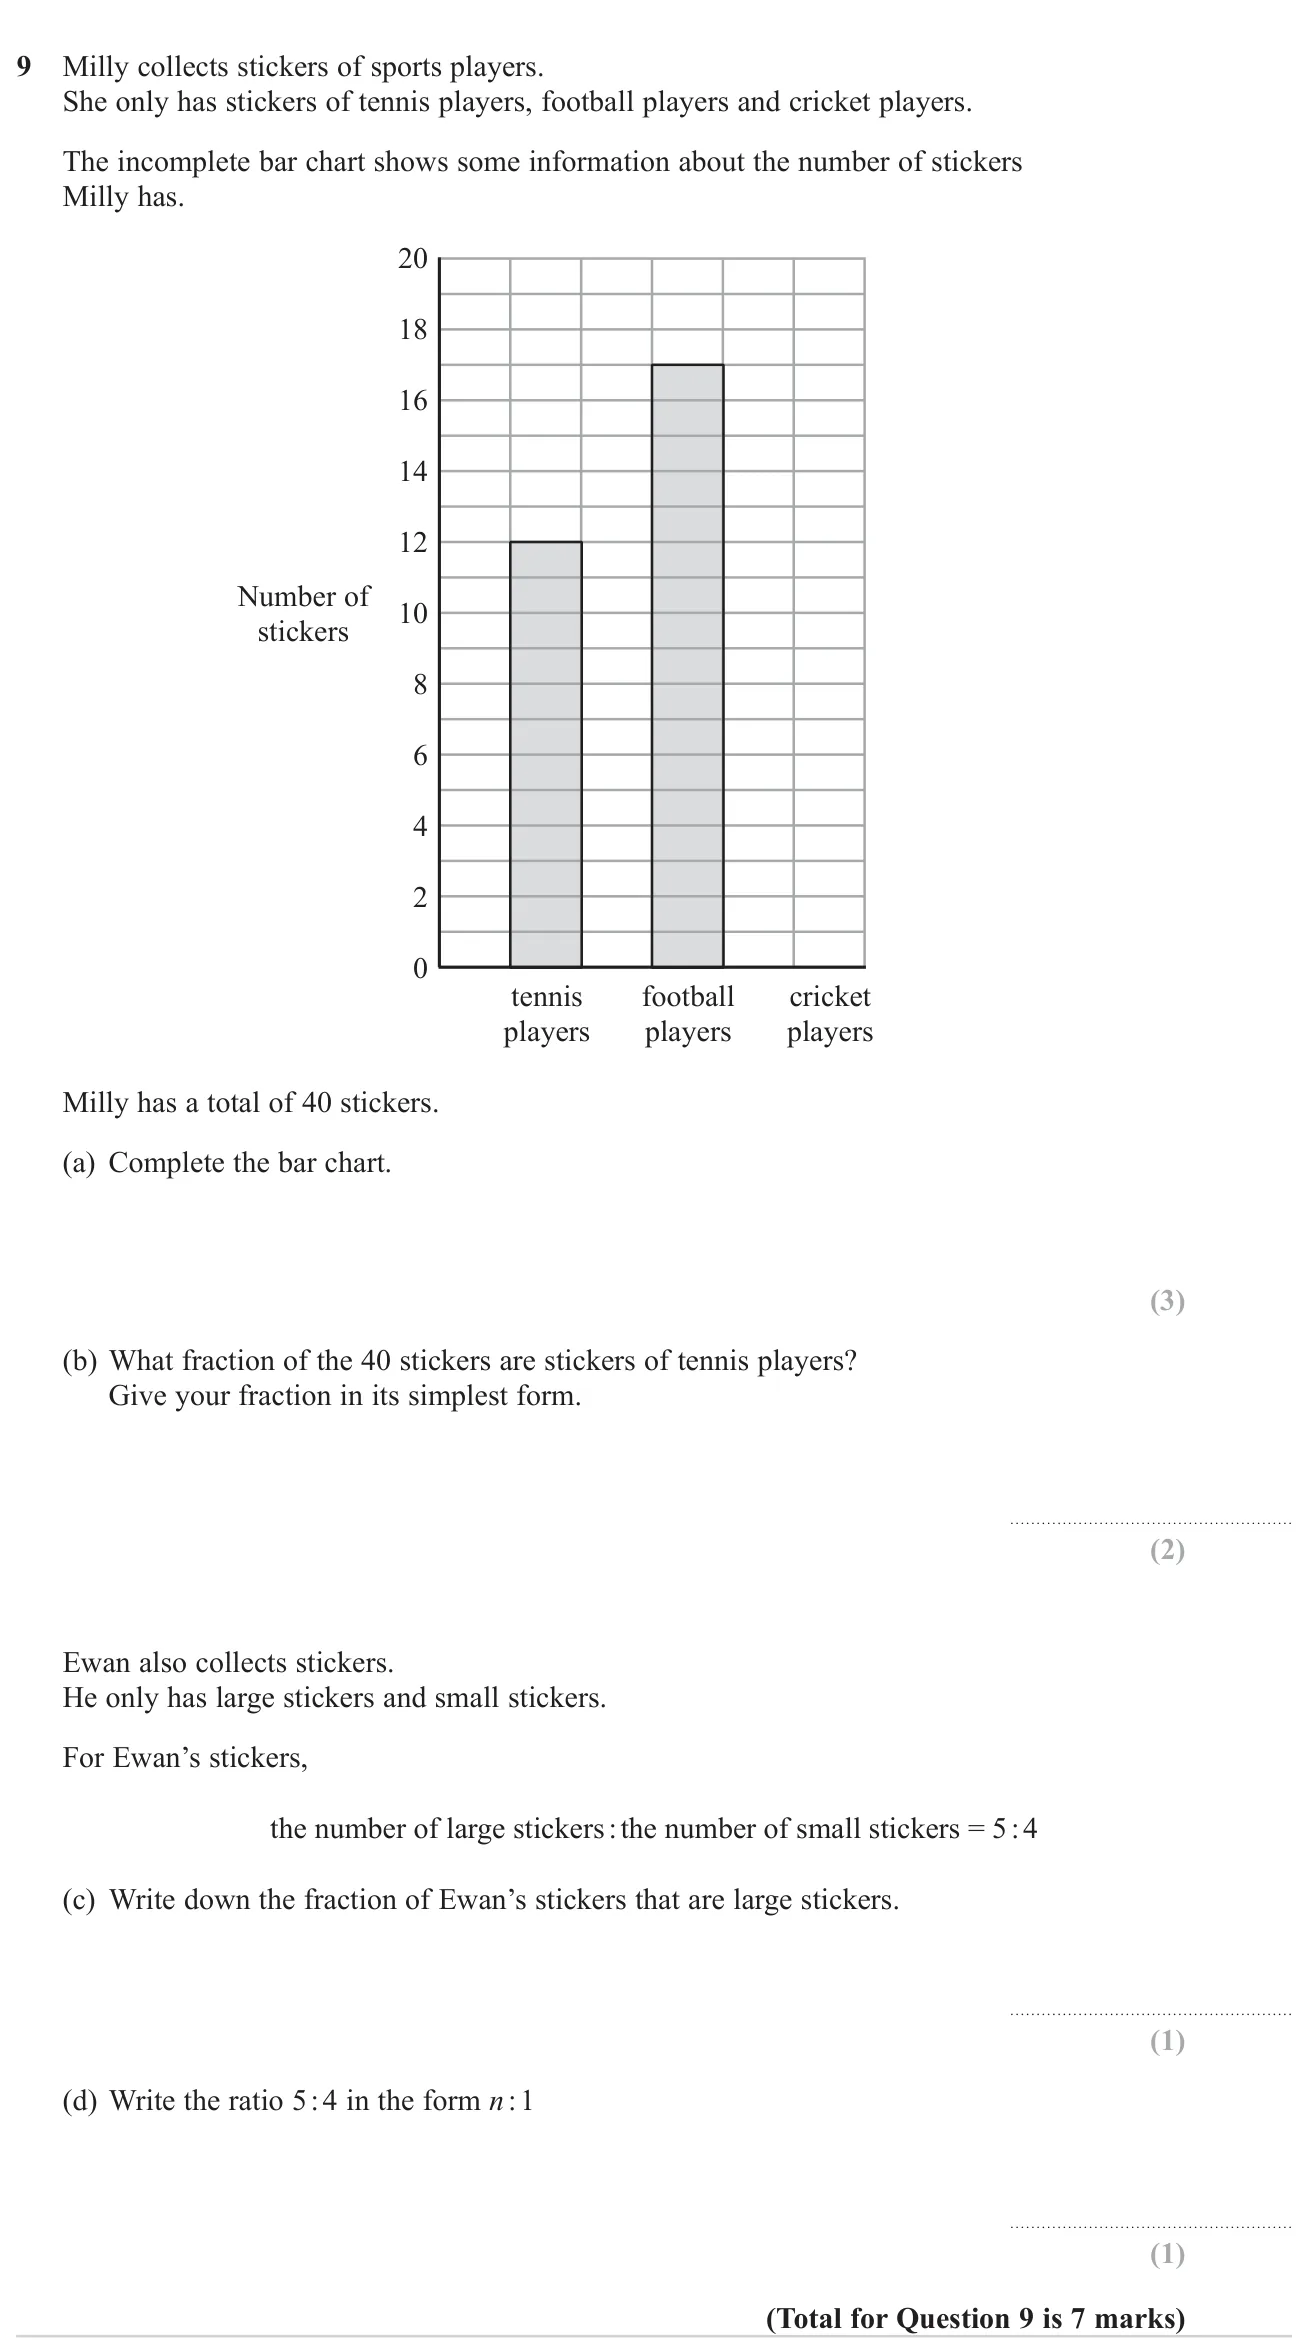
(a) Cricket bar drawn to height 11 3 marks (b) 3 10 \frac{3}{10} 10 3 2 marks (c) 5 9 \frac{5}{9} 9 5 1 mark (d) 1.25 : 1 1.25 : 1 1.25 : 1 1 mark
Worked solution Checked against the mark scheme
(a) Tennis is 12 and football is 17. Cricket = 40 − 12 − 17 = 11 = 40 - 12 - 17 = 11 = 40 − 12 − 17 = 11
(b) 12 40 = 3 10 \frac{12}{40} = \frac{3}{10} 40 12 = 10 3
(c) There are 5 + 4 = 9 5 + 4 = 9 5 + 4 = 9 5 9 \frac{5}{9} 9 5
(d) Divide both sides by 4: 5 ÷ 4 = 1.25 5 \div 4 = 1.25 5 ÷ 4 = 1.25 1.25 : 1 1.25 : 1 1.25 : 1
Watch out: In (c), giving 5/4 instead of 5/9.
© Pearson Education Ltd. June 2024 Paper 2 (Foundation, calculator), question 6.
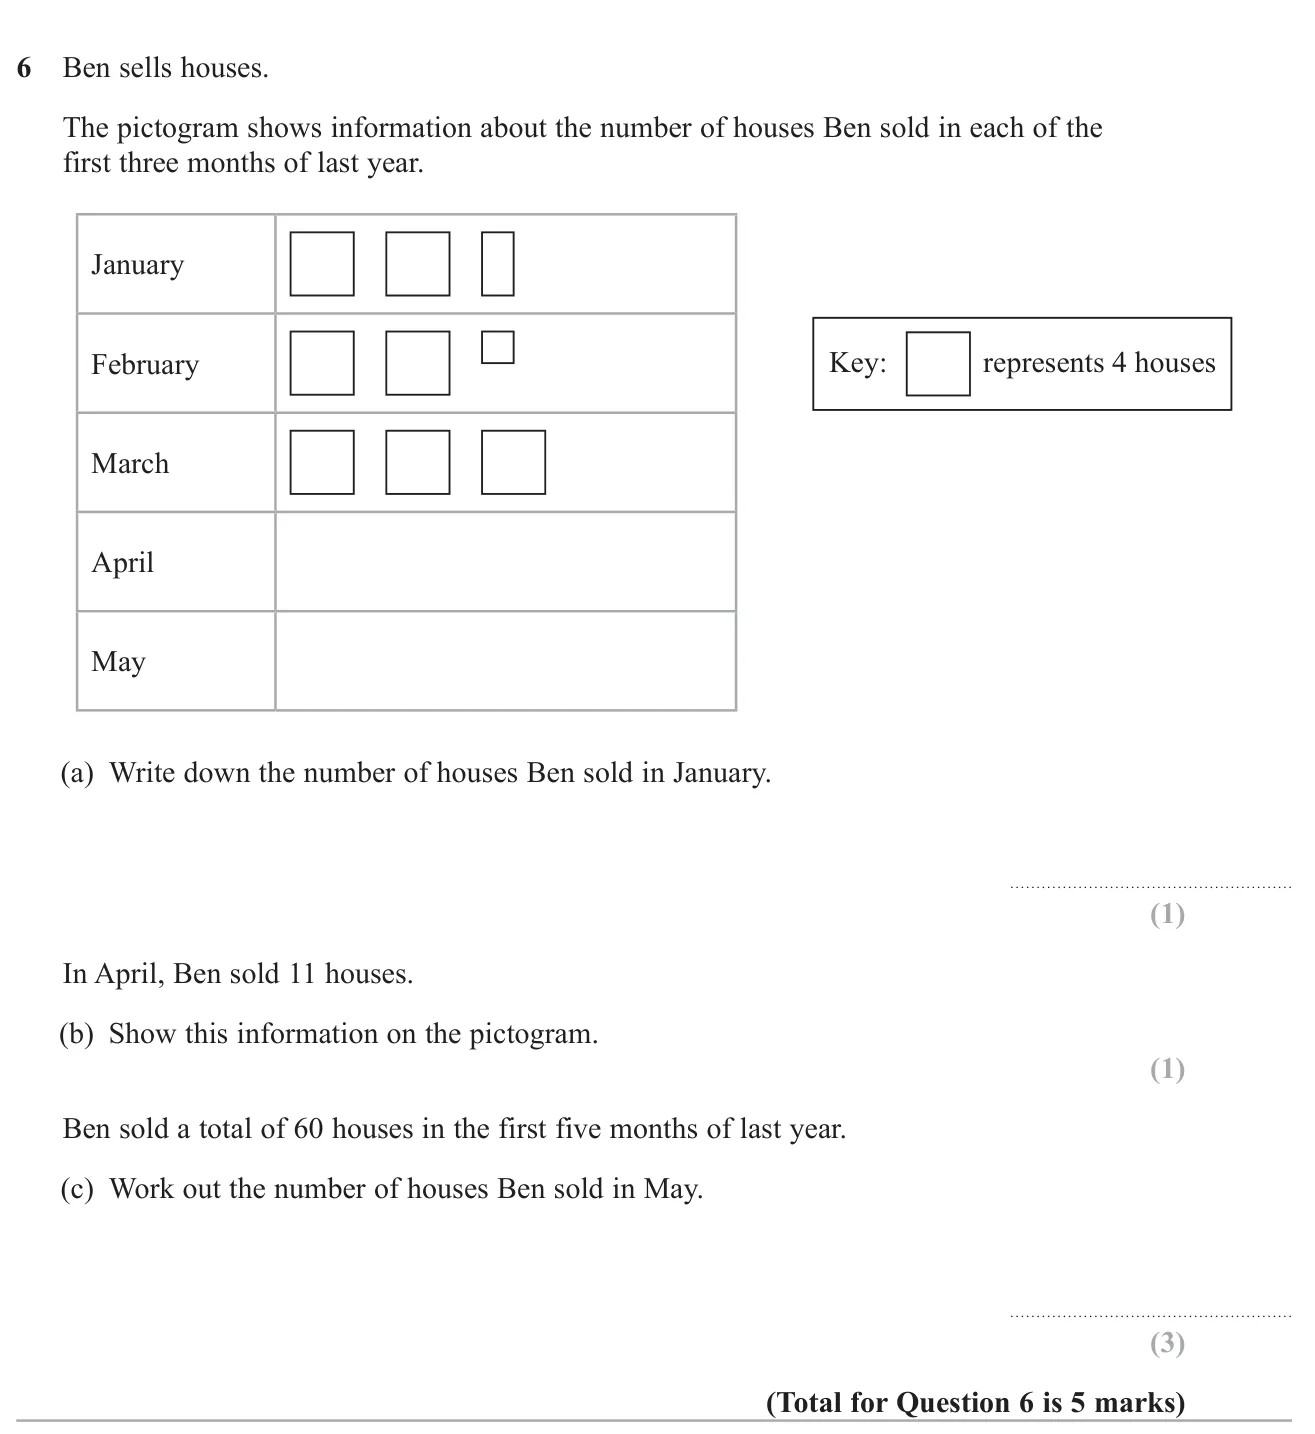
(a) 10 10 10 1 mark (b) 2 full squares and three-quarters of a square 1 mark (c) 18 18 18 3 marks
Worked solution Checked against the mark scheme
(a) Key: one square = 4 houses. January = 4 + 4 + 2 = 10 4 + 4 + 2 = 10 4 + 4 + 2 = 10
(b) 11 = 4 + 4 + 3 11 = 4 + 4 + 3 11 = 4 + 4 + 3 3 4 \frac{3}{4} 4 3
(c) February = 4 + 4 + 1 = 9 = 4 + 4 + 1 = 9 = 4 + 4 + 1 = 9 = 12 = 12 = 12 = 11 = 11 = 11
May = 60 − ( 10 + 9 + 12 + 11 ) = 60 − 42 = 18 = 60 - (10 + 9 + 12 + 11) = 60 - 42 = 18 = 60 − ( 10 + 9 + 12 + 11 ) = 60 − 42 = 18
Watch out: Counting each symbol as 1 house instead of using the key.
© Pearson Education Ltd. November 2023 Paper 3 (Foundation, calculator), question 6.
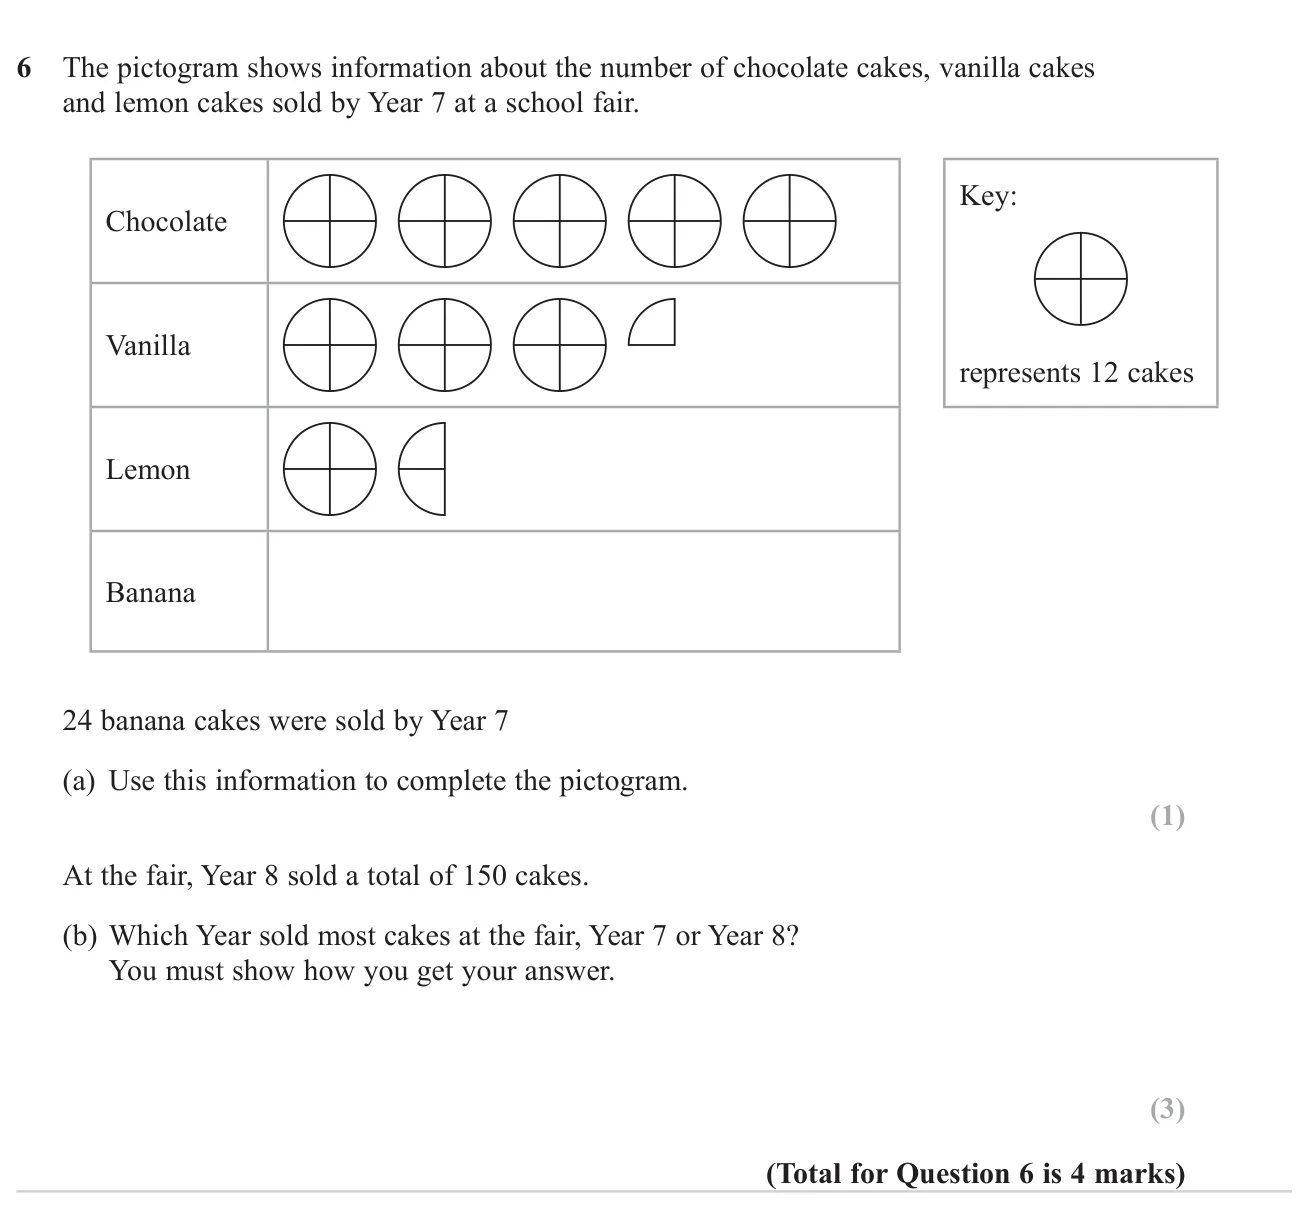
(a) 2 whole symbols drawn for banana 1 mark (b) Year 8 (Year 7 sold 141, Year 8 sold 150) 3 marks
Worked solution Checked against the mark scheme
(a) Each circle is 12 cakes, so 24 ÷ 12 = 2 24 \div 12 = 2 24 ÷ 12 = 2
(b) Chocolate 5 × 12 = 60 5 \times 12 = 60 5 × 12 = 60 3 1 4 × 12 = 39 3\frac{1}{4} \times 12 = 39 3 4 1 × 12 = 39 1 1 2 × 12 = 18 1\frac{1}{2} \times 12 = 18 1 2 1 × 12 = 18
Year 7 total = 60 + 39 + 18 + 24 = 141 = 60 + 39 + 18 + 24 = 141 = 60 + 39 + 18 + 24 = 141 Year 8 sold more.
Watch out: Reading a quarter circle as half a symbol, or leaving banana out of the total.
© Pearson Education Ltd. June 2022 Paper 1 (Foundation, non-calculator), question 8.
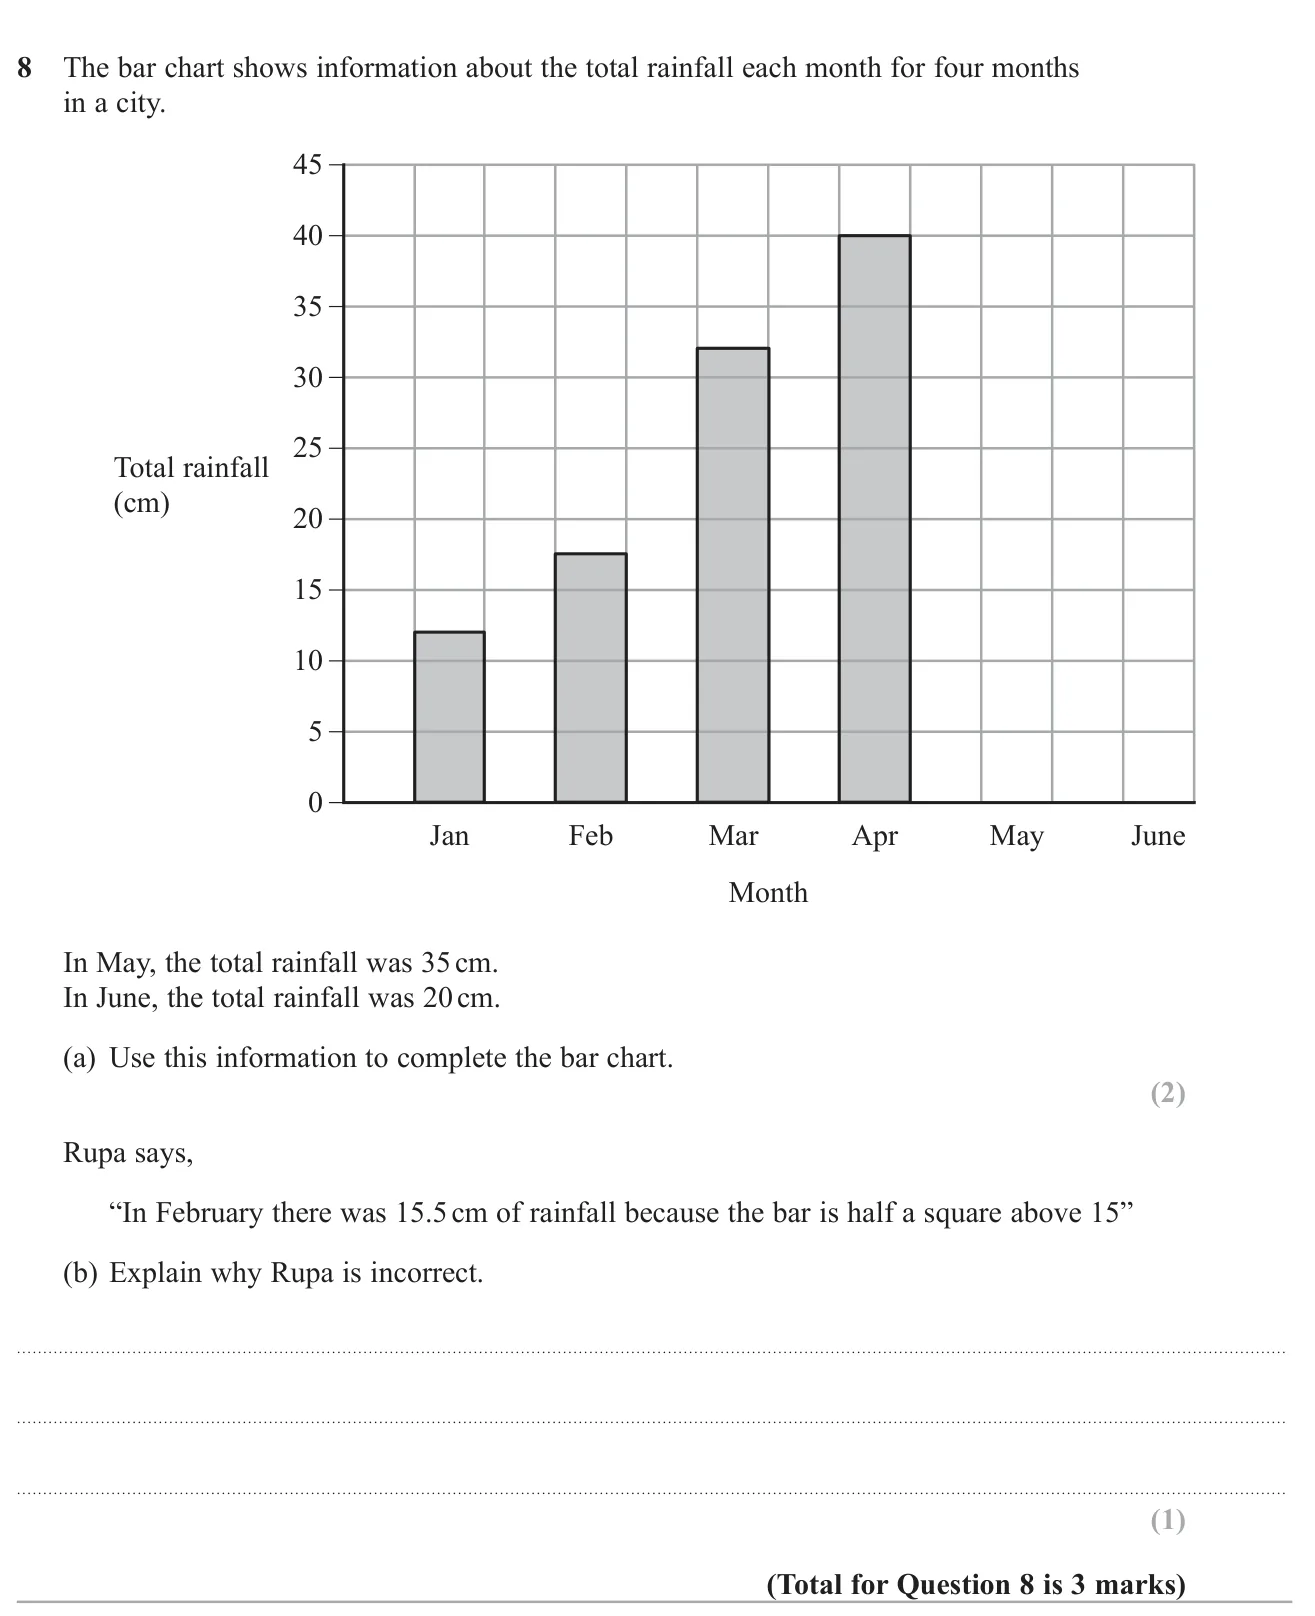
(a) Bars drawn to 35 for May and 20 for June 2 marks (b) Each square is worth 5 cm, so half a square is 2.5 cm and the bar shows 17.5 cm 1 mark
Worked solution Checked against the mark scheme
(a) Draw a bar up to 35 above May and a bar up to 20 above June, the same width as the others.
(b) The vertical scale goes up 5 cm per square, so half a square is 5 ÷ 2 = 2.5 5 \div 2 = 2.5 5 ÷ 2 = 2.5
February's bar is at 15 + 2.5 = 17.5 15 + 2.5 = 17.5 15 + 2.5 = 17.5
Watch out: Assuming each square is worth 1 unit.
© Pearson Education Ltd. November 2022 Paper 2 (Foundation, calculator), question 9.
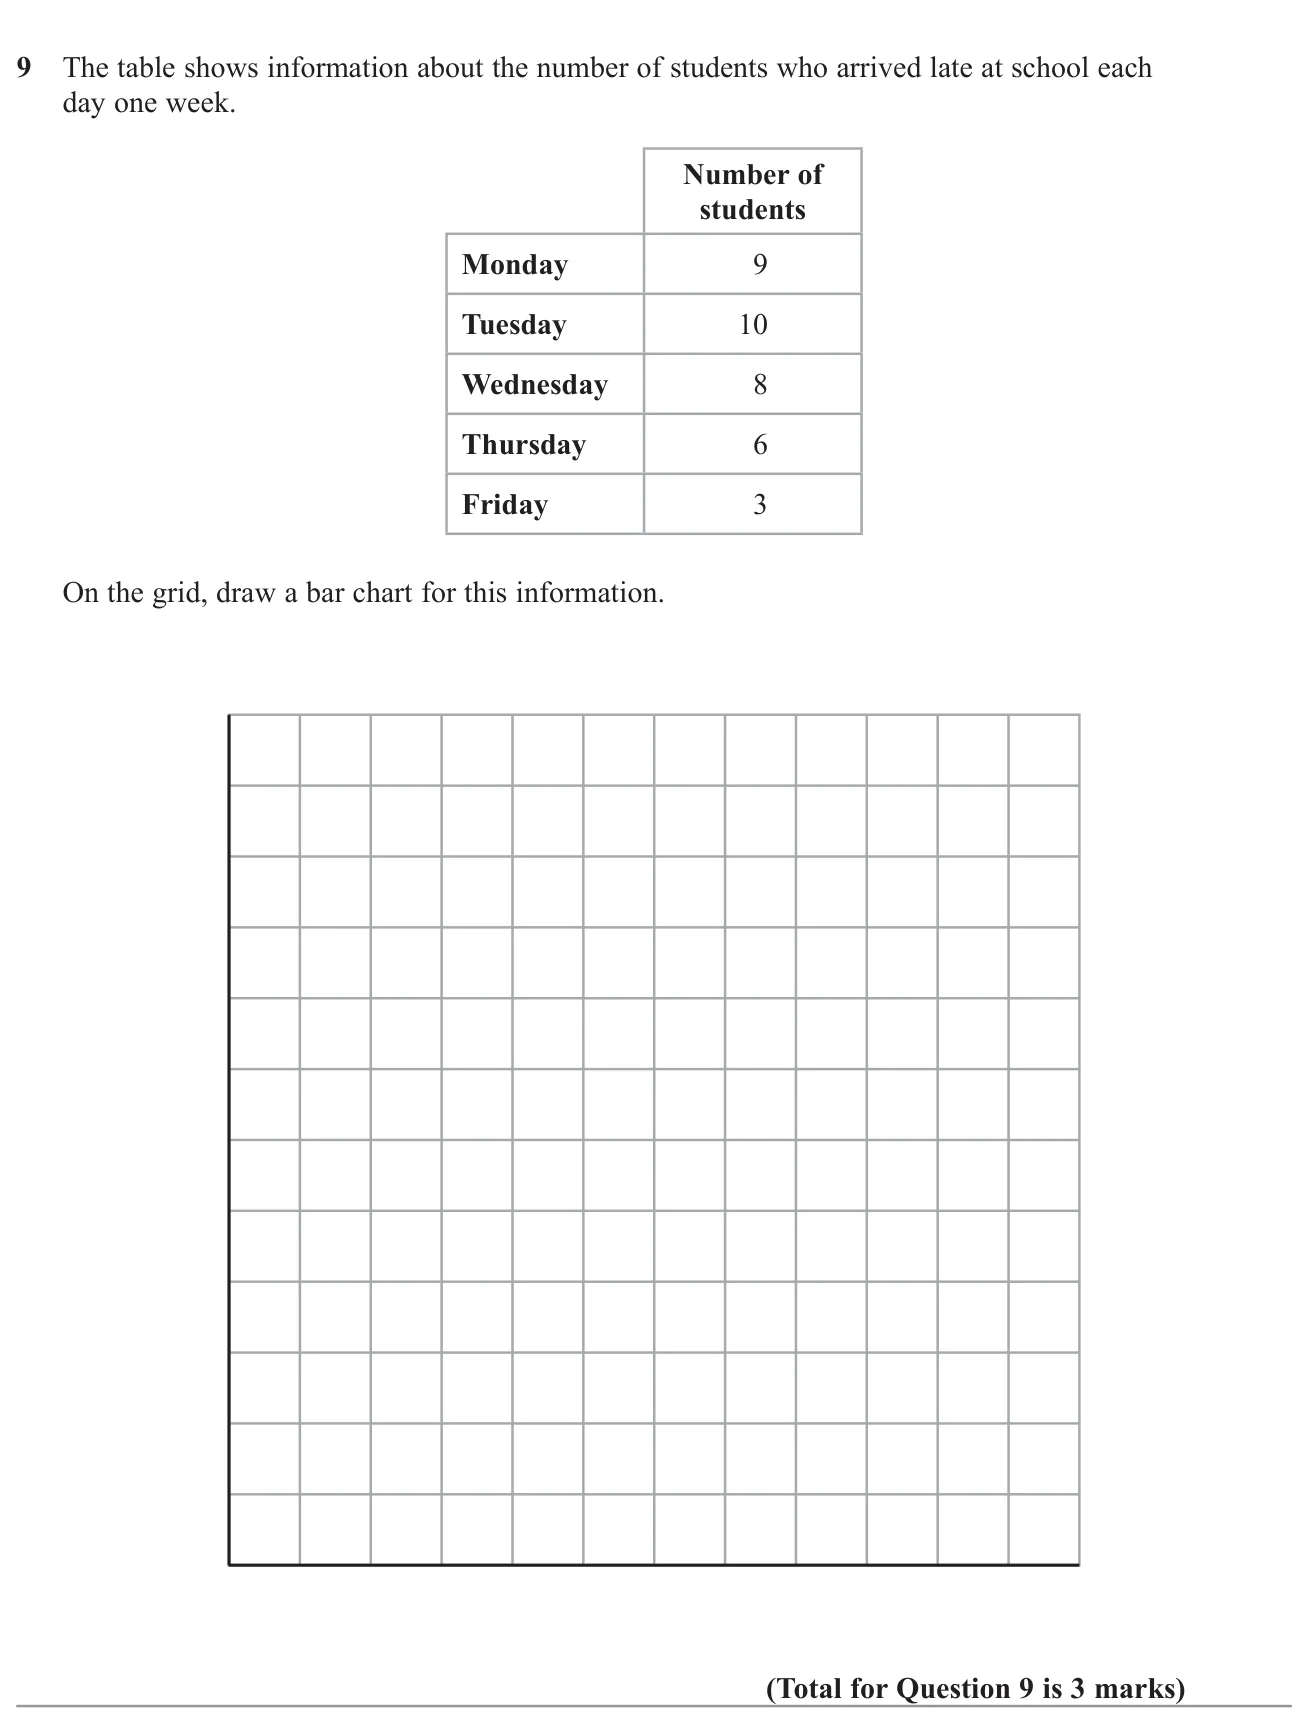
Answer Bar chart with heights 9, 10, 8, 6, 3 for Monday to Friday 3 marks
Worked solution Checked against the mark scheme
Label the horizontal axis with the five days and the vertical axis with a linear scale from 0 to 10.
Draw bars of equal width: Monday 9, Tuesday 10, Wednesday 8, Thursday 6, Friday 3.
Watch out: Using an uneven scale on the vertical axis.
© Pearson Education Ltd. June 2022 Paper 2 (Foundation, calculator), question 13.
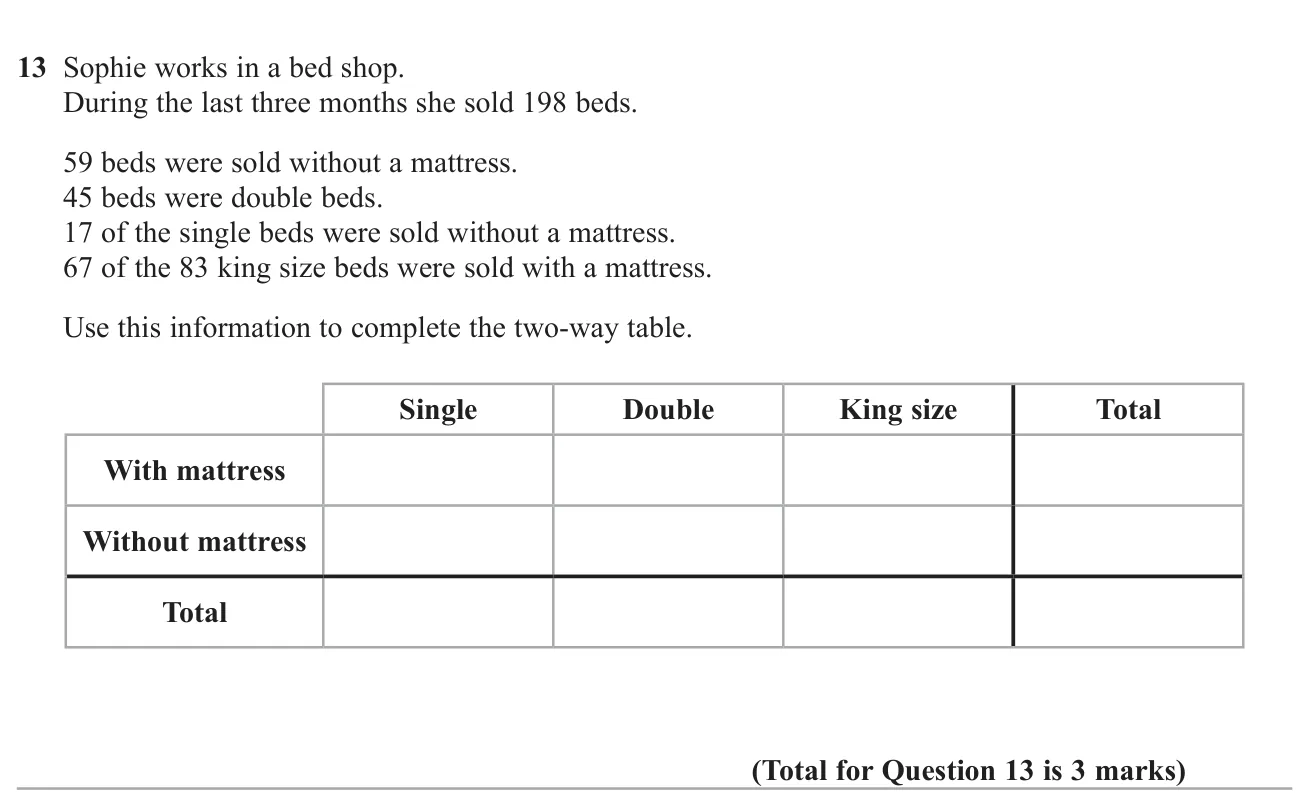
Answer With mattress: 53, 19, 67, 139; without: 17, 26, 16, 59; totals: 70, 45, 83, 198 3 marks
Worked solution Checked against the mark scheme
Put in the given values: total 198, without mattress 59, double total 45, single without 17, king total 83, king with 67.
King without: 83 − 67 = 16 83 - 67 = 16 83 − 67 = 16 198 − 45 − 83 = 70 198 - 45 - 83 = 70 198 − 45 − 83 = 70 = 70 − 17 = 53 = 70 - 17 = 53 = 70 − 17 = 53
Double without: 59 − 17 − 16 = 26 59 - 17 - 16 = 26 59 − 17 − 16 = 26 = 45 − 26 = 19 = 45 - 26 = 19 = 45 − 26 = 19
With mattress total: 198 − 59 = 139 198 - 59 = 139 198 − 59 = 139 53 + 19 + 67 = 139 53 + 19 + 67 = 139 53 + 19 + 67 = 139
Watch out: Placing 67 as the king size total instead of 83.
© Pearson Education Ltd. November 2021 Paper 1 (Foundation, non-calculator), question 11.
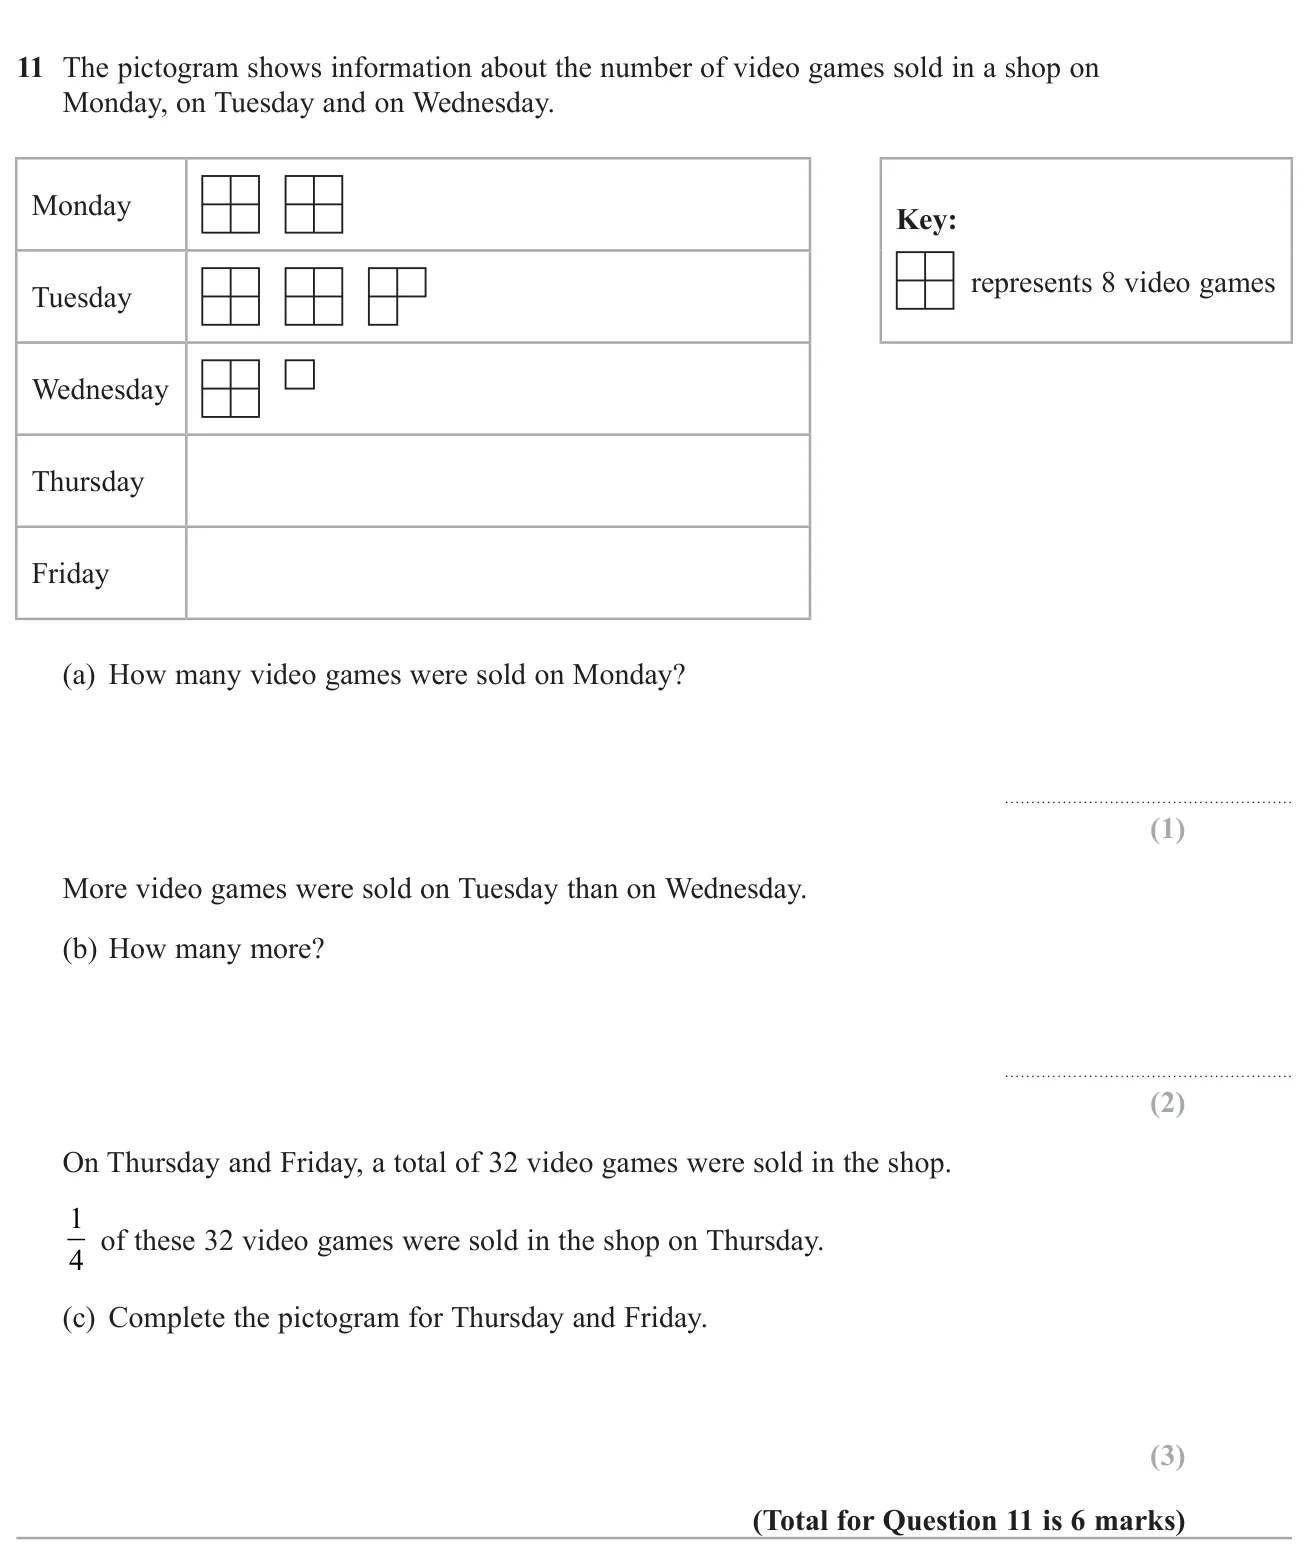
(a) 16 16 16 1 mark (b) 12 12 12 2 marks (c) Thursday: 1 whole symbol (8); Friday: 3 whole symbols (24) 3 marks
Worked solution Checked against the mark scheme
Each symbol is 8 games, so a quarter symbol is 2.
(a) Monday has 2 symbols: 2 × 8 = 16 2 \times 8 = 16 2 × 8 = 16
(b) Tuesday: 8 + 8 + 6 = 22 8 + 8 + 6 = 22 8 + 8 + 6 = 22 8 + 2 = 10 8 + 2 = 10 8 + 2 = 10 22 − 10 = 12 22 - 10 = 12 22 − 10 = 12
(c) Thursday: 1 4 × 32 = 8 \frac{1}{4} \times 32 = 8 4 1 × 32 = 8 32 − 8 = 24 32 - 8 = 24 32 − 8 = 24
Watch out: Counting each part-symbol as a whole symbol.
© Pearson Education Ltd. November 2021 Paper 3 (Foundation, calculator), question 9.
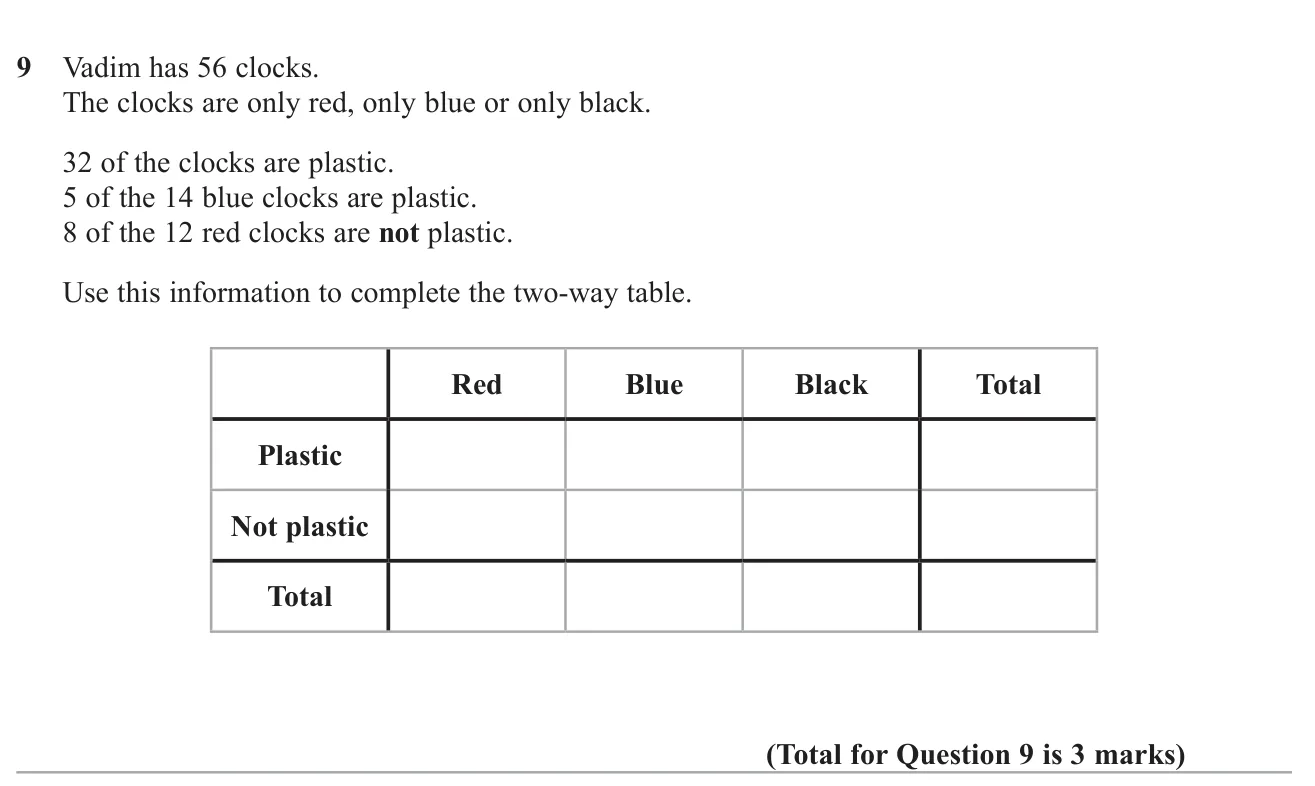
Answer Plastic: 4, 5, 23, 32; Not plastic: 8, 9, 7, 24; Totals: 12, 14, 30, 56 3 marks
Worked solution Checked against the mark scheme
Put in the given values: total 56, plastic total 32, blue total 14, blue plastic 5, red not plastic 8, red total 12.
Red plastic: 12 − 8 = 4 12 - 8 = 4 12 − 8 = 4 14 − 5 = 9 14 - 5 = 9 14 − 5 = 9
Black total: 56 − 12 − 14 = 30 56 - 12 - 14 = 30 56 − 12 − 14 = 30 32 − 4 − 5 = 23 32 - 4 - 5 = 23 32 − 4 − 5 = 23
Black not plastic: 30 − 23 = 7 30 - 23 = 7 30 − 23 = 7 56 − 32 = 24 56 - 32 = 24 56 − 32 = 24
Watch out: Putting the given numbers in the wrong row, e.g. writing 8 as red plastic.
© Pearson Education Ltd. November 2020 Paper 1 (Foundation, non-calculator), question 7.
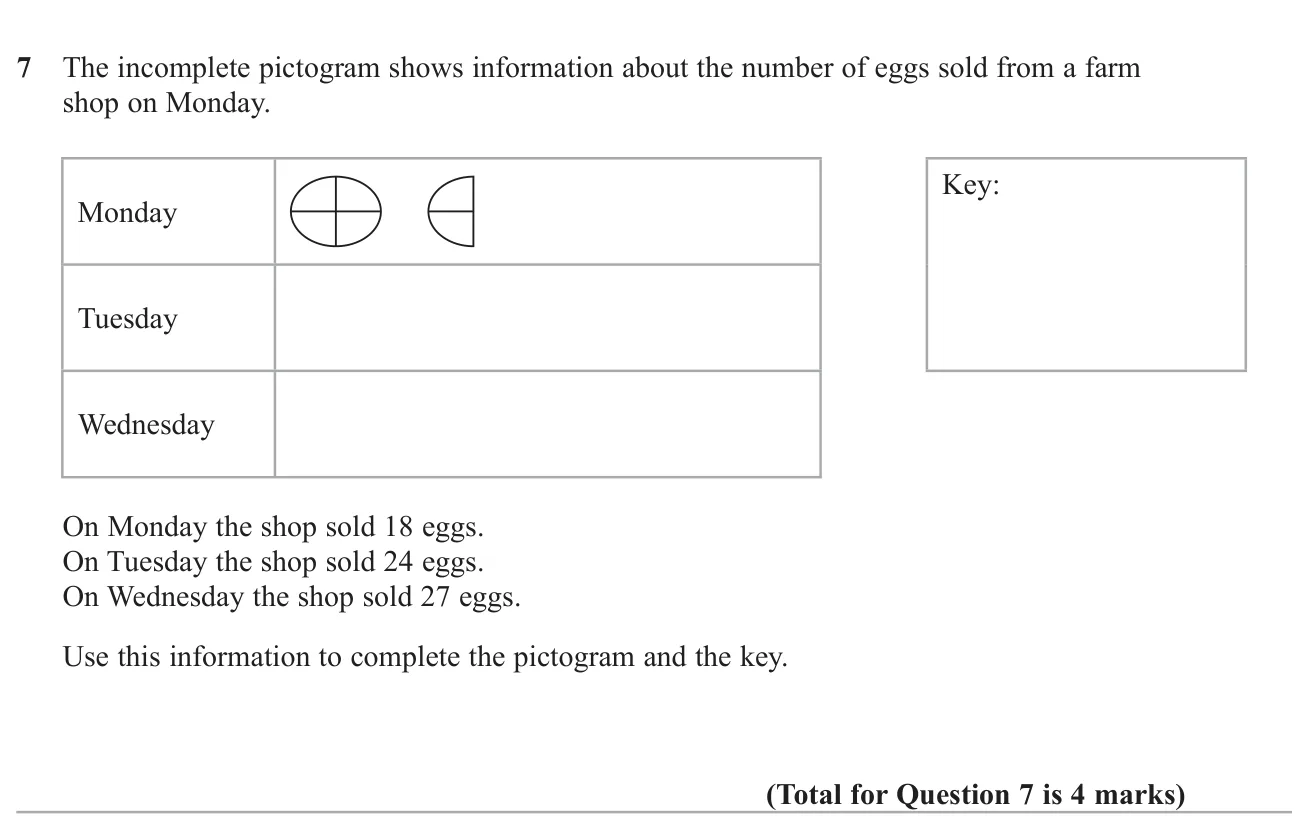
Answer Key: one oval = 12 eggs; Tuesday 2 ovals; Wednesday 2 1 4 2\frac{1}{4} 2 4 1 4 marks
Worked solution Checked against the mark scheme
Monday shows 1 1 2 1\frac{1}{2} 1 2 1 18 ÷ 1.5 = 12 18 \div 1.5 = 12 18 ÷ 1.5 = 12
Tuesday: 24 ÷ 12 = 2 24 \div 12 = 2 24 ÷ 12 = 2
Wednesday: 27 ÷ 12 = 2 1 4 27 \div 12 = 2\frac{1}{4} 27 ÷ 12 = 2 4 1
Key: one oval represents 12 eggs.
Watch out: Taking one oval as 18 eggs because of Monday's total.
© Pearson Education Ltd. November 2020 Paper 1 (Foundation, non-calculator), question 14.
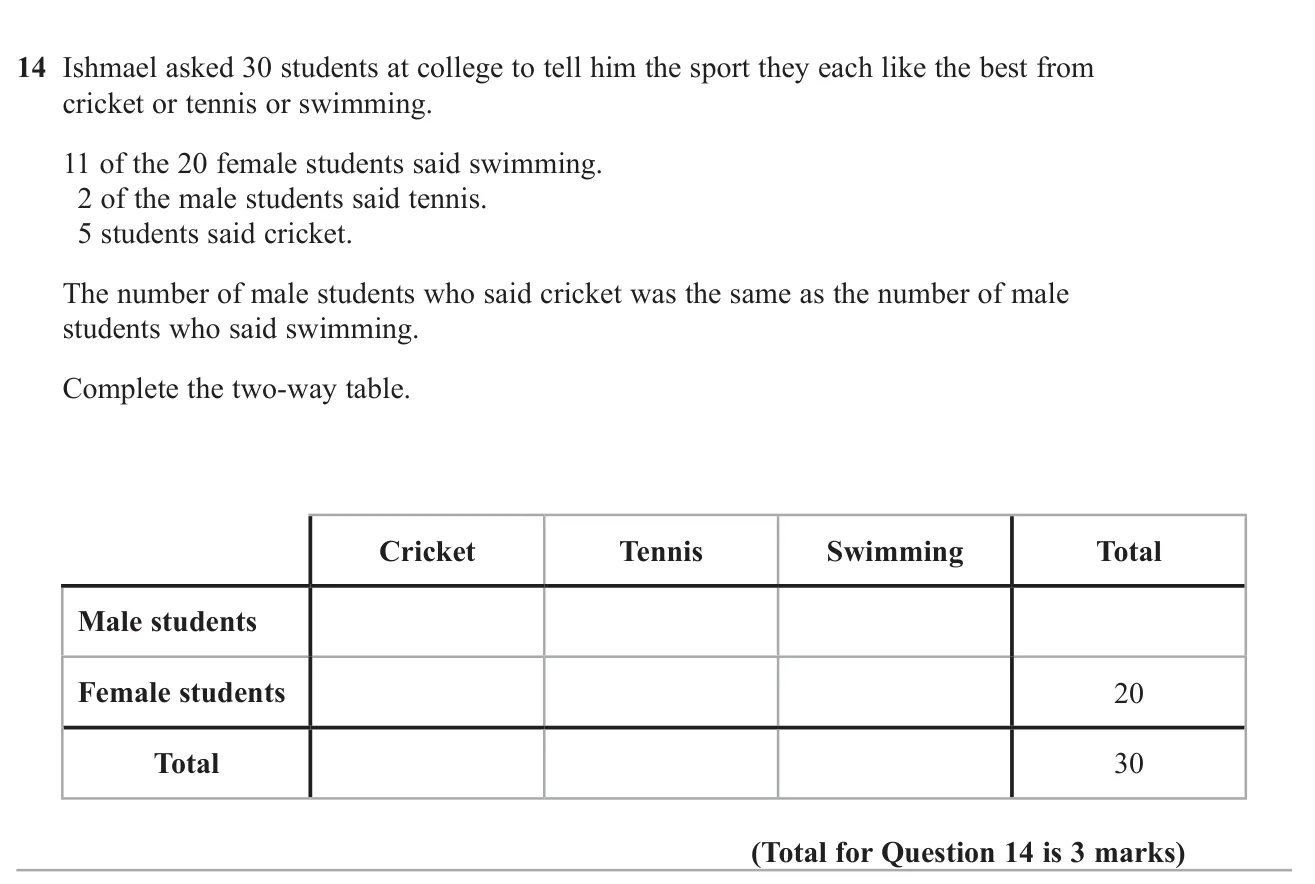
Answer Male: 4, 2, 4 (10); Female: 1, 8, 11 (20); Totals: 5, 10, 15 (30) 3 marks
Worked solution Checked against the mark scheme
Males: 30 − 20 = 10 30 - 20 = 10 30 − 20 = 10
Females: cricket 5 − 4 = 1 5 - 4 = 1 5 − 4 = 1 20 − 1 − 11 = 8 20 - 1 - 11 = 8 20 − 1 − 11 = 8
Totals: cricket 5, tennis 2 + 8 = 10 2 + 8 = 10 2 + 8 = 10 4 + 11 = 15 4 + 11 = 15 4 + 11 = 15
Watch out: Putting all 5 cricket players in the male row.
© Pearson Education Ltd. November 2020 Paper 2 (Foundation, calculator), question 7.
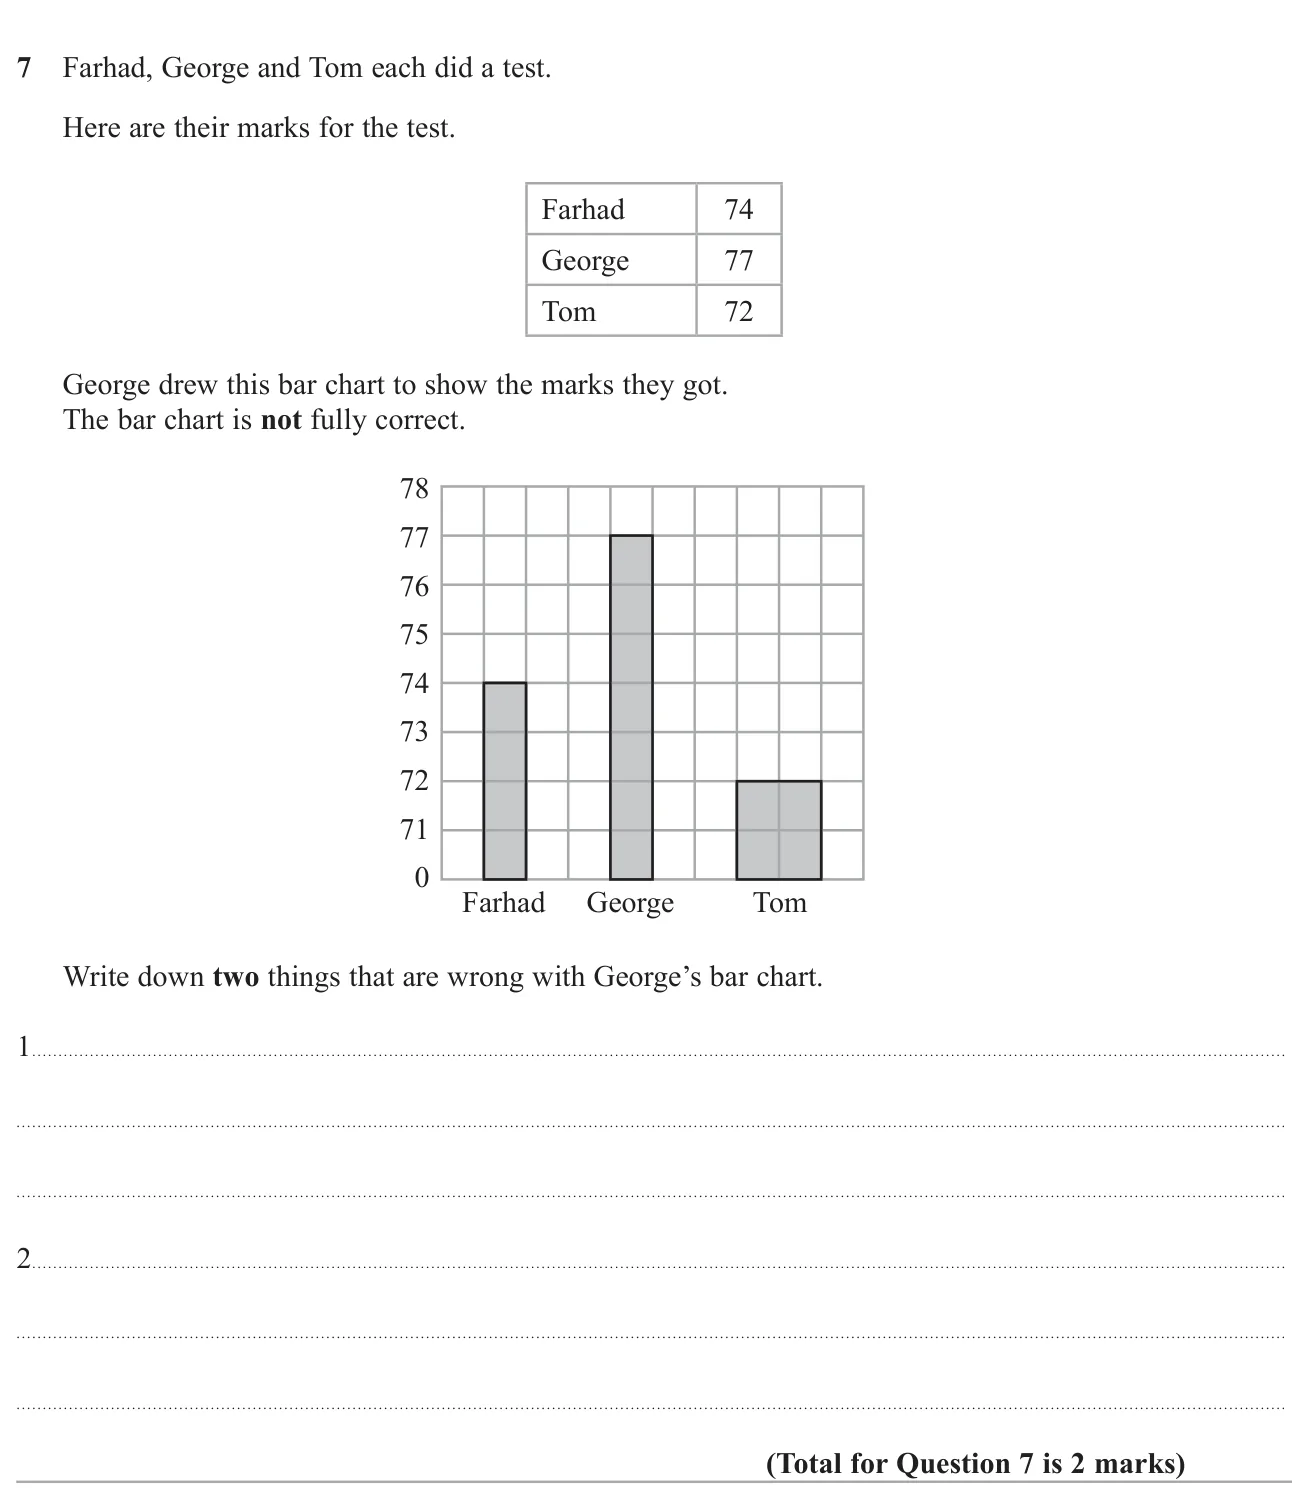
Answer Any two of: the vertical axis has no label; the scale jumps from 0 to 71; Tom's bar is wider than the others 2 marks
Worked solution Checked against the mark scheme
Check the chart against good practice:
- The vertical axis has no label (e.g. 'Mark').
Any two of these earn the marks.
Watch out: Saying the chart has no title, which is not accepted.
© Pearson Education Ltd. November 2019 Paper 1 (Foundation, non-calculator), question 6.
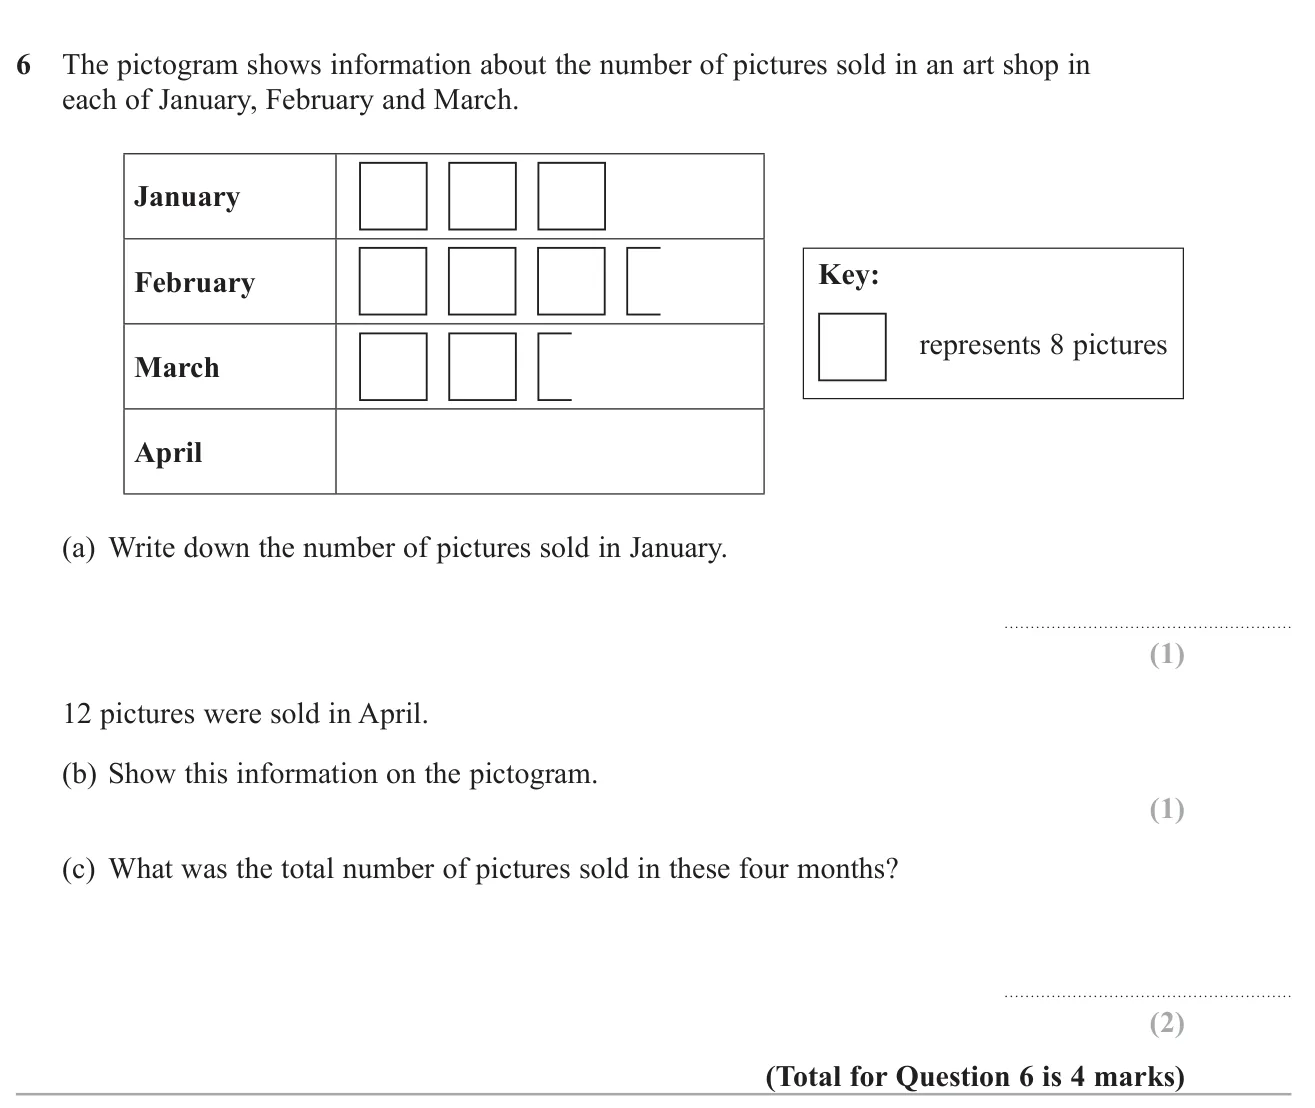
(a) 24 24 24 1 mark (b) One and a half symbols in the April row 1 mark (c) 84 84 84 2 marks
Worked solution Checked against the mark scheme
(a) January has 3 whole squares: 3 × 8 = 24 3 \times 8 = 24 3 × 8 = 24
(b) 12 = 8 + 4 12 = 8 + 4 12 = 8 + 4
(c) February 3.5 × 8 = 28 3.5 \times 8 = 28 3.5 × 8 = 28 2.5 × 8 = 20 2.5 \times 8 = 20 2.5 × 8 = 20
Total = 24 + 28 + 20 + 12 = 84 = 24 + 28 + 20 + 12 = 84 = 24 + 28 + 20 + 12 = 84
Watch out: Treating a half symbol as 1 picture or forgetting to include April.
© Pearson Education Ltd. June 2019 Paper 1 (Foundation, non-calculator), question 7.
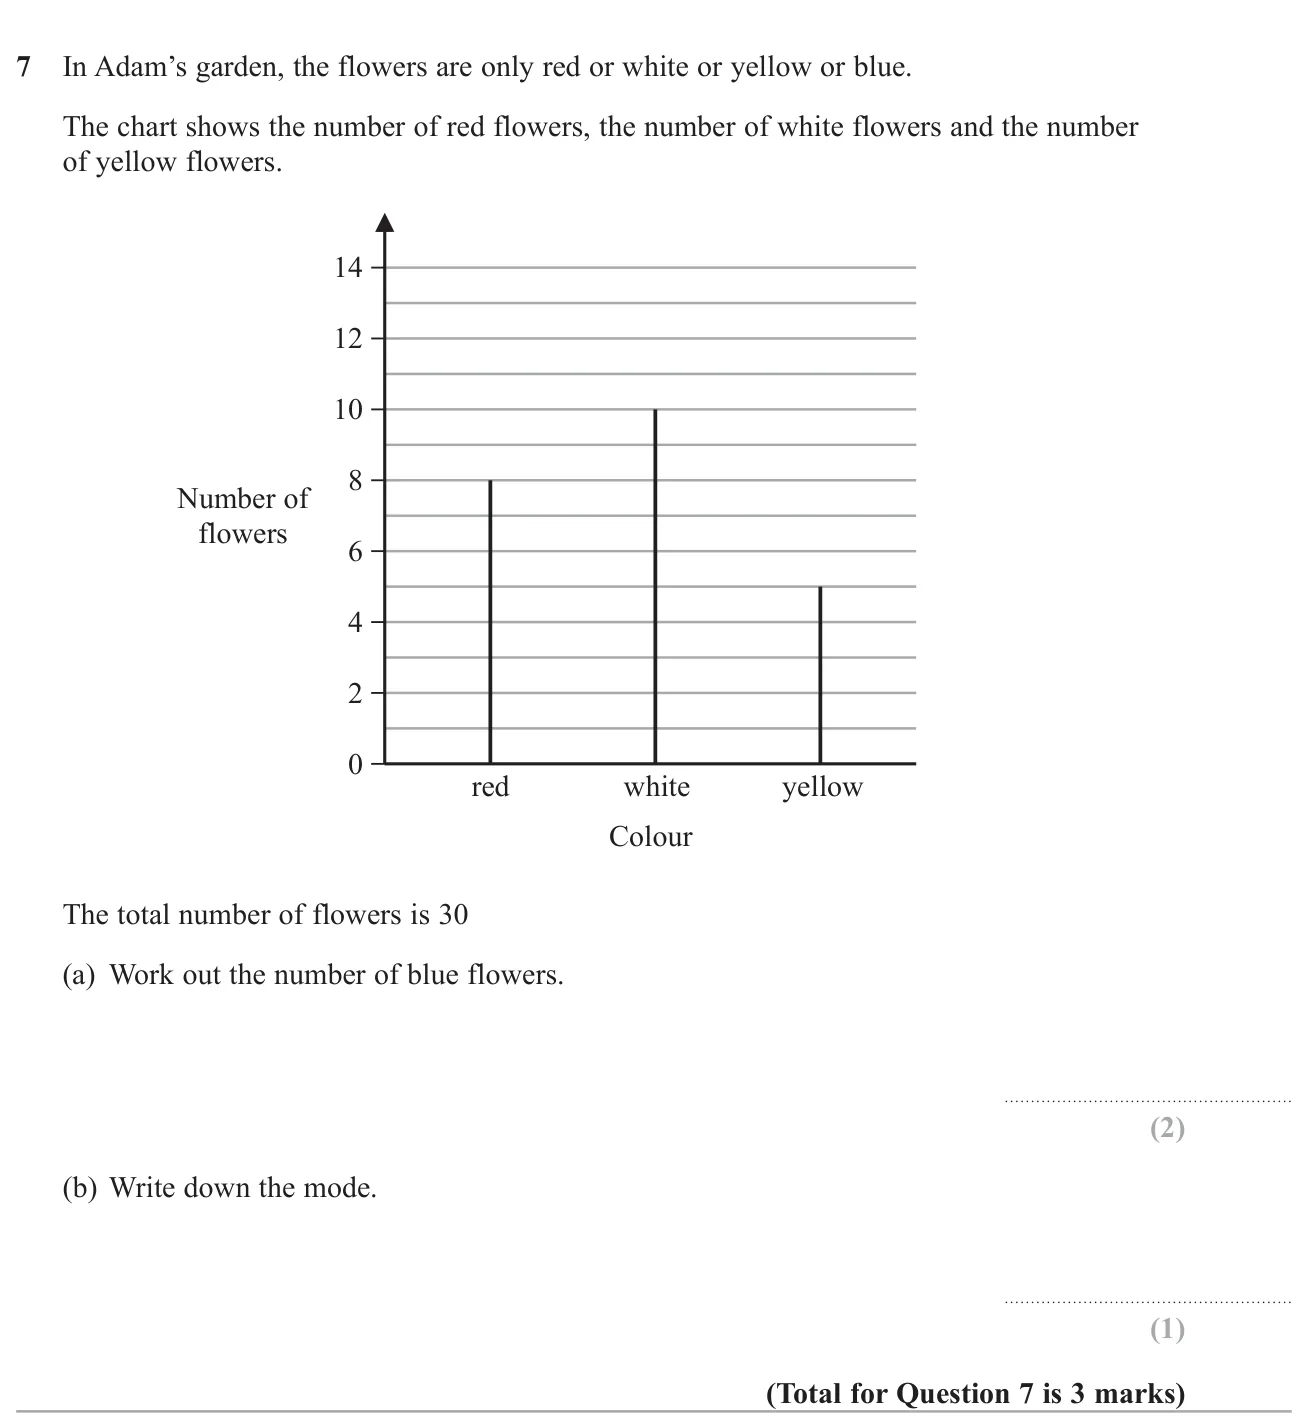
(a) 7 2 marks (b) white 1 mark
Worked solution Checked against the mark scheme
(a) From the chart: red 8, white 10, yellow 5.
Blue = 30 − 8 − 10 − 5 = 7 = 30 - 8 - 10 - 5 = 7 = 30 − 8 − 10 − 5 = 7
(b) White has the most flowers (10), so the mode is white.
Watch out: Giving the mode as the number 10 rather than the colour.
© Pearson Education Ltd. June 2019 Paper 2 (Foundation, calculator), question 9.
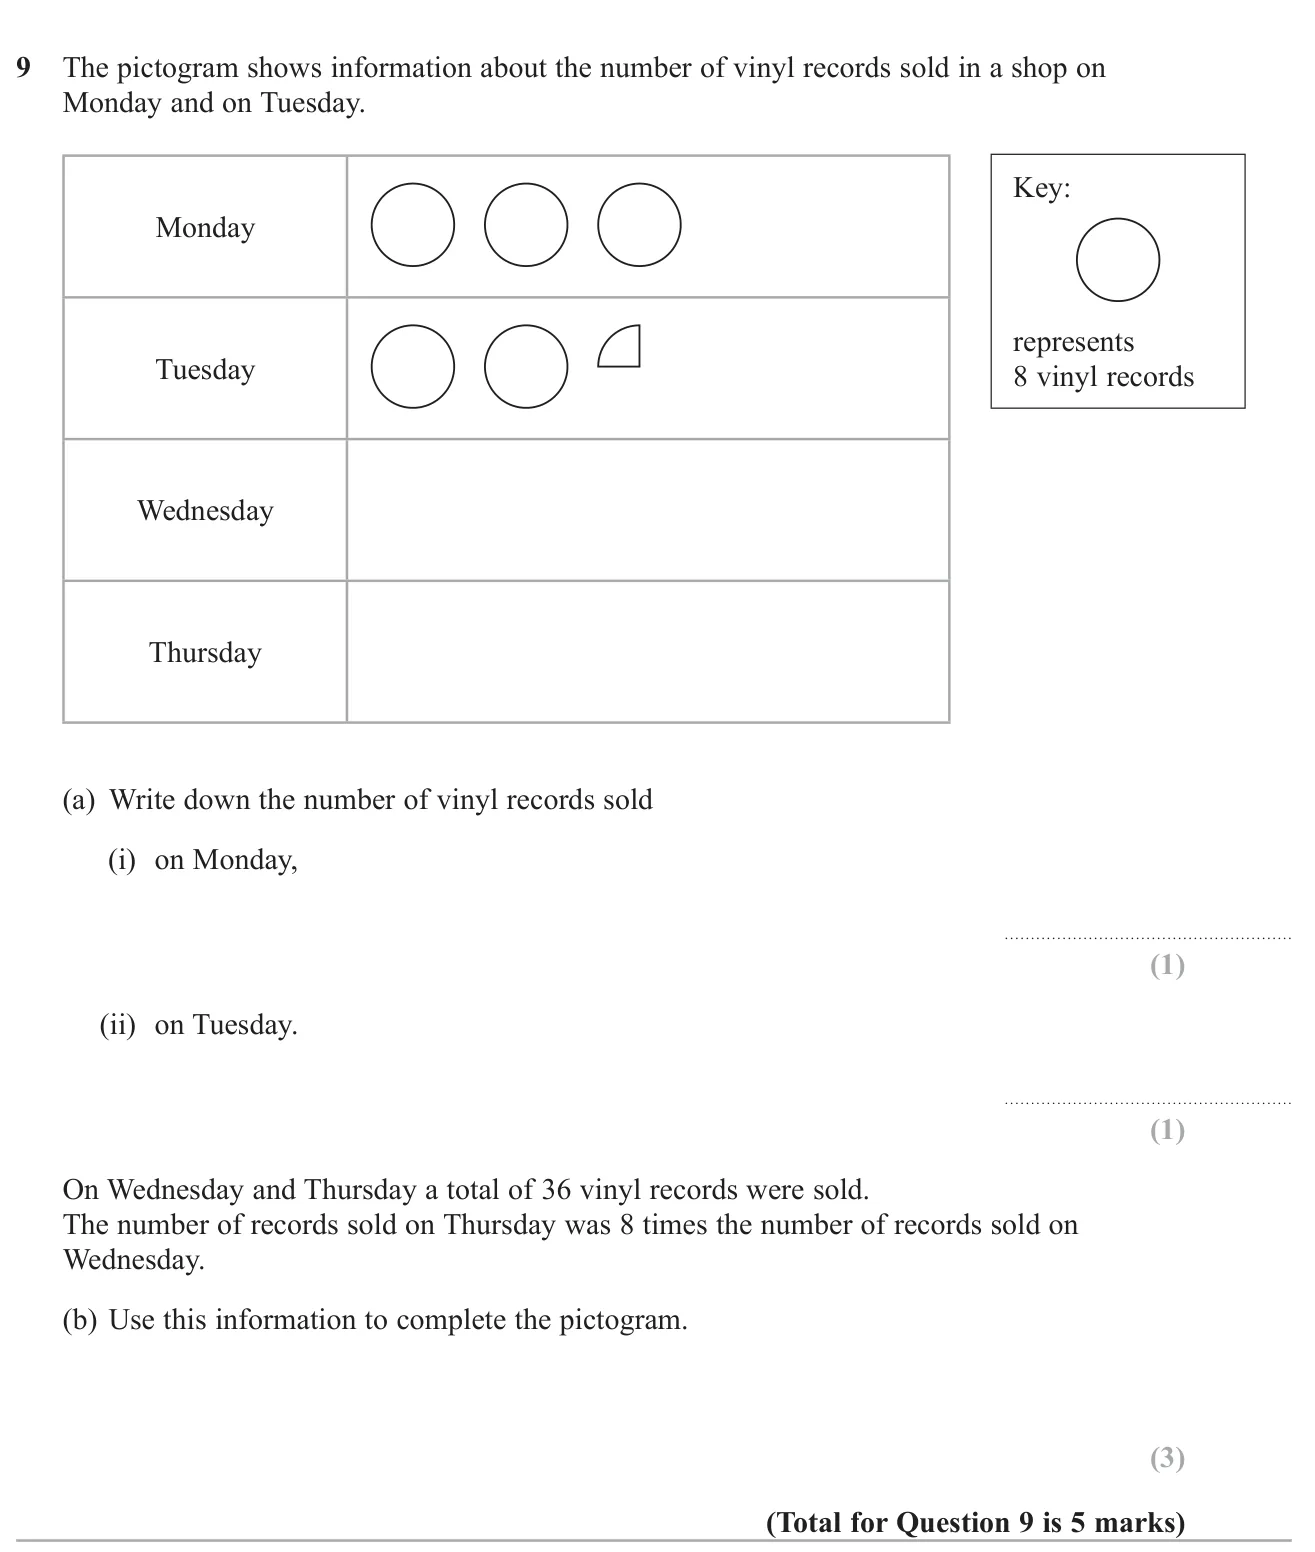
(a(i)) 24 1 mark (a(ii)) 18 1 mark (b) Wednesday: half a circle (4 records); Thursday: 4 circles (32 records) 3 marks
Worked solution Checked against the mark scheme
(a)(i) 3 circles: 3 × 8 = 24 3 \times 8 = 24 3 × 8 = 24
(a)(ii) 2 circles and a quarter: 2 × 8 + 2 = 18 2 \times 8 + 2 = 18 2 × 8 + 2 = 18
(b) Wednesday is 1 part and Thursday 8 parts, so 9 parts make 36: 36 ÷ 9 = 4 36 \div 9 = 4 36 ÷ 9 = 4
Wednesday 4, Thursday 8 × 4 = 32 8 \times 4 = 32 8 × 4 = 32
Draw half a circle for Wednesday (4 = 1 2 × 8 4 = \frac{1}{2} \times 8 4 = 2 1 × 8 32 ÷ 8 = 4 32 \div 8 = 4 32 ÷ 8 = 4
Watch out: In (b), dividing 36 by 8 instead of by 9.
© Pearson Education Ltd. November 2019 Paper 3 (Foundation, calculator), question 9.
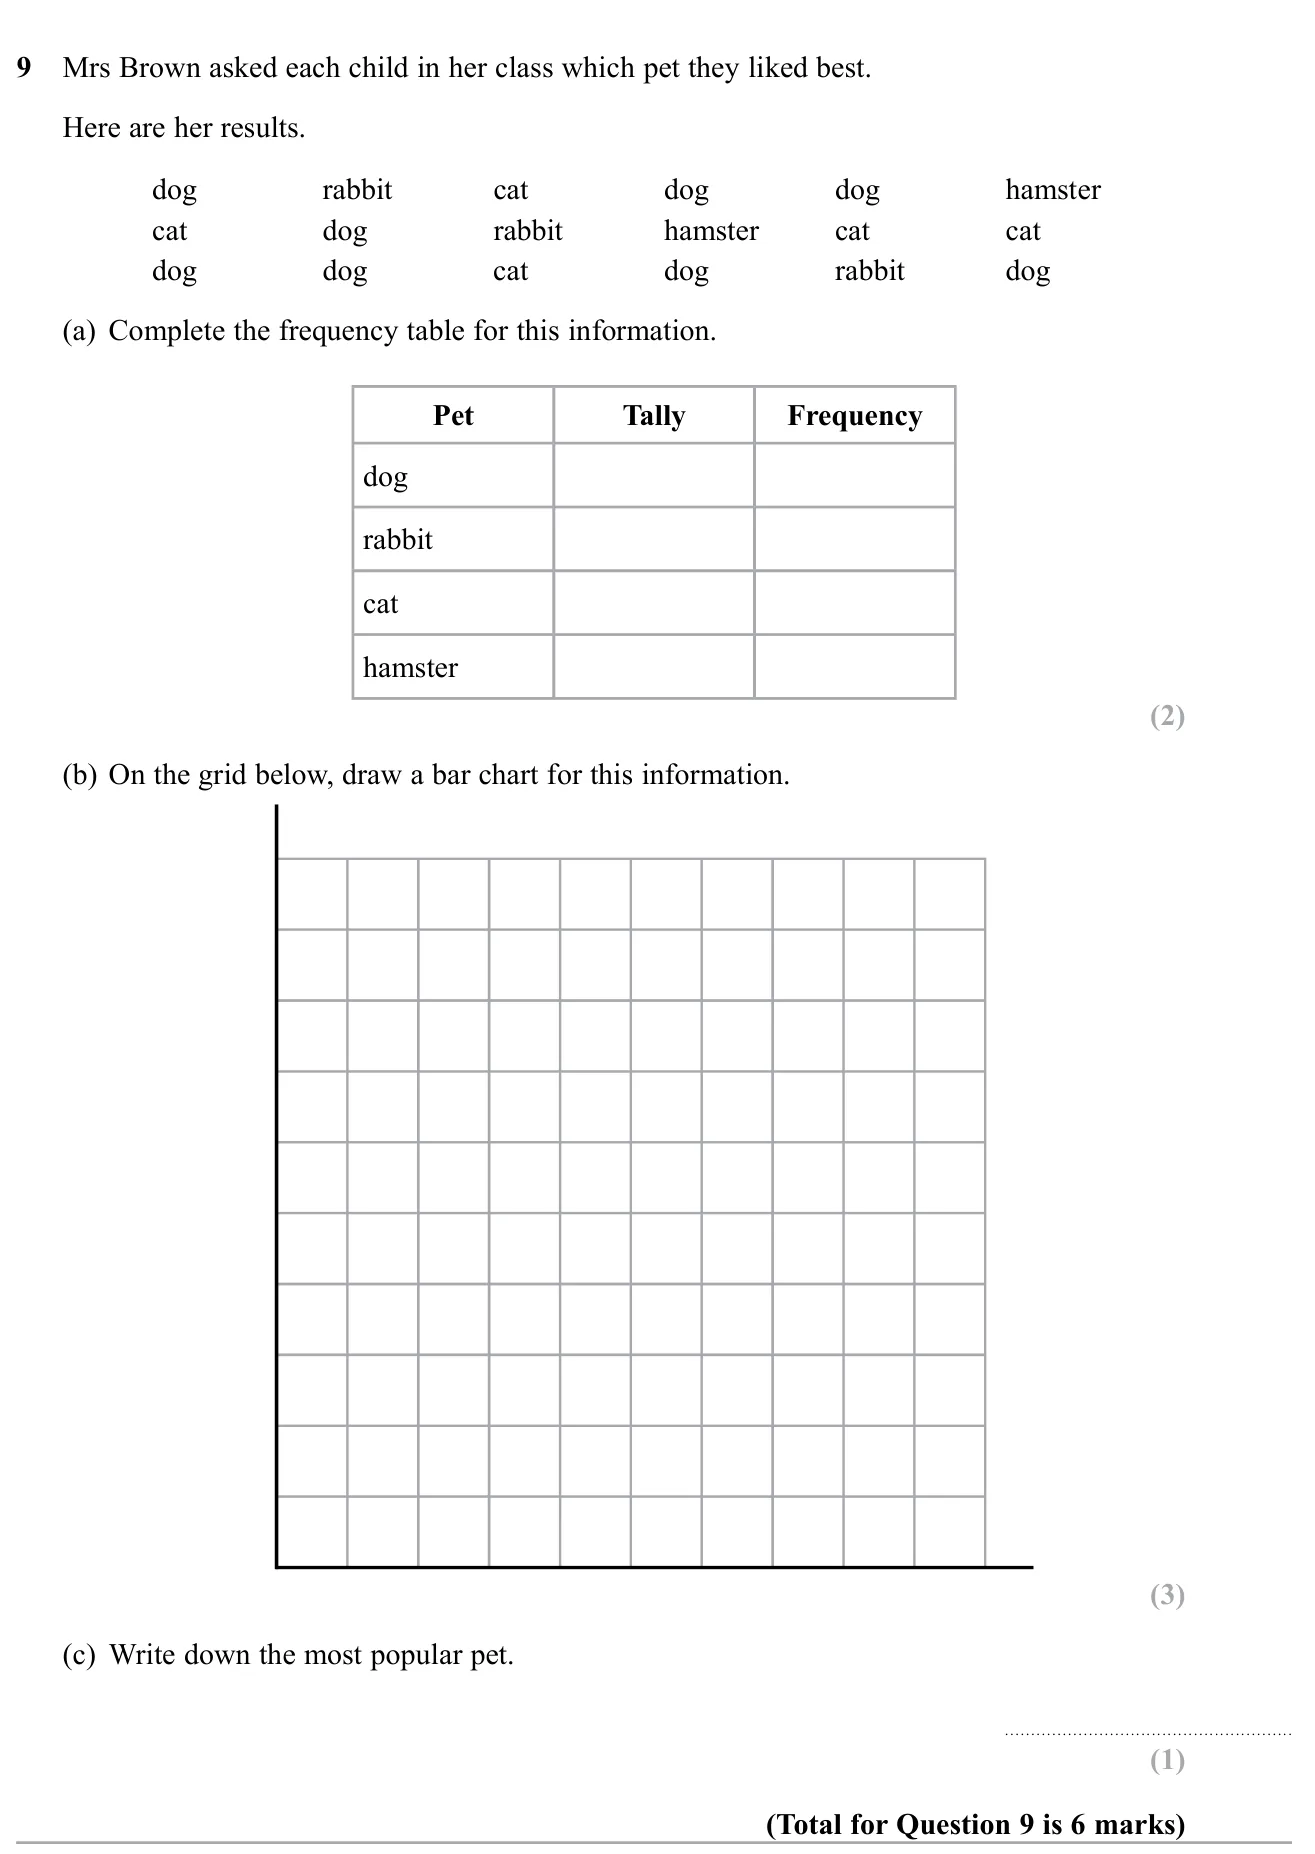
(a) dog 8, rabbit 3, cat 5, hamster 2 2 marks (b) Bar chart with heights 8, 3, 5, 2 3 marks (c) dog 1 mark
Worked solution Checked against the mark scheme
(a) Count each pet: dog 8, rabbit 3, cat 5, hamster 2 (total 18).
(b) Put the pets along the bottom, a frequency scale going up in 1s, and draw bars of heights 8, 3, 5 and 2.
(c) Dog has the tallest bar, so it is the most popular.
Watch out: Miscounting the list, so the frequencies do not add up to 18.
© Pearson Education Ltd. June 2024 Paper 3 (Foundation, calculator), question 13.
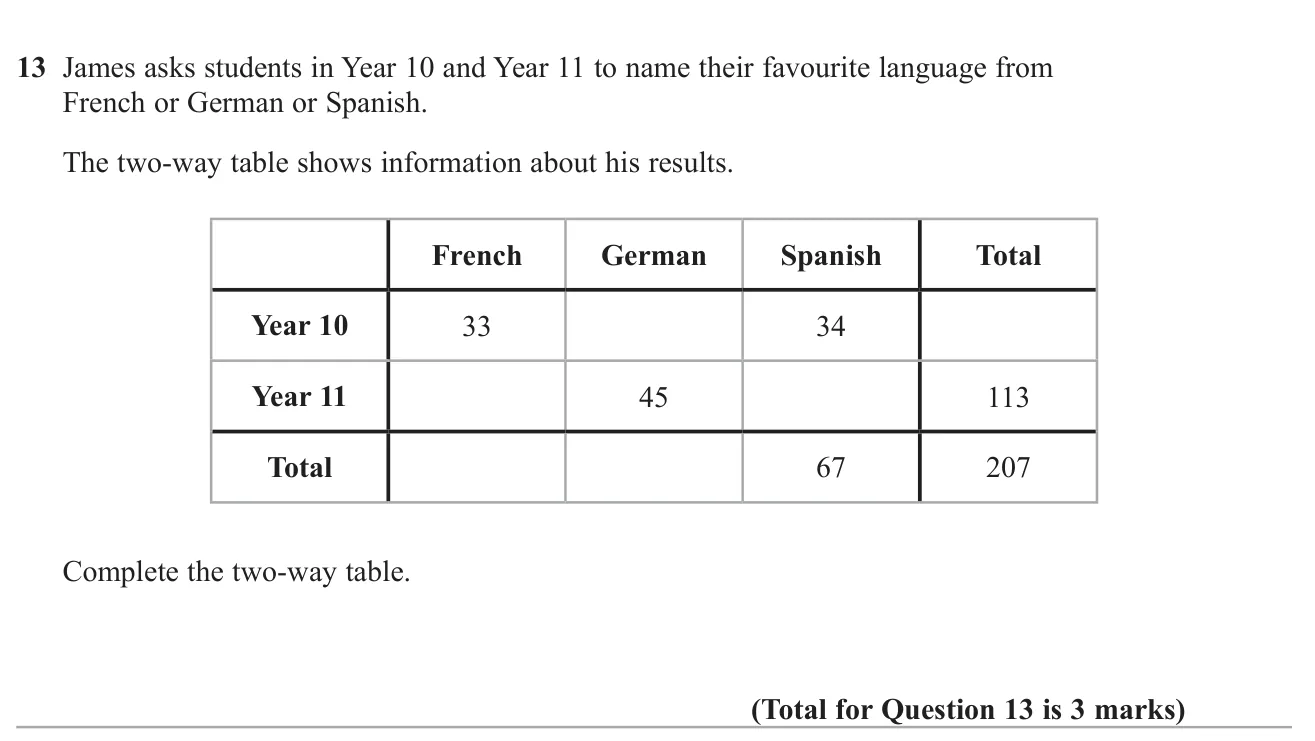
Answer Year 10: French 33, German 27, Spanish 34, Total 94; Year 11: French 35, German 45, Spanish 33, Total 113; Totals: 68, 72, 67, 207 3 marks
Worked solution Checked against the mark scheme
Spanish Year 11: 67 − 34 = 33 67 - 34 = 33 67 − 34 = 33
French Year 11: 113 − 45 − 33 = 35 113 - 45 - 33 = 35 113 − 45 − 33 = 35
Year 10 total: 207 − 113 = 94 207 - 113 = 94 207 − 113 = 94
German Year 10: 94 − 33 − 34 = 27 94 - 33 - 34 = 27 94 − 33 − 34 = 27
French total: 33 + 35 = 68 33 + 35 = 68 33 + 35 = 68 27 + 45 = 72 27 + 45 = 72 27 + 45 = 72 68 + 72 + 67 = 207 68 + 72 + 67 = 207 68 + 72 + 67 = 207
Watch out: Filling a cell before enough information is known and then not checking the totals.
© Pearson Education Ltd. June 2024 Paper 1 (Foundation, non-calculator), question 7.
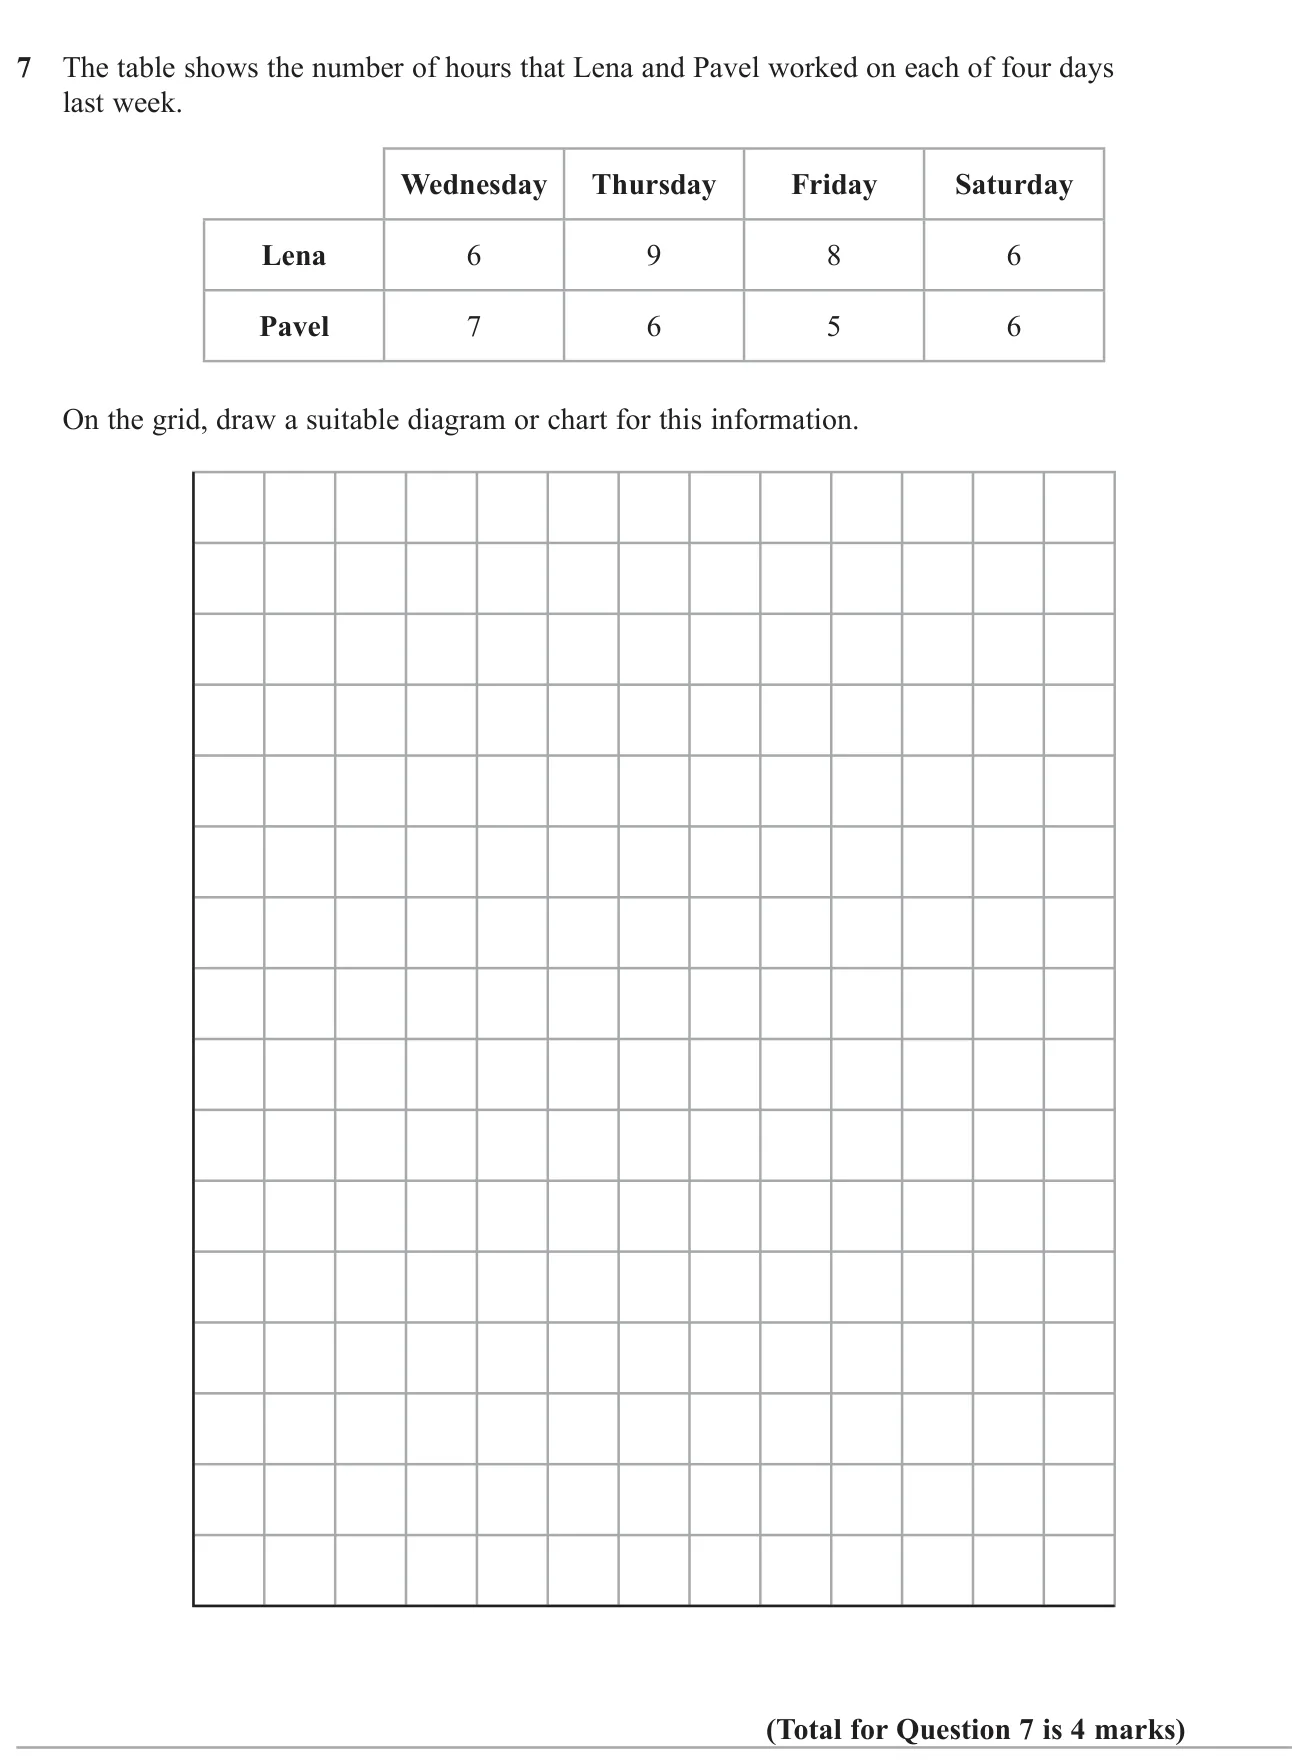
Answer A dual bar chart (or similar) with days labelled, a linear hours scale from 0 and a key for Lena and Pavel 4 marks
Worked solution Checked against the mark scheme
Draw a dual bar chart : days along the horizontal axis, hours (0 to 10) up the vertical axis.
For each day draw two bars side by side, e.g. Wednesday: Lena 6, Pavel 7.
Add a key showing which bar is Lena and which is Pavel, and label the vertical axis 'Hours'.
Watch out: Leaving out the key or using a scale that is not evenly spaced.
© Pearson Education Ltd. June 2024 Paper 3 (Foundation, calculator), question 14.
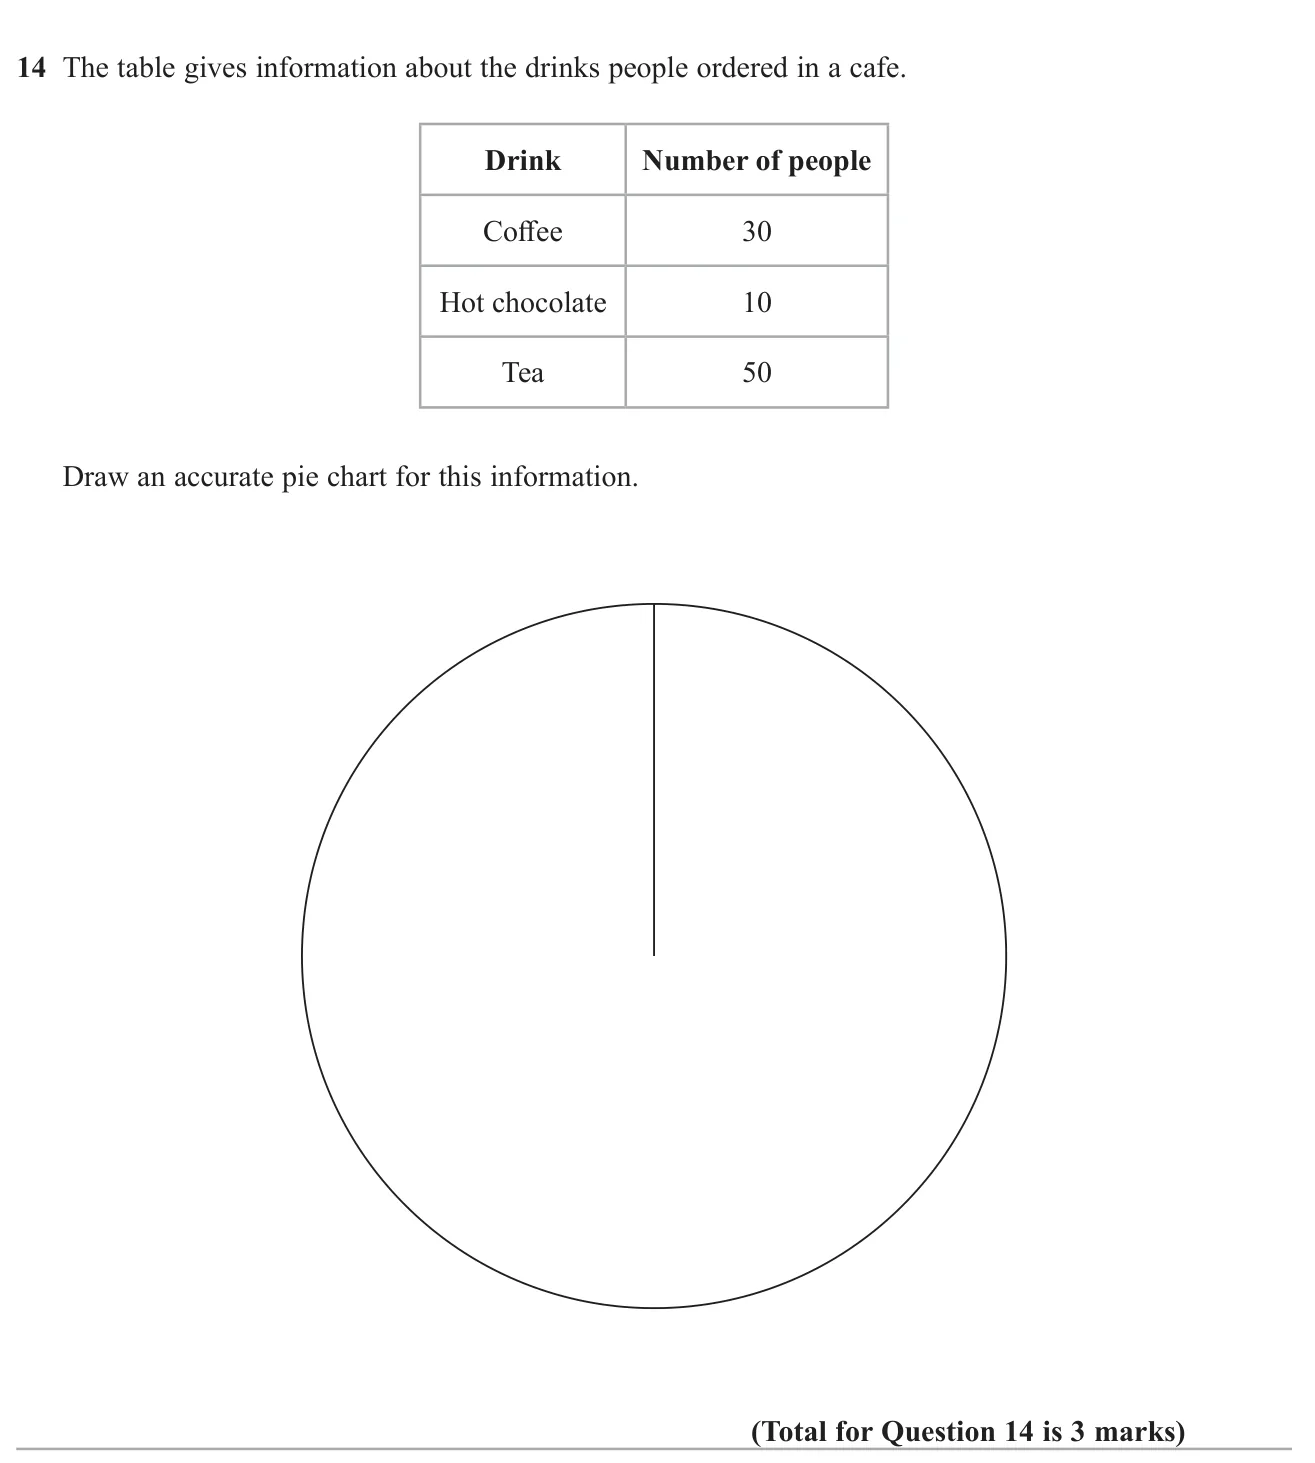
Answer Pie chart with Coffee 120 ° 120° 120° 40 ° 40° 40° 200 ° 200° 200° 3 marks
Worked solution Checked against the mark scheme
Total people: 30 + 10 + 50 = 90 30 + 10 + 50 = 90 30 + 10 + 50 = 90
Each person: 360 ÷ 90 = 4 ° 360 \div 90 = 4° 360 ÷ 90 = 4°
Coffee 30 × 4 = 120 ° 30 \times 4 = 120° 30 × 4 = 120° 10 × 4 = 40 ° 10 \times 4 = 40° 10 × 4 = 40° 50 × 4 = 200 ° 50 \times 4 = 200° 50 × 4 = 200°
Draw each angle with a protractor and label each sector with the drink.
Watch out: Labelling sectors with angles instead of drink names.
© Pearson Education Ltd. November 2023 Paper 2 (Foundation, calculator), question 17.
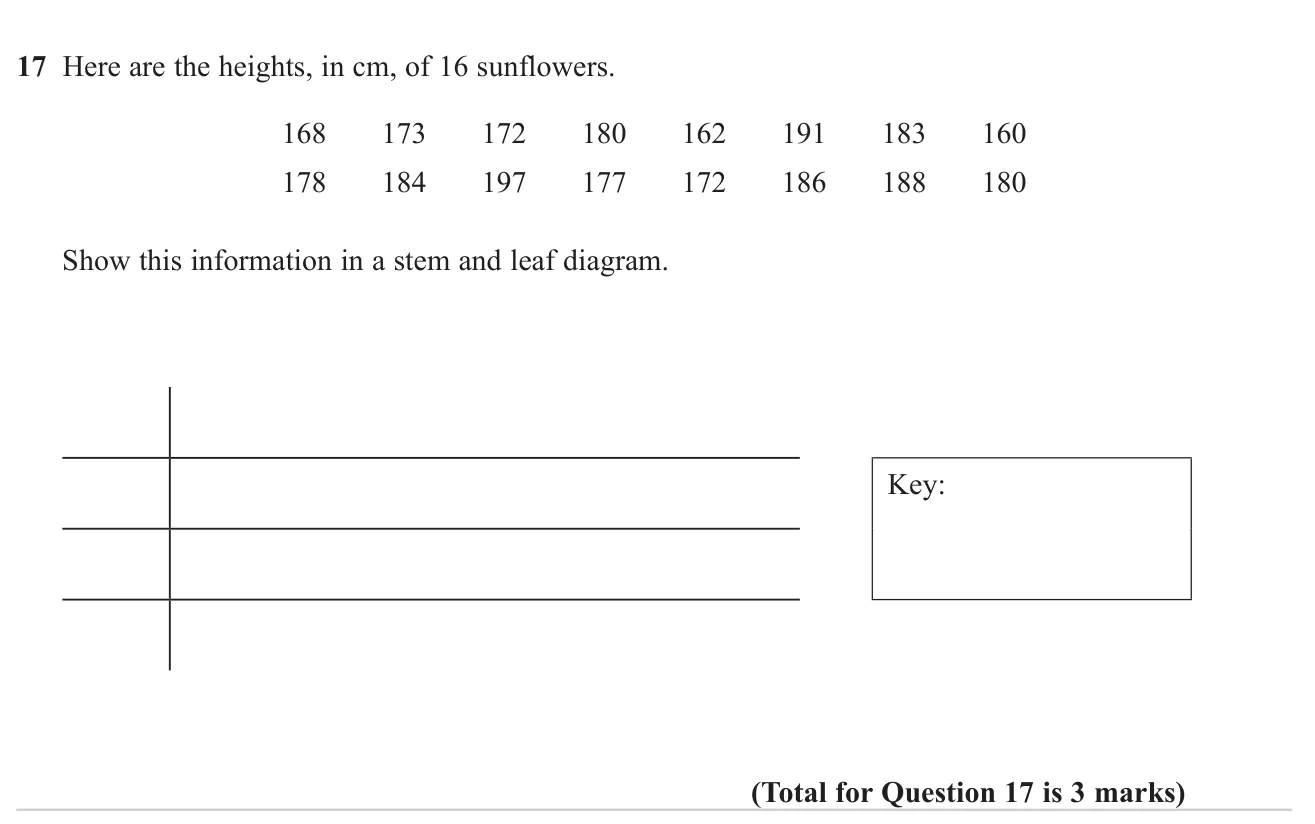
Answer 16 | 0 2 8; 17 | 2 2 3 7 8; 18 | 0 0 3 4 6 8; 19 | 1 7; Key: 16 | 0 means 160 cm 3 marks
Worked solution Checked against the mark scheme
Use the tens-and-hundreds digits as the stem (16, 17, 18, 19) and the units as leaves.
16 | 0 2 8
17 | 2 2 3 7 8
18 | 0 0 3 4 6 8
19 | 1 7
Key: 16 | 0 means 160 cm. Check there are 16 leaves in total.
Watch out: Leaving the leaves out of order or forgetting the key.
© Pearson Education Ltd. June 2023 Paper 3 (Foundation, calculator), question 12.
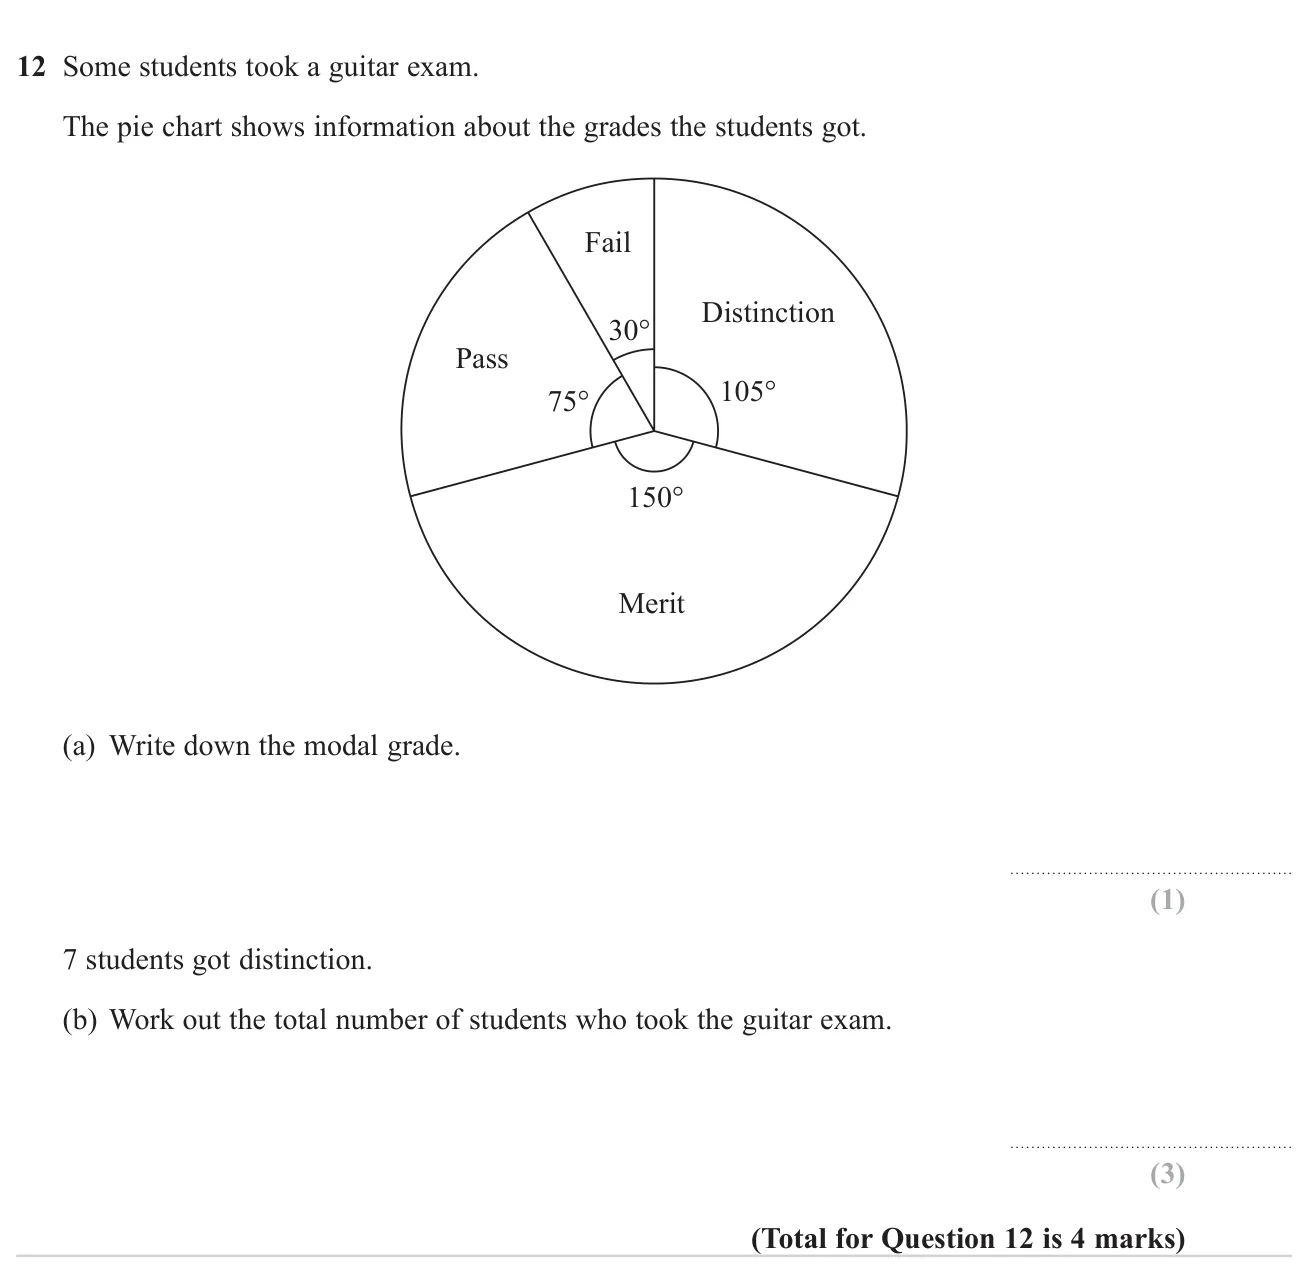
(a) Merit 1 mark (b) 24 3 marks
Worked solution Checked against the mark scheme
(a) The largest sector (150°) is Merit.
(b) Distinction is 105° for 7 students, so each student is 105 ÷ 7 = 15 ° 105 \div 7 = 15° 105 ÷ 7 = 15°
Total = 360 ÷ 15 = 24 = 360 \div 15 = 24 = 360 ÷ 15 = 24
Watch out: Giving the angle 150° as the mode instead of the grade.
© Pearson Education Ltd. November 2022 Paper 1 (Foundation, non-calculator), question 13.
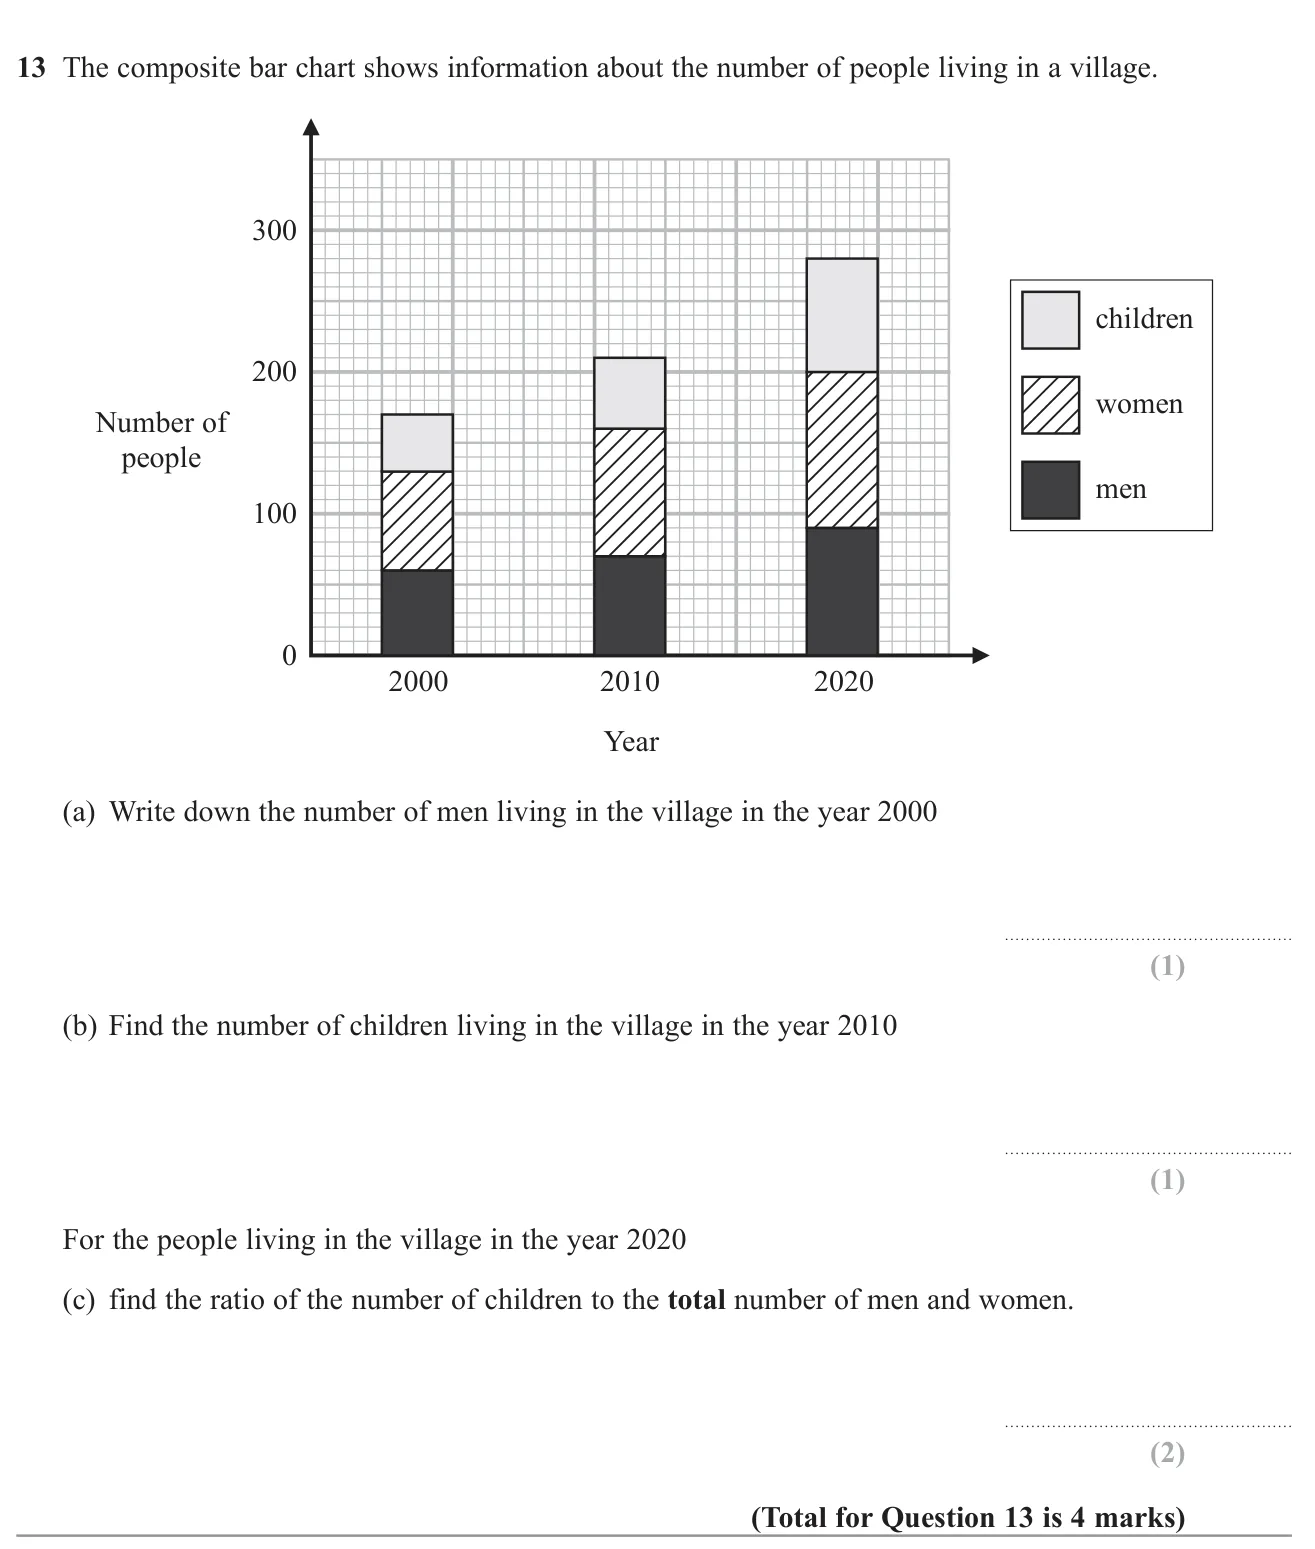
(a) 60 60 60 1 mark (b) 50 50 50 1 mark (c) 80 : 200 80 : 200 80 : 200 2 : 5 2 : 5 2 : 5 2 marks
Worked solution Checked against the mark scheme
(a) The men bar for 2000 reaches 60.
(b) In 2010 the bar goes from 160 to 210: 210 − 160 = 50 210 - 160 = 50 210 − 160 = 50
(c) 2020: men and women together reach 200; children go from 200 to 280, so 80.
Ratio 80 : 200 = 2 : 5 80 : 200 = 2 : 5 80 : 200 = 2 : 5
Watch out: In (b), reading the top of the bar (210) instead of the height of the children section.
© Pearson Education Ltd. June 2022 Paper 1 (Foundation, non-calculator), question 21.
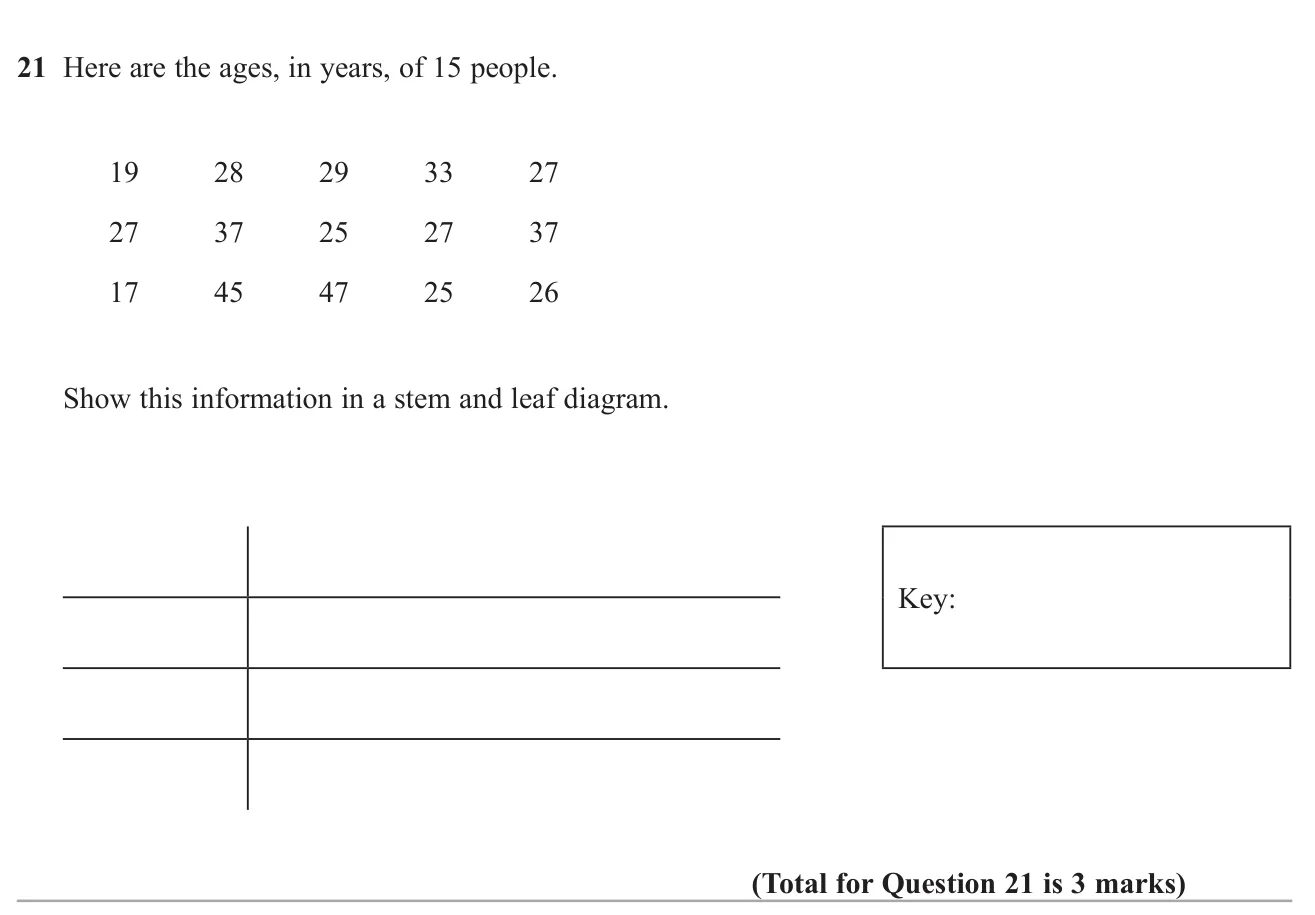
Answer 1 | 7 9; 2 | 5 5 6 7 7 7 8 9; 3 | 3 7 7; 4 | 5 7, with key such as 2 | 5 = 25 years 3 marks
Worked solution Checked against the mark scheme
Use the tens digit as the stem and the units digit as the leaf, then put the leaves in order:
1 | 7 9
2 | 5 5 6 7 7 7 8 9
3 | 3 7 7
4 | 5 7
Key: 2 | 5 means 25 years
Watch out: Forgetting the key or leaving the leaves unordered.
© Pearson Education Ltd. November 2022 Paper 3 (Foundation, calculator), question 16.
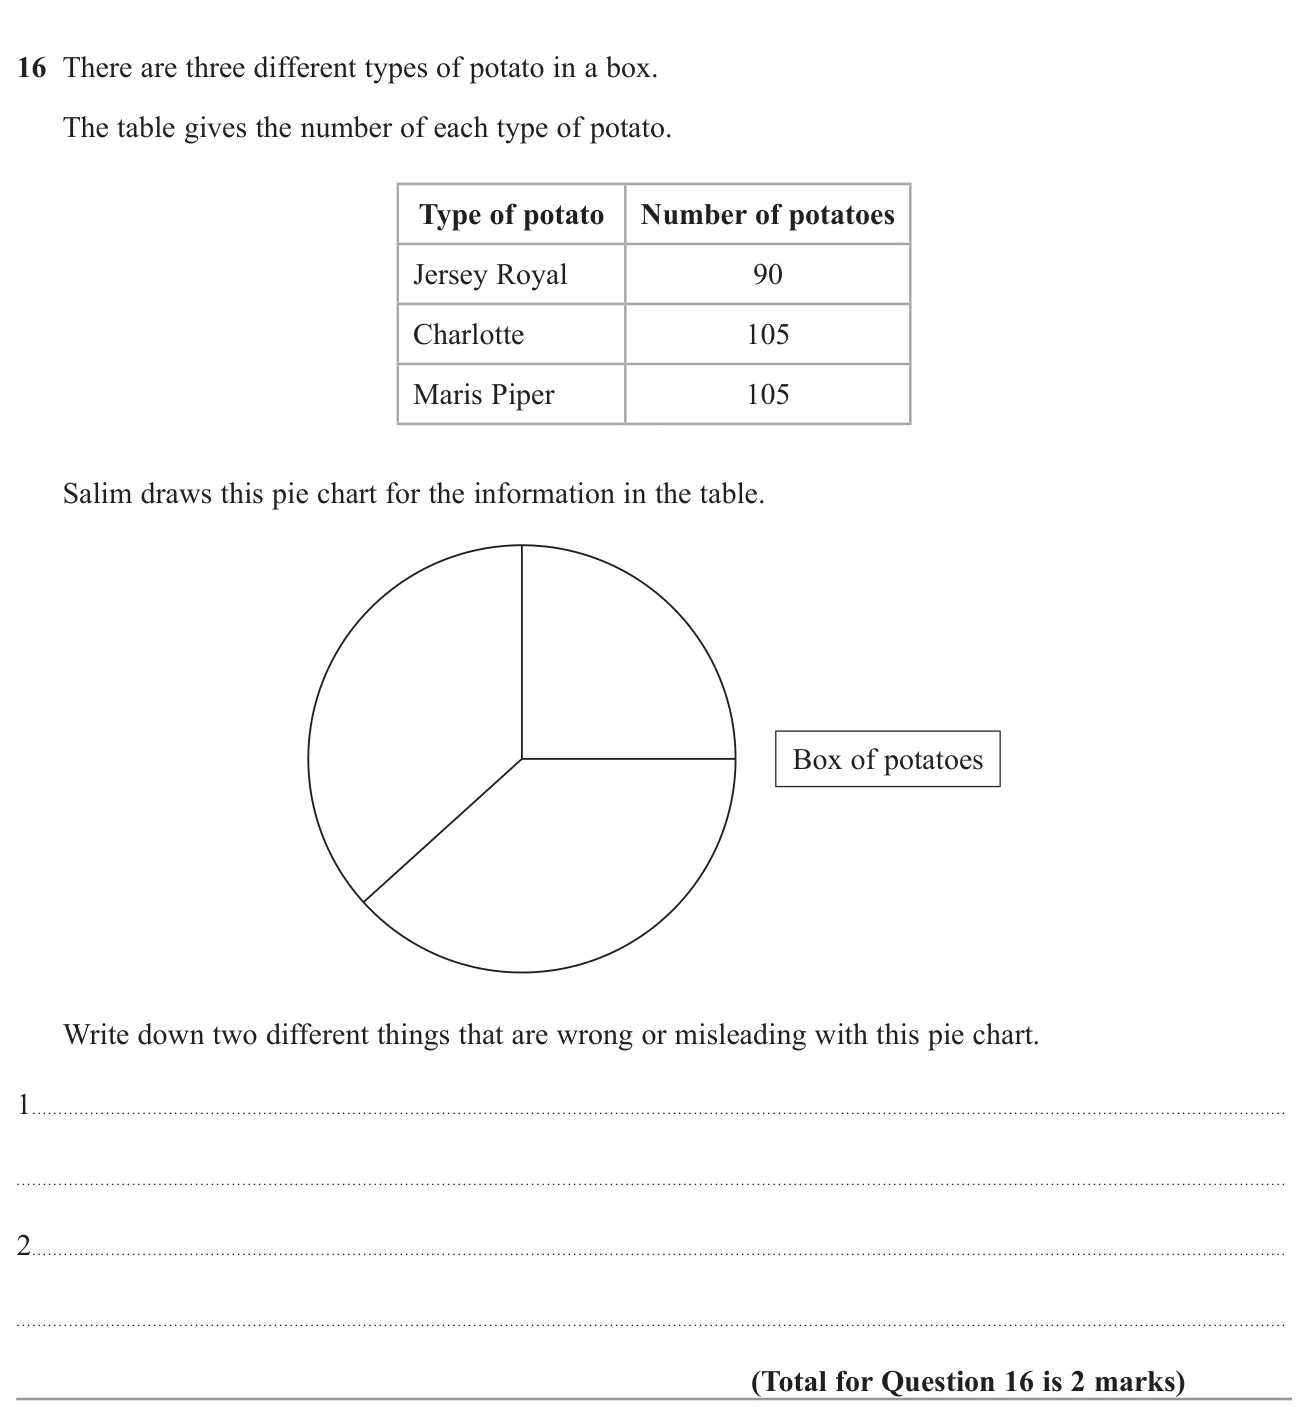
Answer The sectors have no labels (or no key); the angles are wrong (should be 108°, 126°, 126°) 2 marks
Worked solution Checked against the mark scheme
Total = 90 + 105 + 105 = 300 = 90 + 105 + 105 = 300 = 90 + 105 + 105 = 300 360 ÷ 300 = 1.2 ° 360 \div 300 = 1.2° 360 ÷ 300 = 1.2°
Correct angles: 90 × 1.2 = 108 ° 90 \times 1.2 = 108° 90 × 1.2 = 108° 105 × 1.2 = 126 ° 105 \times 1.2 = 126° 105 × 1.2 = 126°
Also, the sectors are not labelled with the types of potato.
Watch out: Only saying 'the sectors are the wrong size' without a reason.
© Pearson Education Ltd. November 2021 Paper 2 (Foundation, calculator), question 8.
Worked solution Checked against the mark scheme
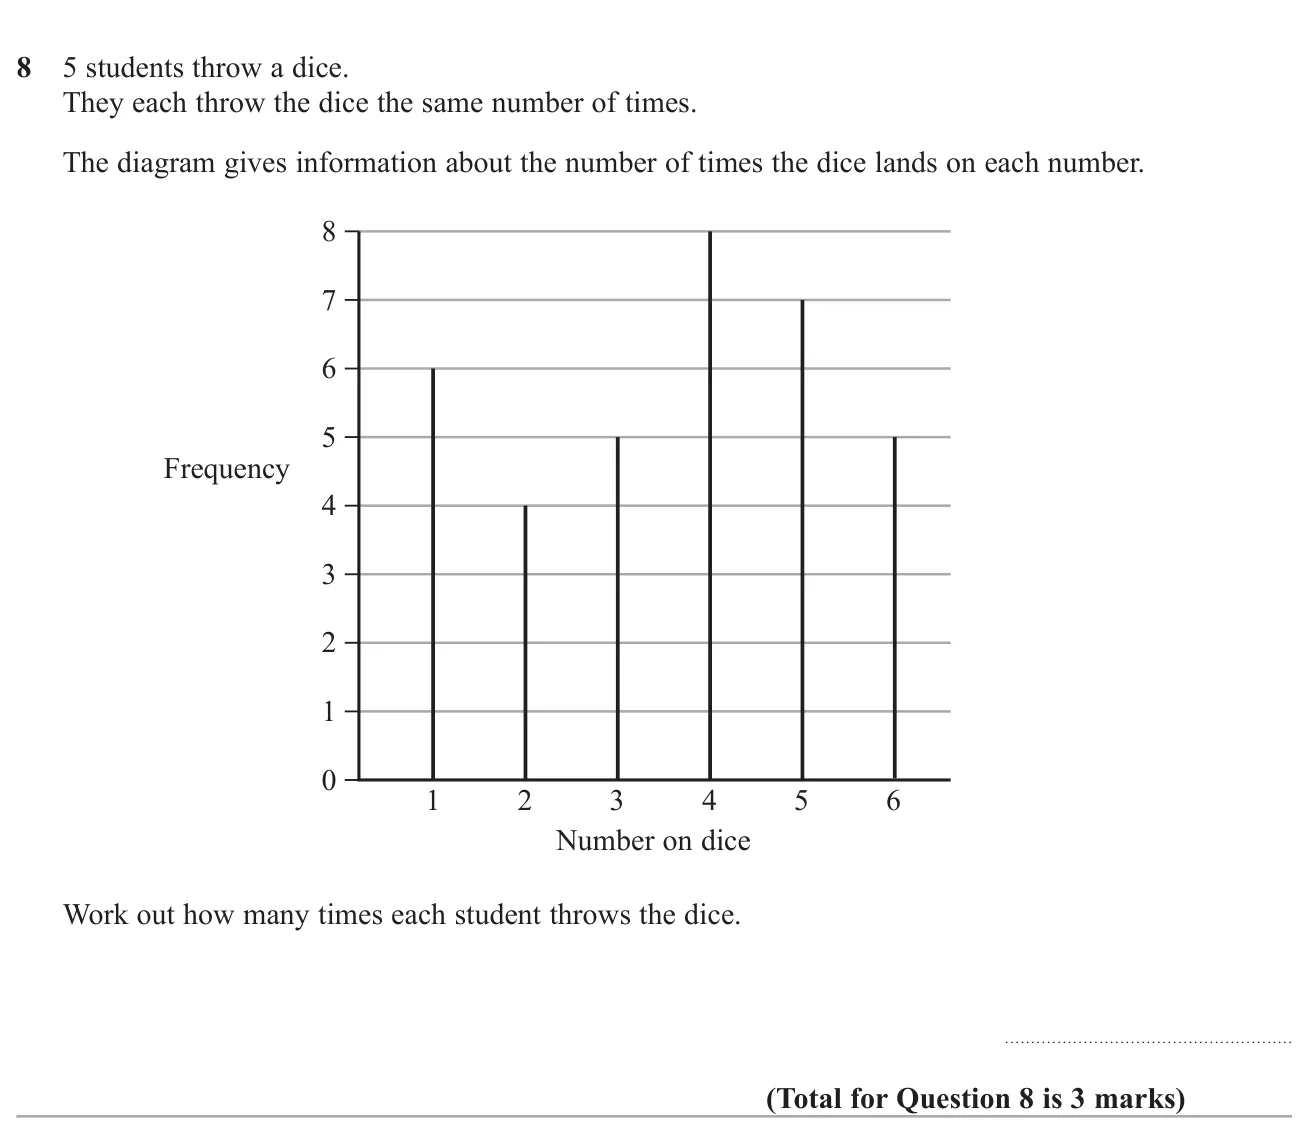
Frequencies read from the chart: 6, 4, 5, 8, 7, 5.
Total throws: 6 + 4 + 5 + 8 + 7 + 5 = 35 6+4+5+8+7+5 = 35 6 + 4 + 5 + 8 + 7 + 5 = 35
Each student: 35 ÷ 5 = 7 35 \div 5 = 7 35 ÷ 5 = 7
Watch out: Adding the dice numbers 1 to 6 instead of the frequencies.
© Pearson Education Ltd. November 2021 Paper 3 (Foundation, calculator), question 20.
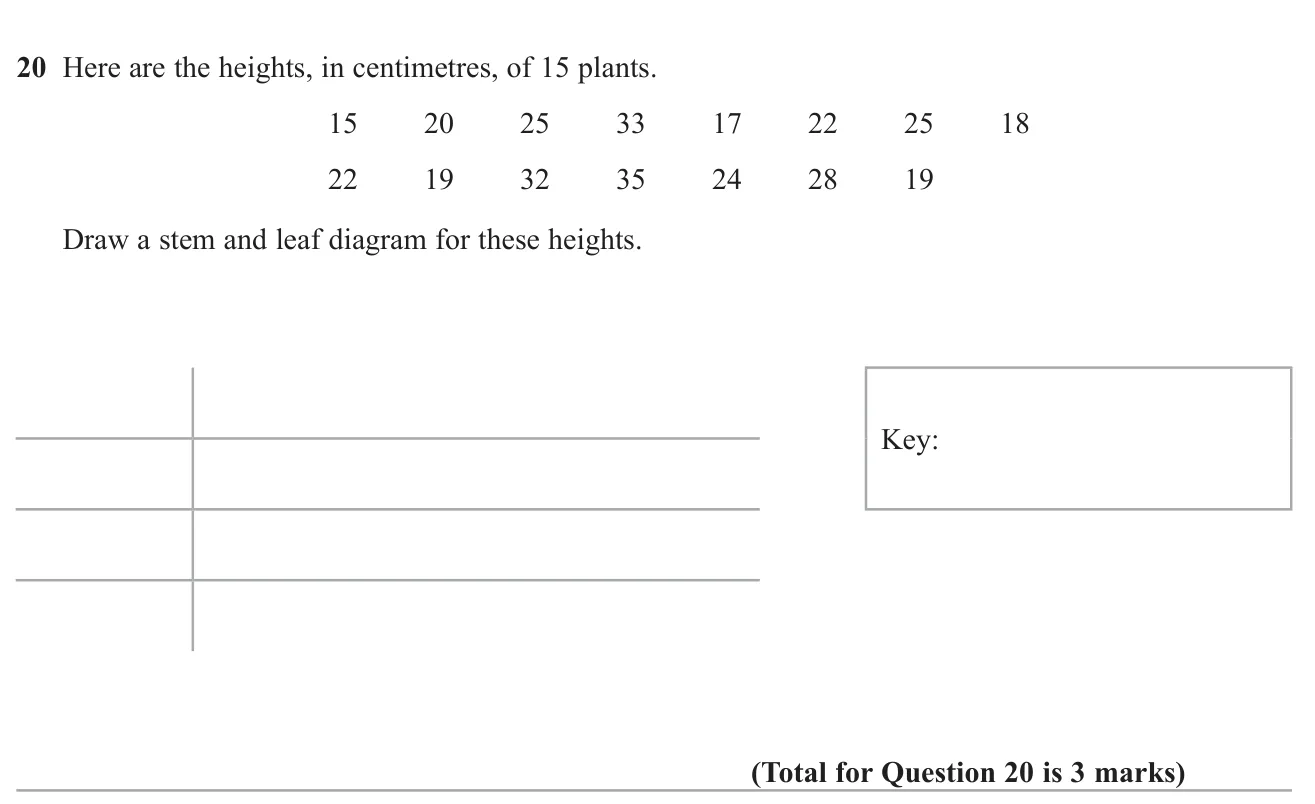
Answer 1 | 5 7 8 9 9; 2 | 0 2 2 4 5 5 8; 3 | 2 3 5 with key e.g. 2 | 5 means 25 cm 3 marks
Worked solution Checked against the mark scheme
Use the tens digit as the stem and the units digit as the leaf.
Put the leaves in order:
1 | 5 7 8 9 9
2 | 0 2 2 4 5 5 8
3 | 2 3 5
Key: 2 | 5 means 25 cm. Check there are 15 leaves.
Watch out: Forgetting the key or leaving the leaves unordered.
© Pearson Education Ltd. November 2020 Paper 2 (Foundation, calculator), question 14.
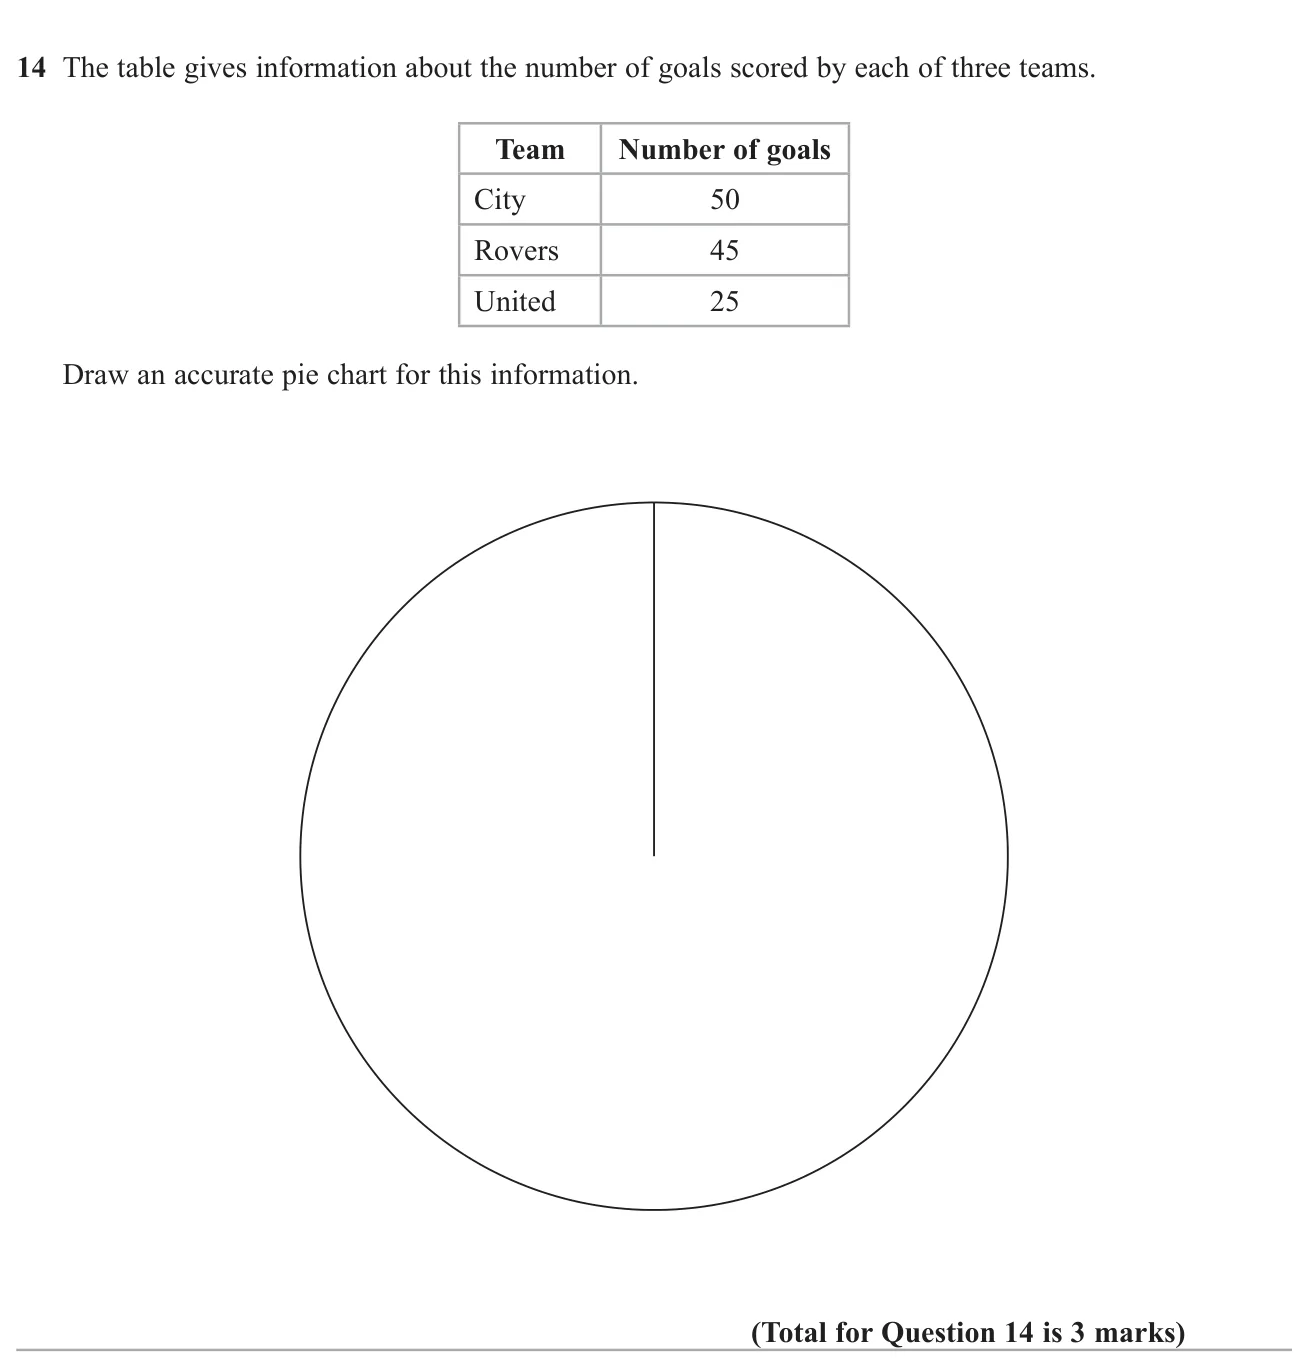
Answer Sectors of 150 ∘ 150^\circ 15 0 ∘ 135 ∘ 135^\circ 13 5 ∘ 75 ∘ 75^\circ 7 5 ∘ 3 marks
Worked solution Checked against the mark scheme
Total goals: 50 + 45 + 25 = 120 50 + 45 + 25 = 120 50 + 45 + 25 = 120
Each goal is 360 ÷ 120 = 3 ∘ 360 \div 120 = 3^\circ 360 ÷ 120 = 3 ∘
City 50 × 3 = 150 ∘ 50 \times 3 = 150^\circ 50 × 3 = 15 0 ∘ 45 × 3 = 135 ∘ 45 \times 3 = 135^\circ 45 × 3 = 13 5 ∘ 25 × 3 = 75 ∘ 25 \times 3 = 75^\circ 25 × 3 = 7 5 ∘
Draw and label each sector with a protractor.
Watch out: Using the goal numbers as the angles.
© Pearson Education Ltd. November 2018 Paper 1 (Foundation, non-calculator), question 7.
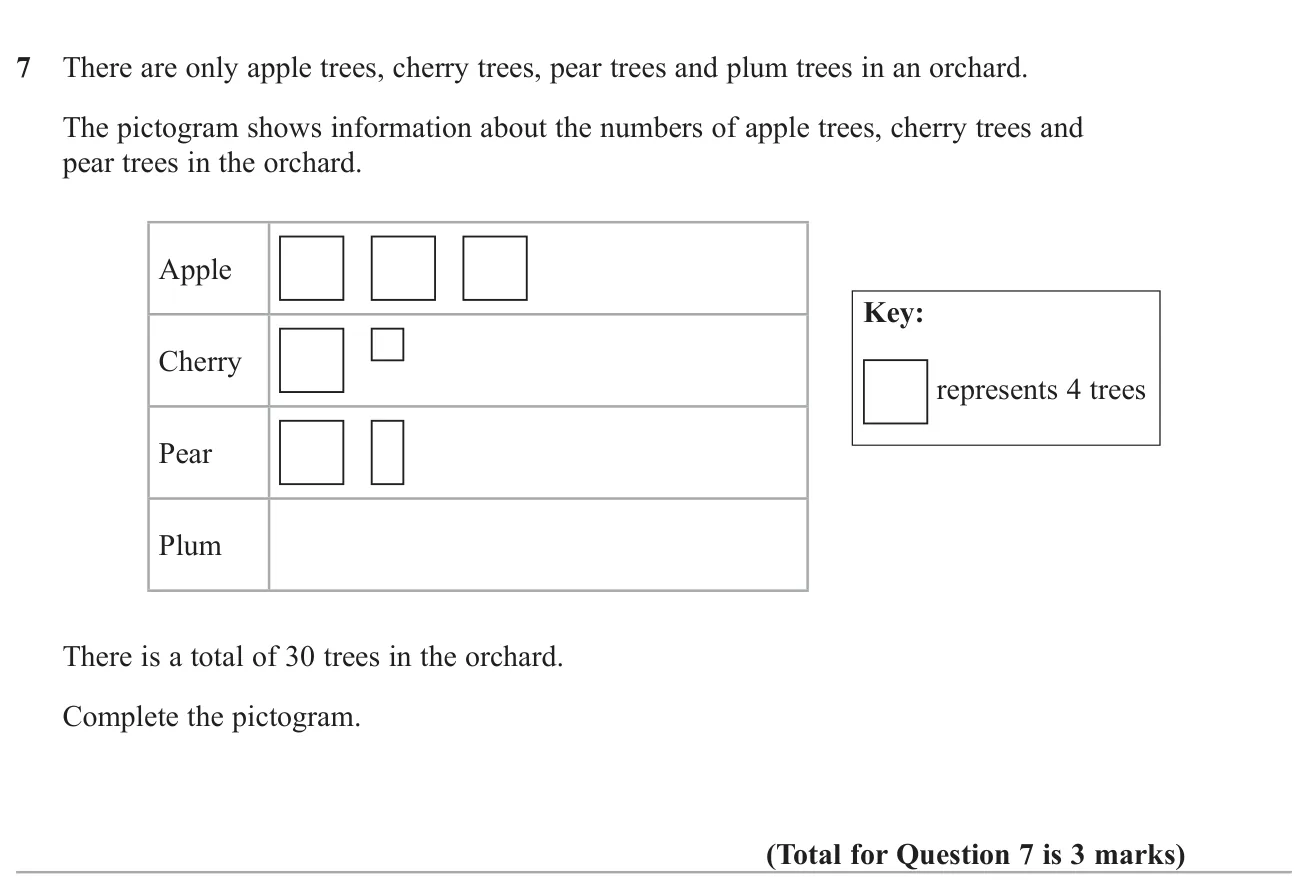
Answer Plum = 7 trees: one full square and three quarters of a square 3 marks
Worked solution Checked against the mark scheme
Key: one square = 4 trees.
Apple 3 squares = 12, cherry 1 1 4 1\frac{1}{4} 1 4 1 1 1 2 1\frac{1}{2} 1 2 1
Plum = 30 − ( 12 + 5 + 6 ) = 7 = 30 - (12 + 5 + 6) = 7 = 30 − ( 12 + 5 + 6 ) = 7
7 ÷ 4 = 1 3 4 7 \div 4 = 1\frac{3}{4} 7 ÷ 4 = 1 4 3
Watch out: Reading the small cherry square as a half (2 trees) rather than a quarter (1 tree).
© Pearson Education Ltd. June 2018 Paper 1 (Foundation, non-calculator), question 12.
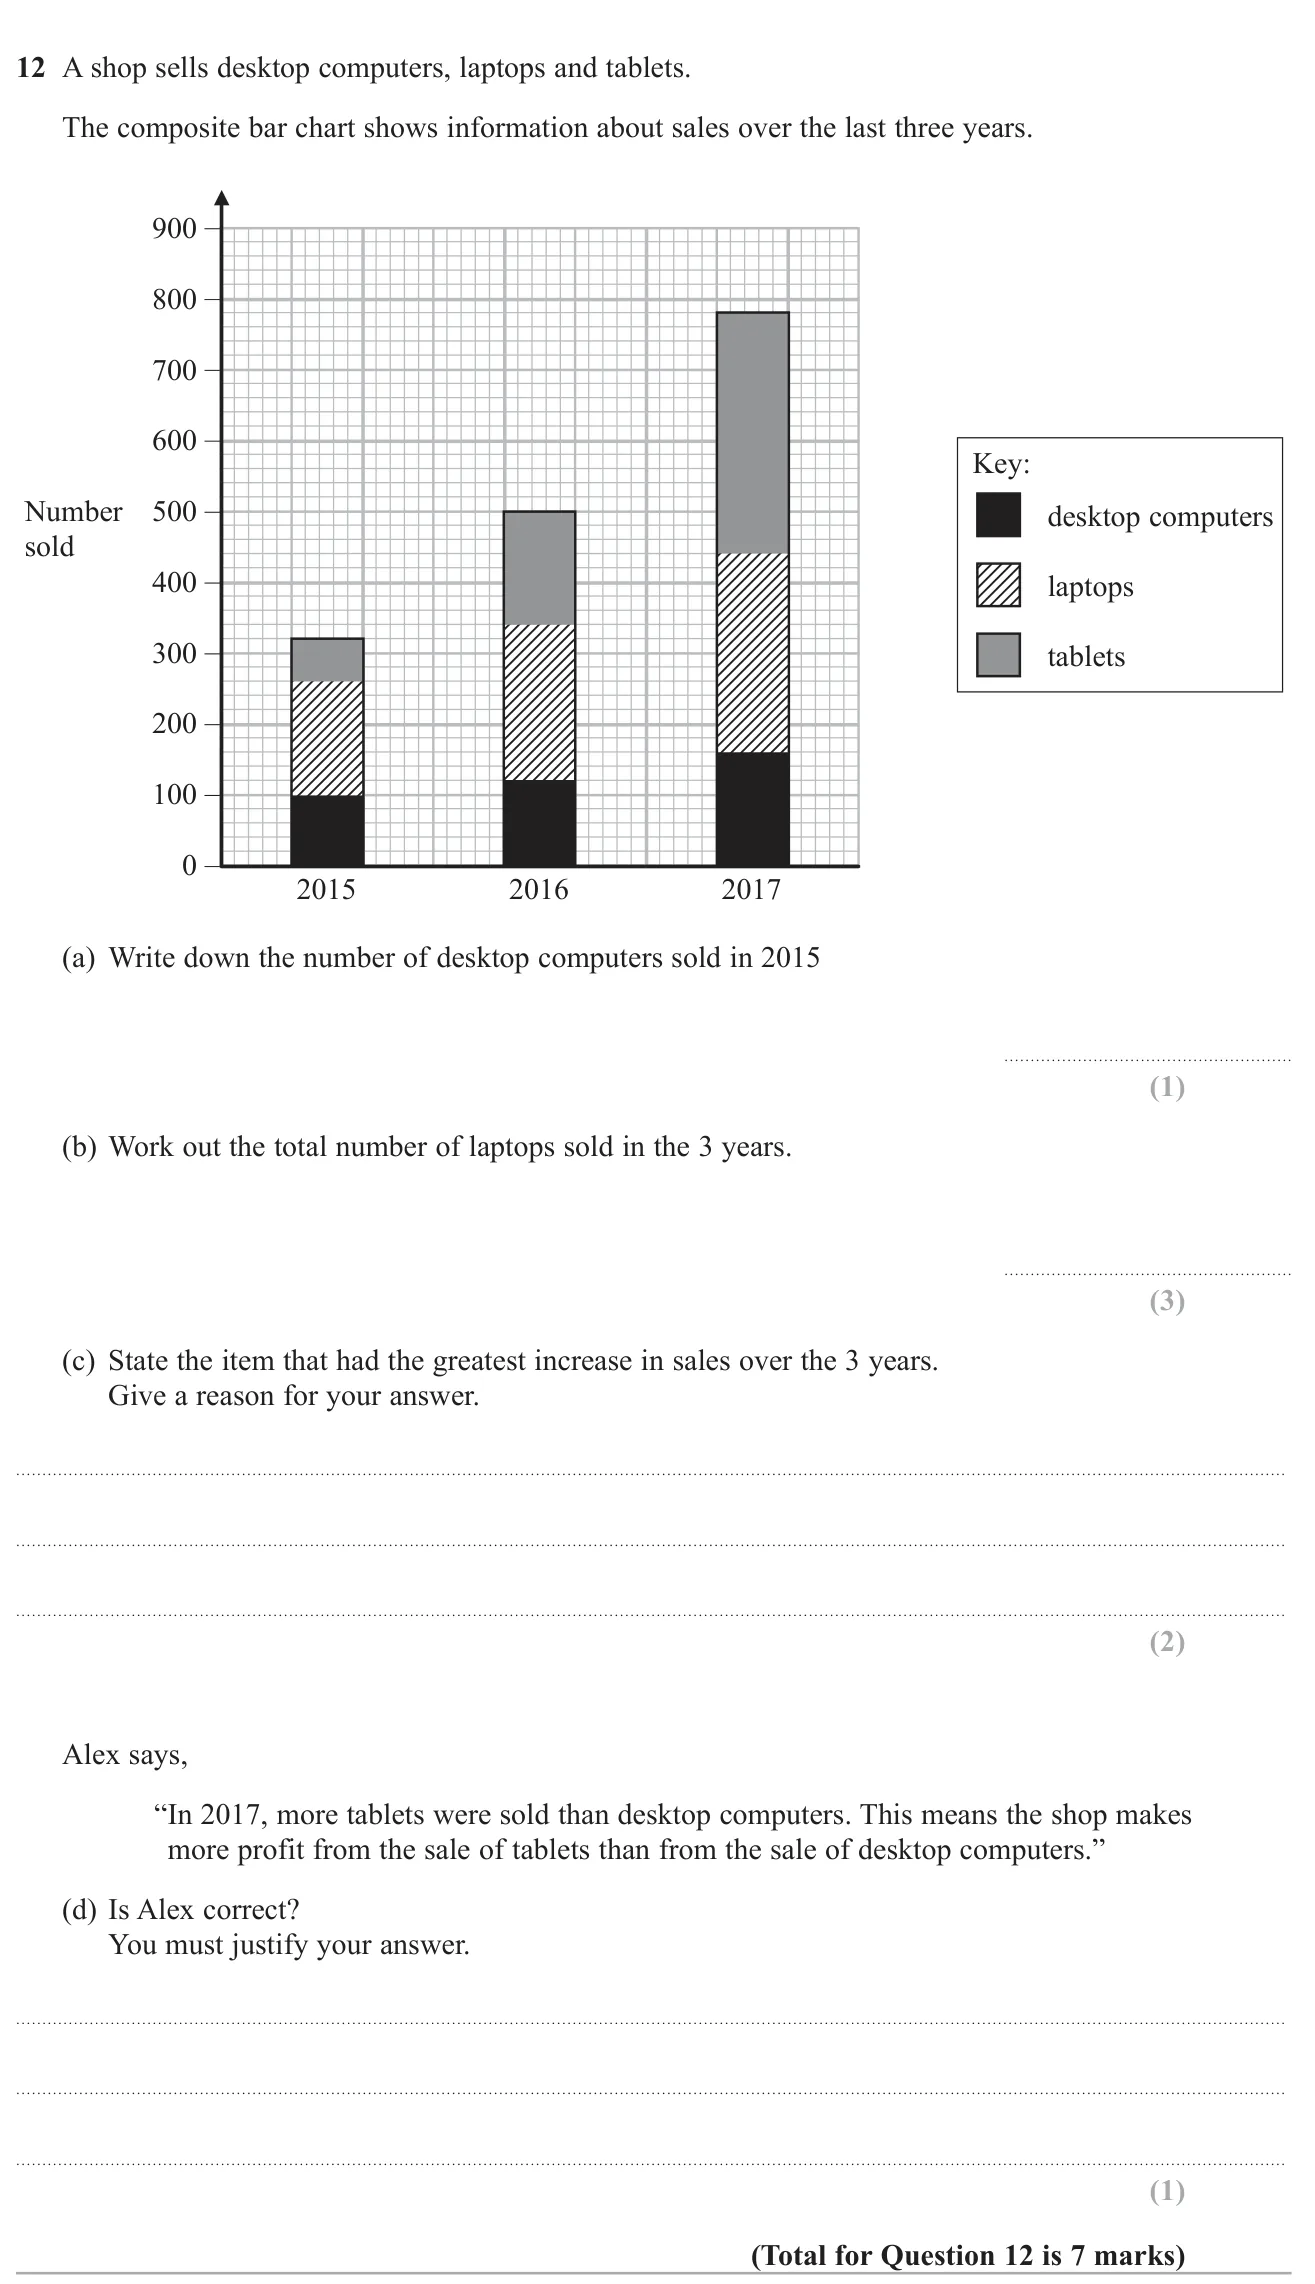
(a) 100 100 100 1 mark (b) 660 660 660 3 marks (c) Tablets: they rose from 60 to 340, an increase of 280 2 marks (d) No: the chart gives numbers sold, not prices or profit 1 mark
Worked solution Checked against the mark scheme
(a) The desktop section in 2015 reaches 100 .
(b) Laptops: 260 − 100 = 160 260 - 100 = 160 260 − 100 = 160 340 − 120 = 220 340 - 120 = 220 340 − 120 = 220 440 − 160 = 280 440 - 160 = 280 440 − 160 = 280
Total = 160 + 220 + 280 = 660 = 160 + 220 + 280 = 660 = 160 + 220 + 280 = 660
(c) Tablets: 320 − 260 = 60 320 - 260 = 60 320 − 260 = 60 780 − 440 = 340 780 - 440 = 340 780 − 440 = 340 Tablets grew most.
(d) No : we know how many were sold, not the profit on each item.
Watch out: Reading the top of the laptop section (260) as the number of laptops instead of subtracting the desktop part.
© Pearson Education Ltd. June 2018 Paper 2 (Foundation, calculator), question 12.
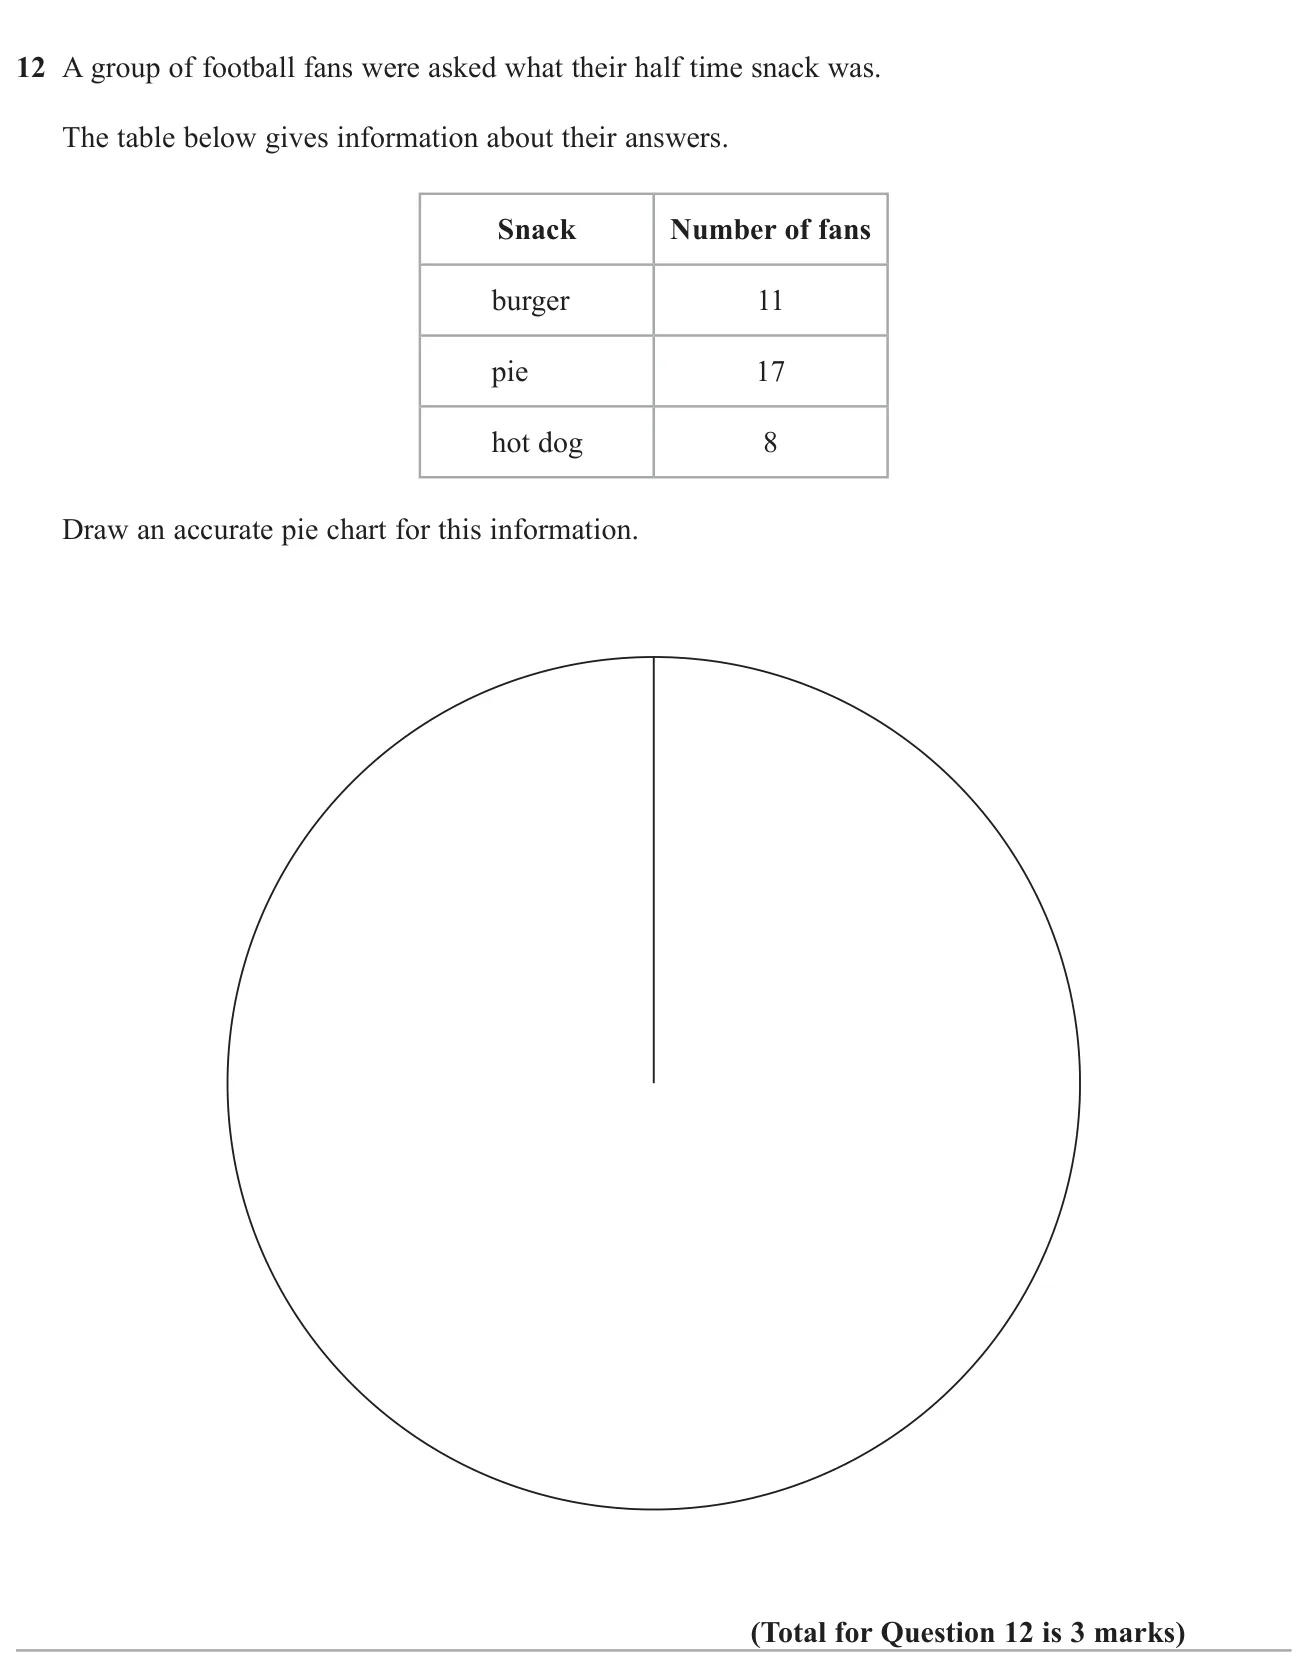
Answer Pie chart with angles burger 110 ° 110° 110° 170 ° 170° 170° 80 ° 80° 80° 3 marks
Worked solution Checked against the mark scheme
Total fans: 11 + 17 + 8 = 36 11 + 17 + 8 = 36 11 + 17 + 8 = 36
Each fan is 360 ° ÷ 36 = 10 ° 360° \div 36 = 10° 360° ÷ 36 = 10°
Burger 11 × 10 = 110 ° 11 \times 10 = 110° 11 × 10 = 110° 17 × 10 = 170 ° 17 \times 10 = 170° 17 × 10 = 170° 8 × 10 = 80 ° 8 \times 10 = 80° 8 × 10 = 80°
Check: 110 + 170 + 80 = 360 ° 110 + 170 + 80 = 360° 110 + 170 + 80 = 360°
Watch out: Using the frequencies as the angles.
© Pearson Education Ltd. November 2018 Paper 3 (Foundation, calculator), question 12.
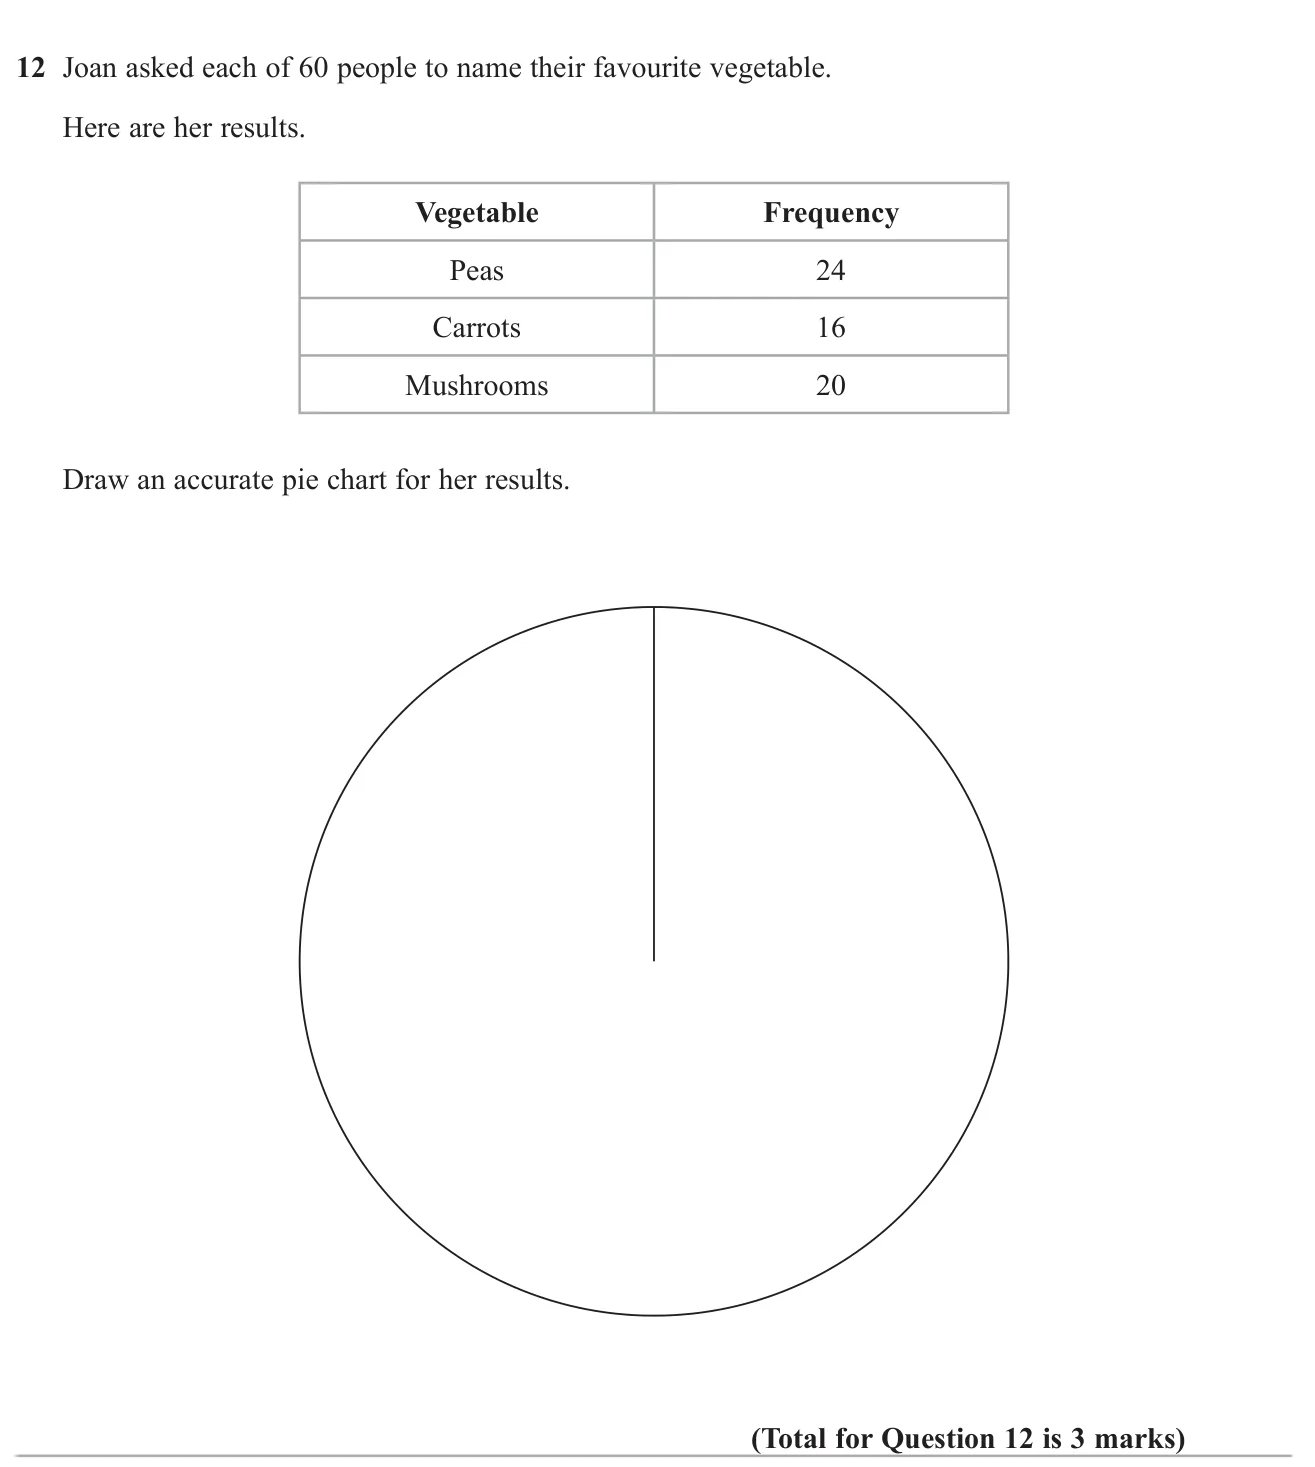
Answer Pie chart with Peas 144 ° 144° 144° 96 ° 96° 96° 120 ° 120° 120° 3 marks
Worked solution Checked against the mark scheme
Each person is worth 360 ÷ 60 = 6 ° 360 \div 60 = 6° 360 ÷ 60 = 6°
Peas: 24 × 6 = 144 ° 24 \times 6 = 144° 24 × 6 = 144° 16 × 6 = 96 ° 16 \times 6 = 96° 16 × 6 = 96° 20 × 6 = 120 ° 20 \times 6 = 120° 20 × 6 = 120°
Check: 144 + 96 + 120 = 360 ° 144 + 96 + 120 = 360° 144 + 96 + 120 = 360°
Watch out: Using the frequencies as the angles directly.
© Pearson Education Ltd. Specimen Paper 1 (Foundation, non-calculator), question 7.
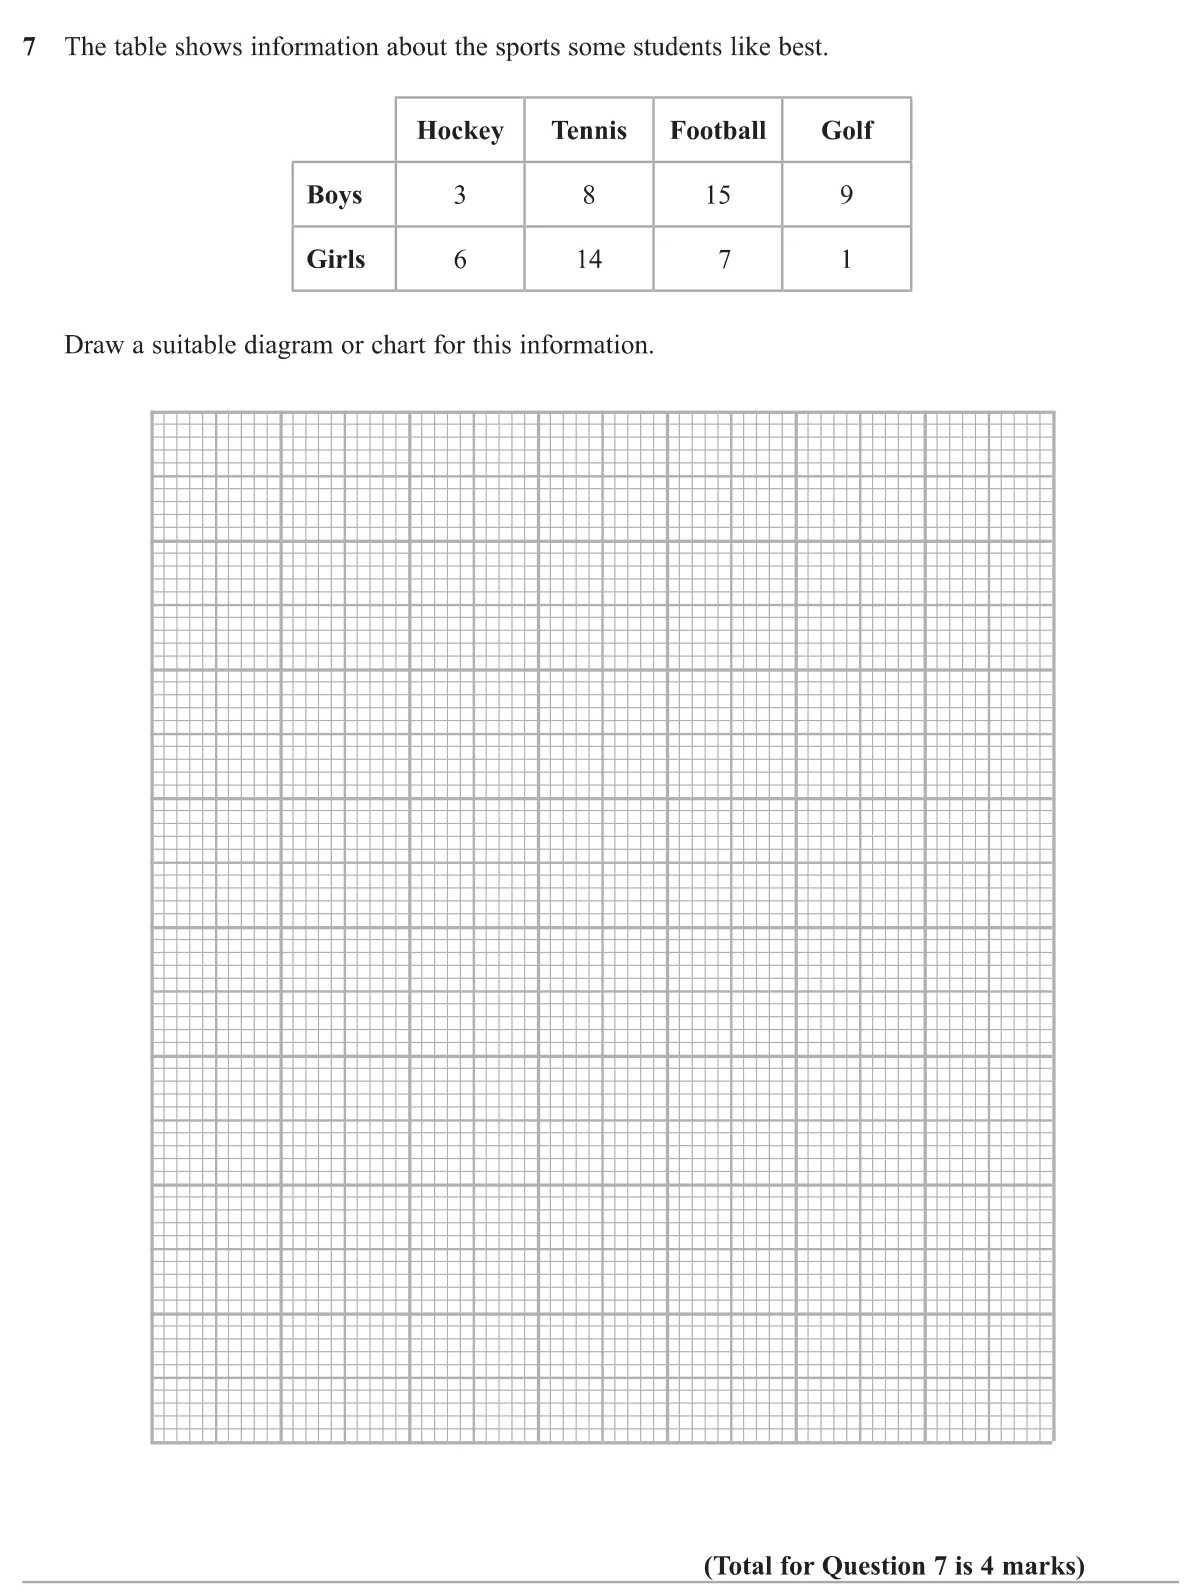
Answer A dual (or composite) bar chart, or two separate bar charts, with labelled axes, a key and a linear scale 4 marks
Worked solution Checked against the mark scheme
A dual bar chart works well.
- Put the four sports along the horizontal axis.
Watch out: Forgetting the key, or using an uneven scale on the frequency axis.
© Pearson Education Ltd. Specimen Paper 2 (Foundation, calculator), question 13.
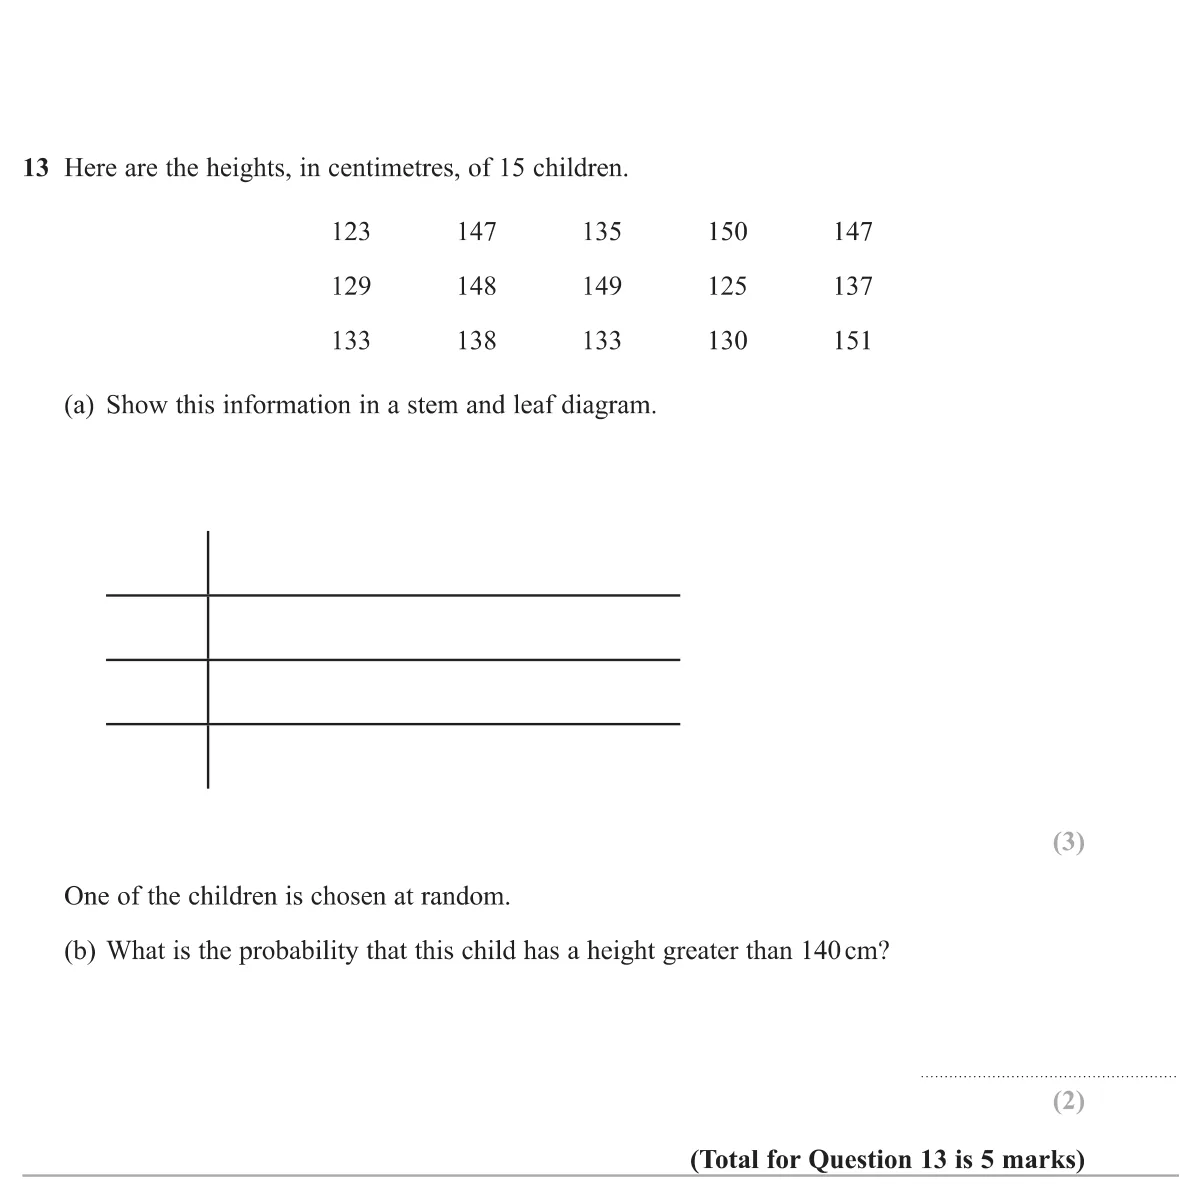
(a) Stems 12–15 with ordered leaves and a key, e.g. 12 | 3 means 123 cm 3 marks (b) 6 15 \frac{6}{15} 15 6 2 marks
Worked solution Checked against the mark scheme
(a) 12 | 3 5 9
13 | 0 3 3 5 7 8
14 | 7 7 8 9
15 | 0 1
Key: 12 | 3 means 123 cm
(b) Heights over 140: 147, 147, 148, 149, 150, 151, which is 6 children.
P = 6 15 = 2 5 P = \frac{6}{15} = \frac{2}{5} P = 15 6 = 5 2
Watch out: Leaving out the key or not ordering the leaves.
© Pearson Education Ltd. November 2024 Paper 3 (Foundation, calculator), question 17.
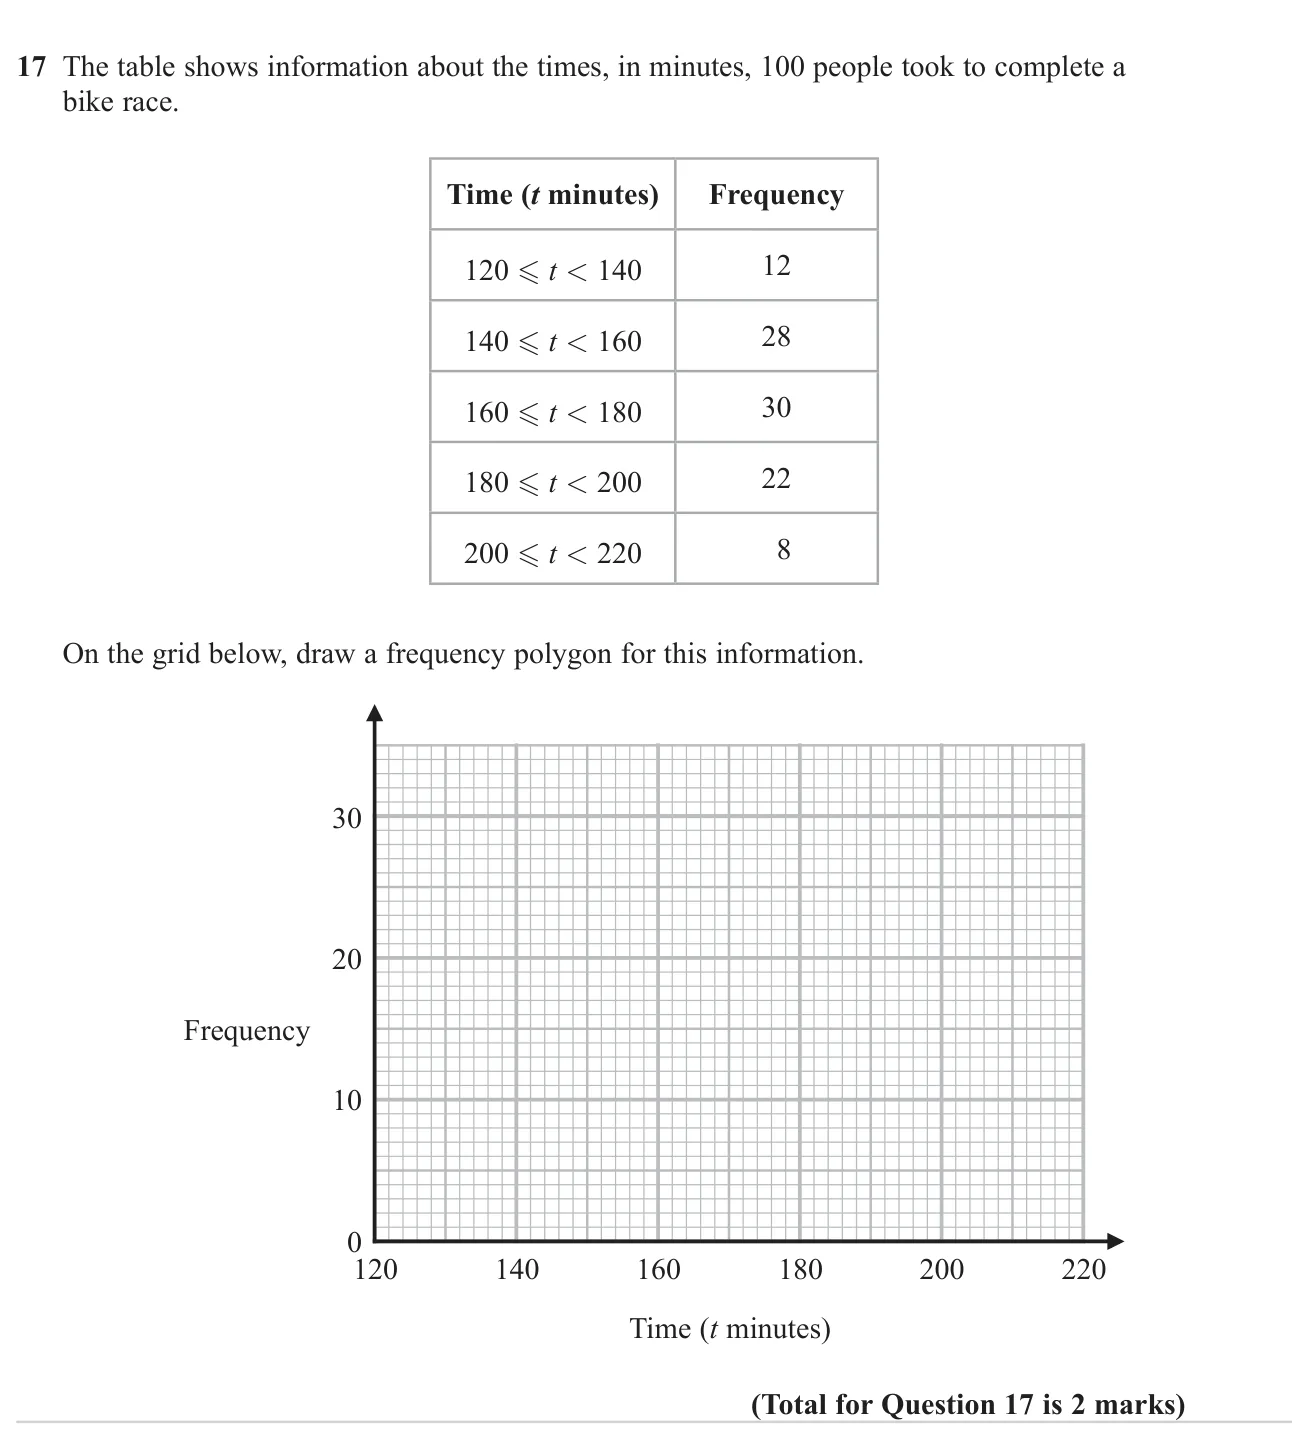
Answer Points at (130, 12), (150, 28), (170, 30), (190, 22), (210, 8) joined with straight lines 2 marks
Worked solution Checked against the mark scheme
Midpoints: 130, 150, 170, 190, 210
Plot (130, 12), (150, 28), (170, 30), (190, 22), (210, 8).
Join neighbouring points with straight lines. Do not join the last point back to the first.
Watch out: Plotting at the ends of the intervals instead of the midpoints.
© Pearson Education Ltd. June 2023 Paper 1 (Foundation, non-calculator), question 23.
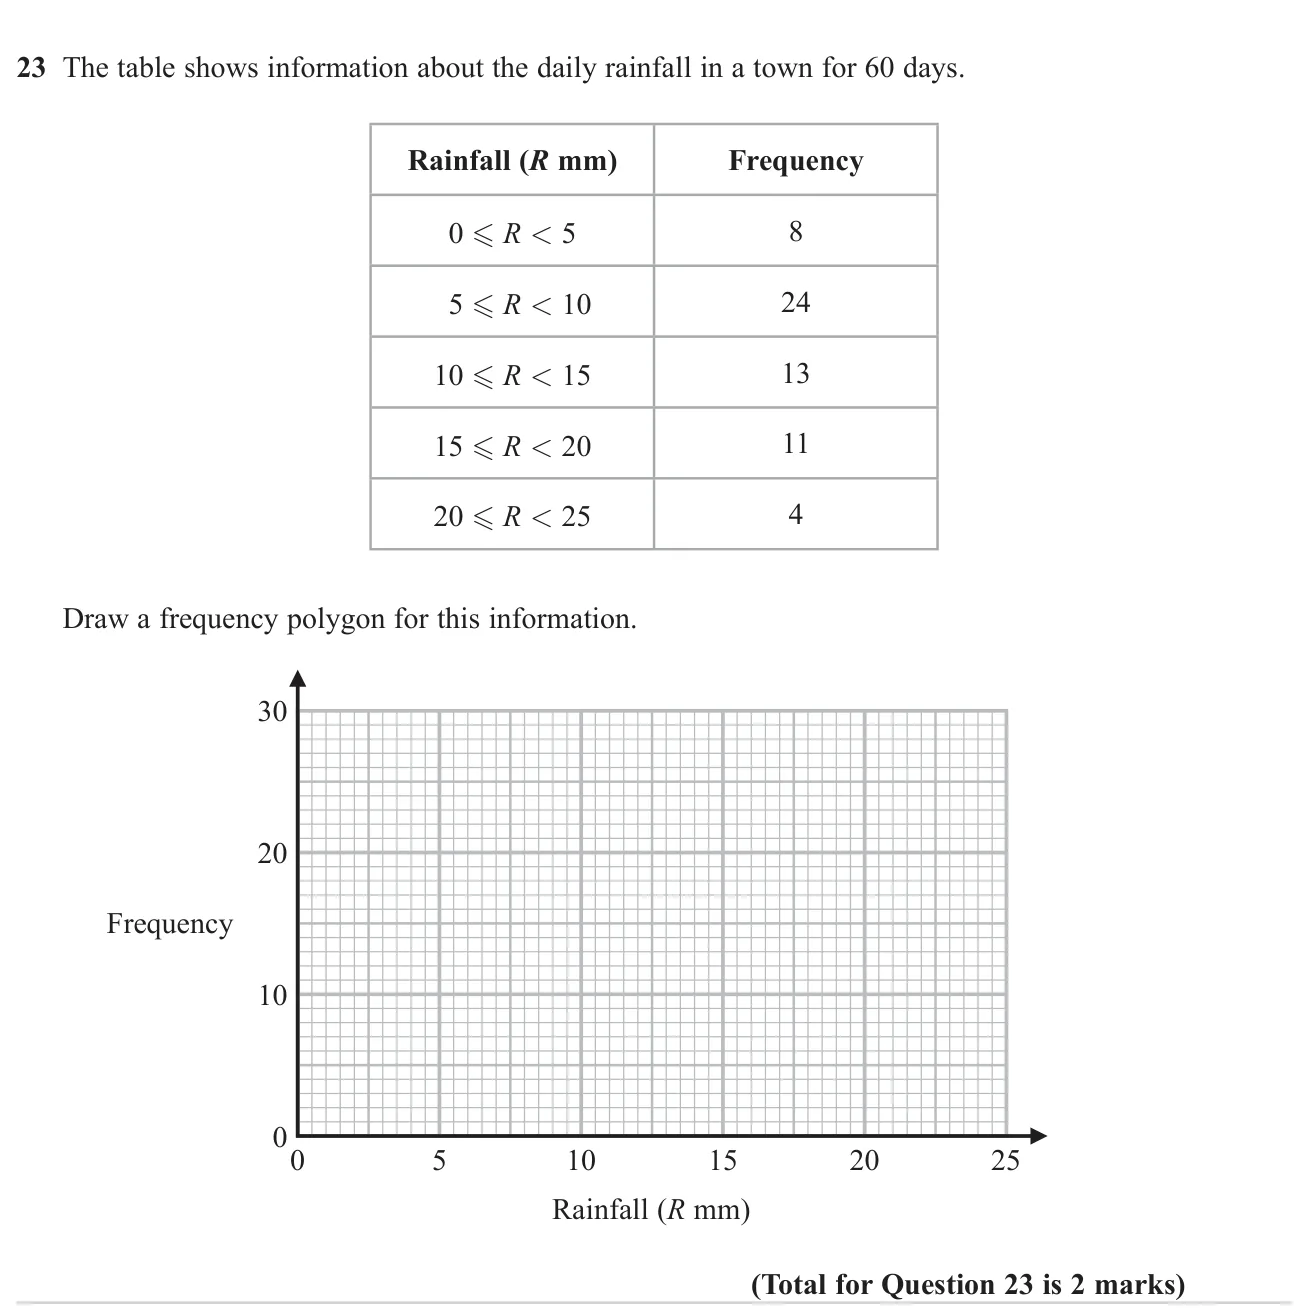
Answer Points at ( 2.5 , 8 ) , ( 7.5 , 24 ) , ( 12.5 , 13 ) , ( 17.5 , 11 ) , ( 22.5 , 4 ) (2.5, 8), (7.5, 24), (12.5, 13), (17.5, 11), (22.5, 4) ( 2.5 , 8 ) , ( 7.5 , 24 ) , ( 12.5 , 13 ) , ( 17.5 , 11 ) , ( 22.5 , 4 ) 2 marks
Worked solution Checked against the mark scheme
Plot each frequency above the middle of its class: 2.5, 7.5, 12.5, 17.5, 22.5.
Points: ( 2.5 , 8 ) , ( 7.5 , 24 ) , ( 12.5 , 13 ) , ( 17.5 , 11 ) , ( 22.5 , 4 ) (2.5, 8), (7.5, 24), (12.5, 13), (17.5, 11), (22.5, 4) ( 2.5 , 8 ) , ( 7.5 , 24 ) , ( 12.5 , 13 ) , ( 17.5 , 11 ) , ( 22.5 , 4 )
Join them in order with a ruler. Do not join the last point back to the first.
Watch out: Plotting at the class boundaries (0, 5, 10, …) instead of the midpoints.
© Pearson Education Ltd. November 2023 Paper 2 (Foundation, calculator), question 16.
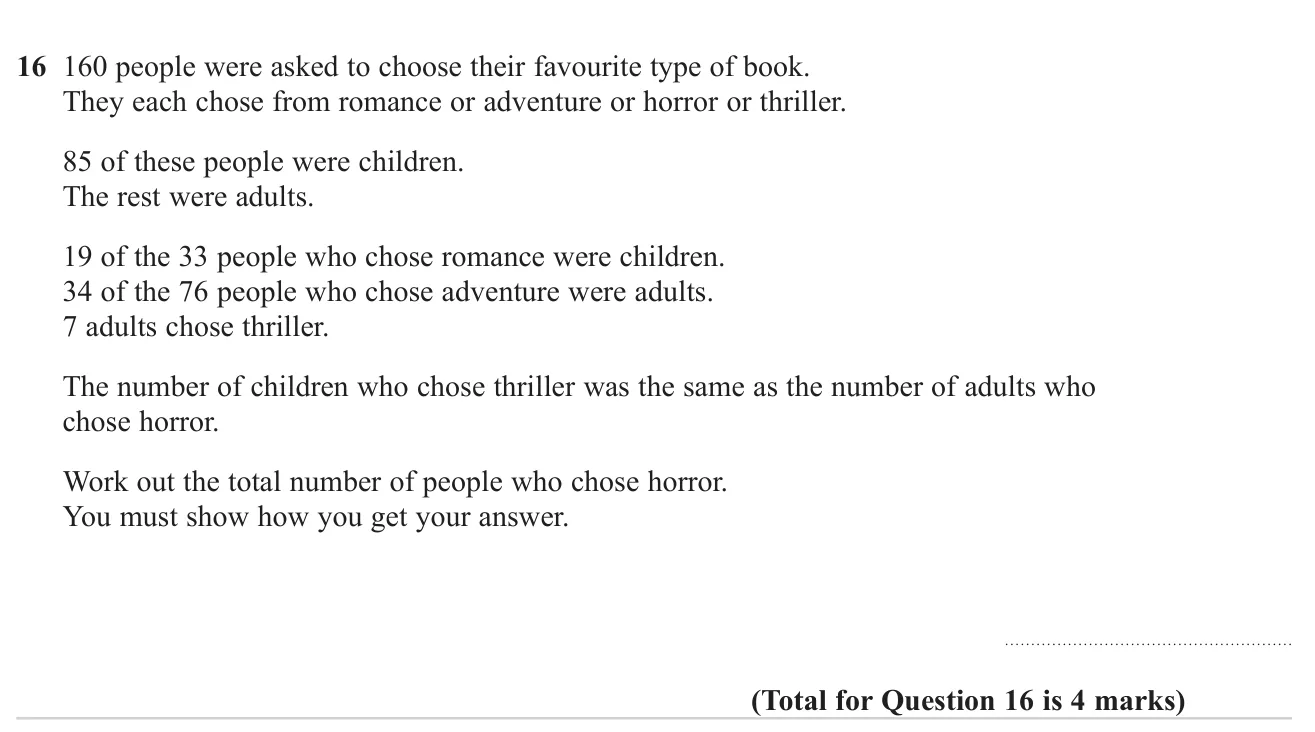
Worked solution Checked against the mark scheme
Adults: 160 − 85 = 75 160 - 85 = 75 160 − 85 = 75 33 − 19 = 14 33 - 19 = 14 33 − 19 = 14 76 − 34 = 42 76 - 34 = 42 76 − 34 = 42
Adult horror: 75 − 14 − 34 − 7 = 20 75 - 14 - 34 - 7 = 20 75 − 14 − 34 − 7 = 20
Child horror: 85 − 19 − 42 − 20 = 4 85 - 19 - 42 - 20 = 4 85 − 19 − 42 − 20 = 4
Total horror: 20 + 4 = 24 20 + 4 = 24 20 + 4 = 24
Watch out: Forgetting that the number of children choosing thriller equals the adult horror number.
© Pearson Education Ltd. November 2022 Paper 3 (Foundation, calculator), question 23.
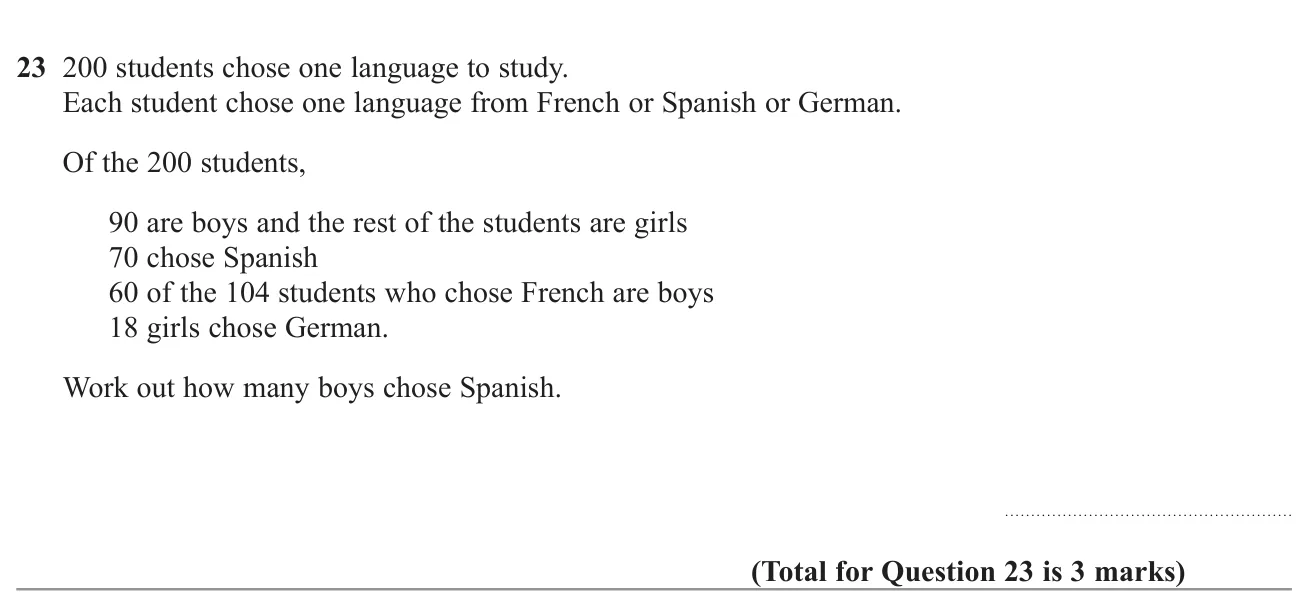
Worked solution Checked against the mark scheme
German: 200 − 104 − 70 = 26 200 - 104 - 70 = 26 200 − 104 − 70 = 26 = 26 − 18 = 8 = 26 - 18 = 8 = 26 − 18 = 8
Boys: 90, of which 60 chose French and 8 chose German.
Boys choosing Spanish = 90 − 60 − 8 = 22 = 90 - 60 - 8 = 22 = 90 − 60 − 8 = 22
Watch out: Forgetting to subtract the girls who chose German from the German total.
© Pearson Education Ltd. June 2022 Paper 3 (Foundation, calculator), question 26.
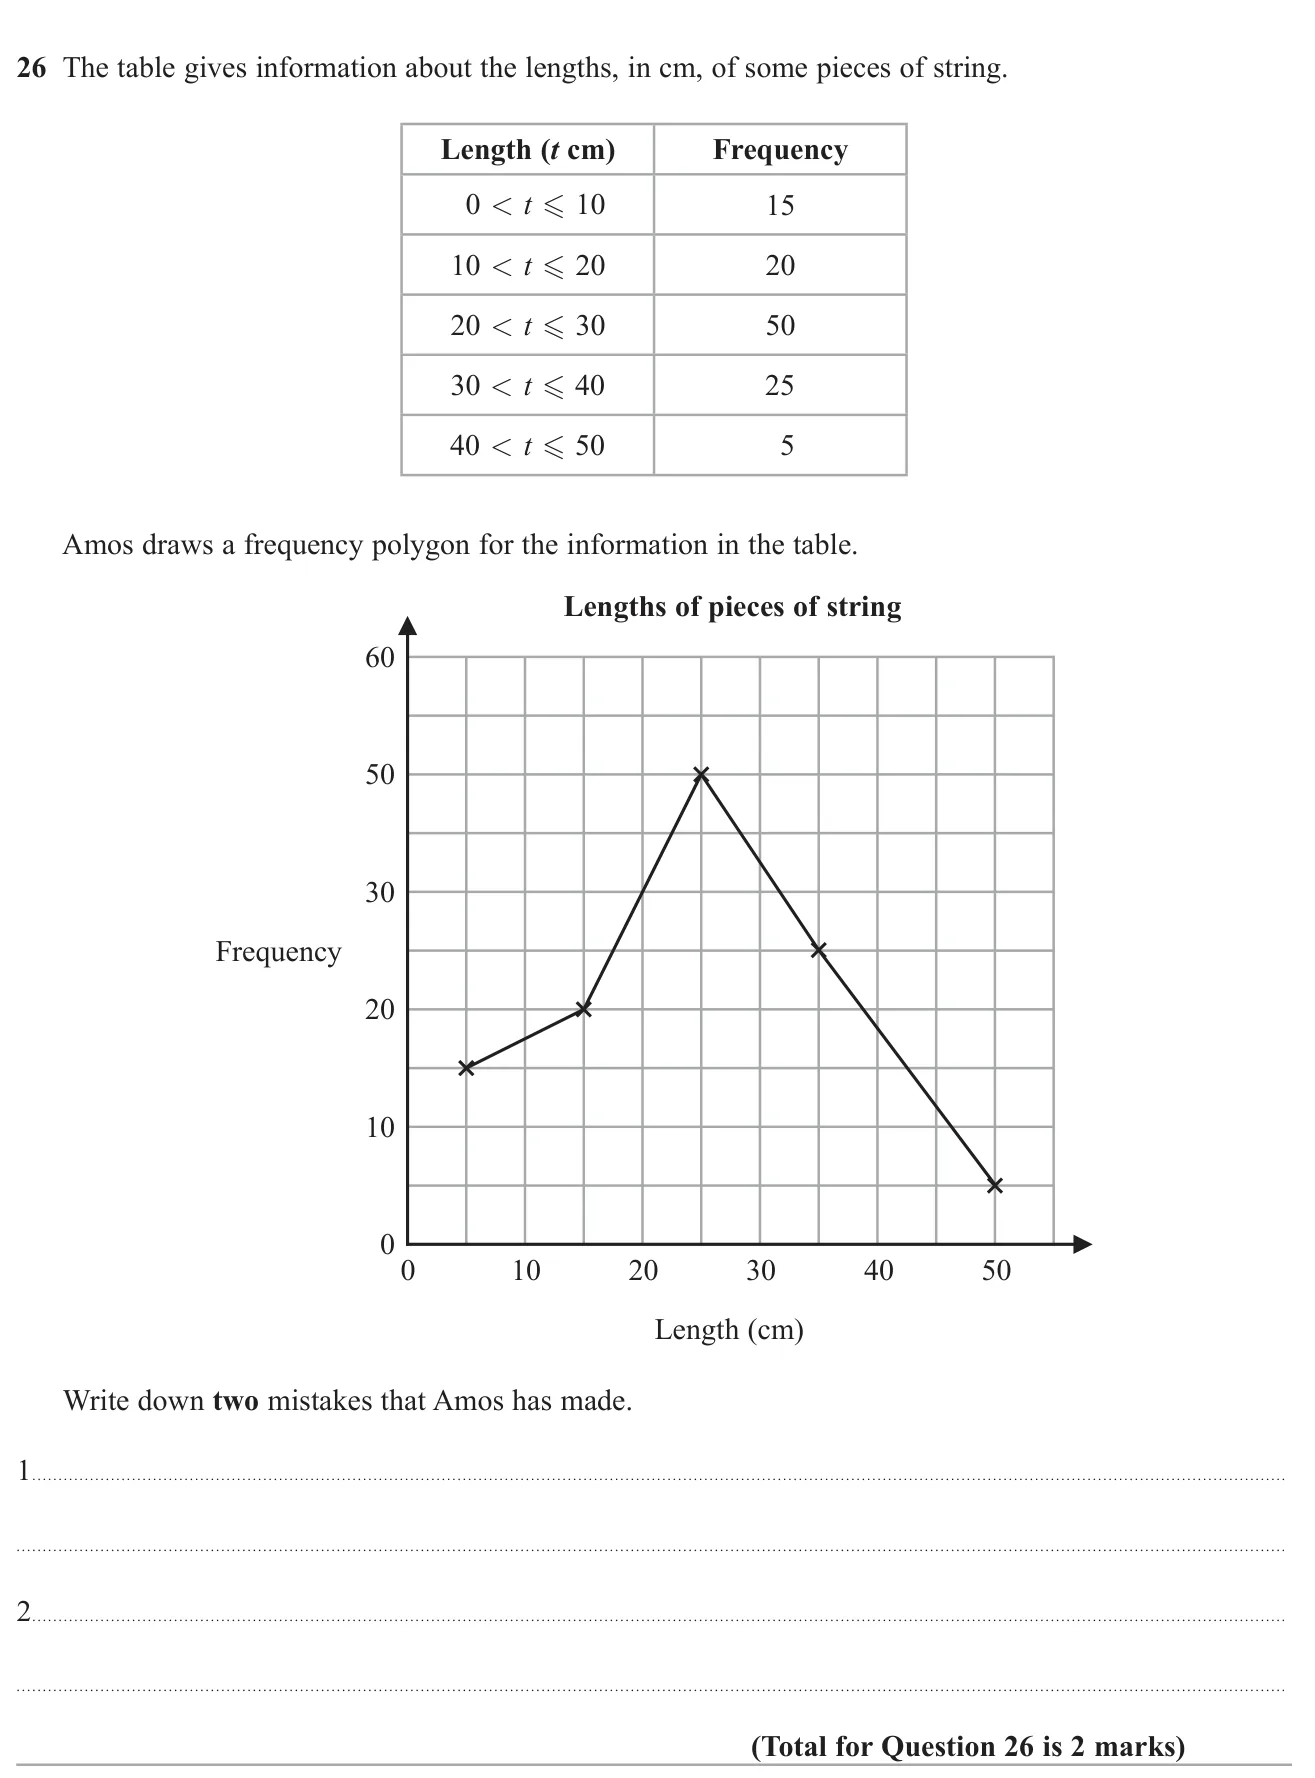
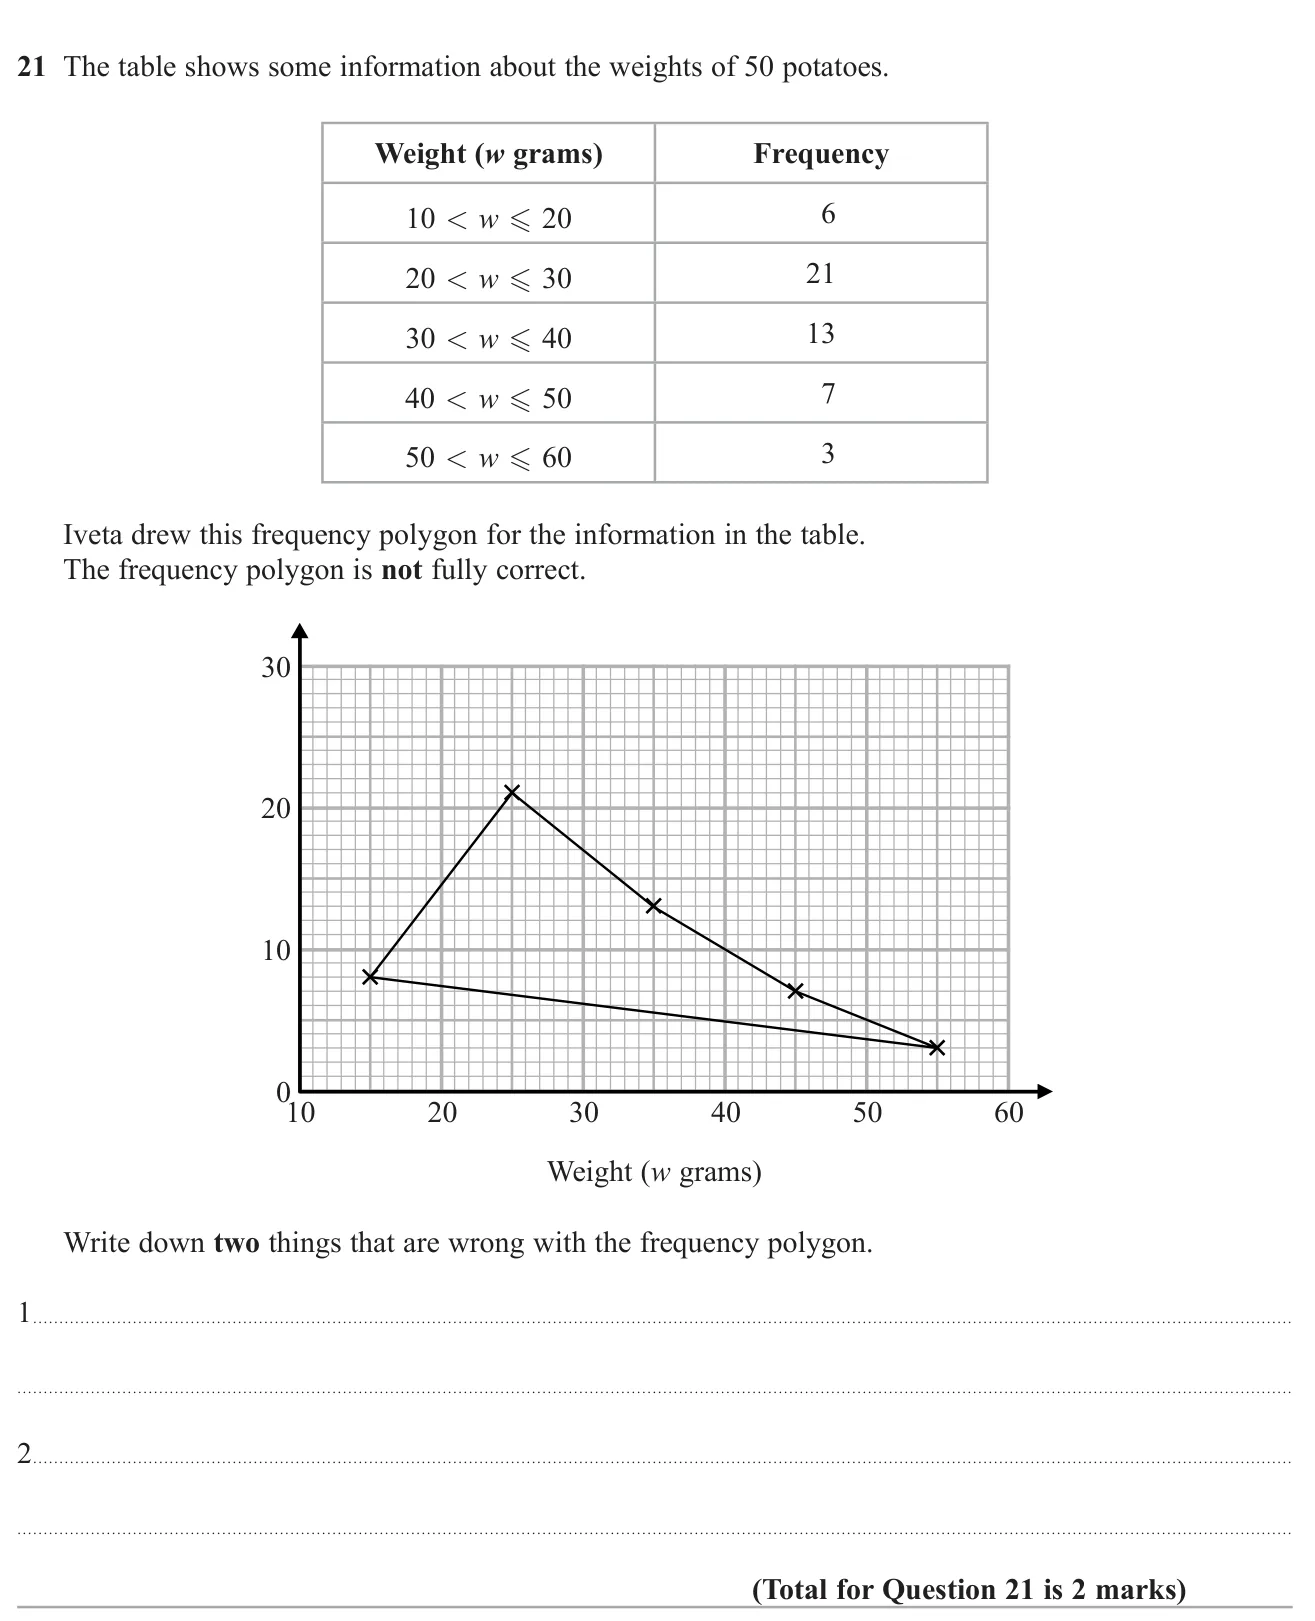
Answer The vertical scale misses 40 (not evenly spaced); the last point is plotted at 50 instead of the midpoint 45 2 marks
Worked solution Checked against the mark scheme
Look at the frequency axis: it goes 30 then 50, so 40 is missing and the scale is not even.
Points should be at class midpoints (5, 15, 25, 35, 45). The last point is at (50, 5) but should be at (45, 5).
Watch out: Saying the polygon should start at the origin, which is not a mistake.
© Pearson Education Ltd. November 2021 Paper 2 (Foundation, calculator), question 16.
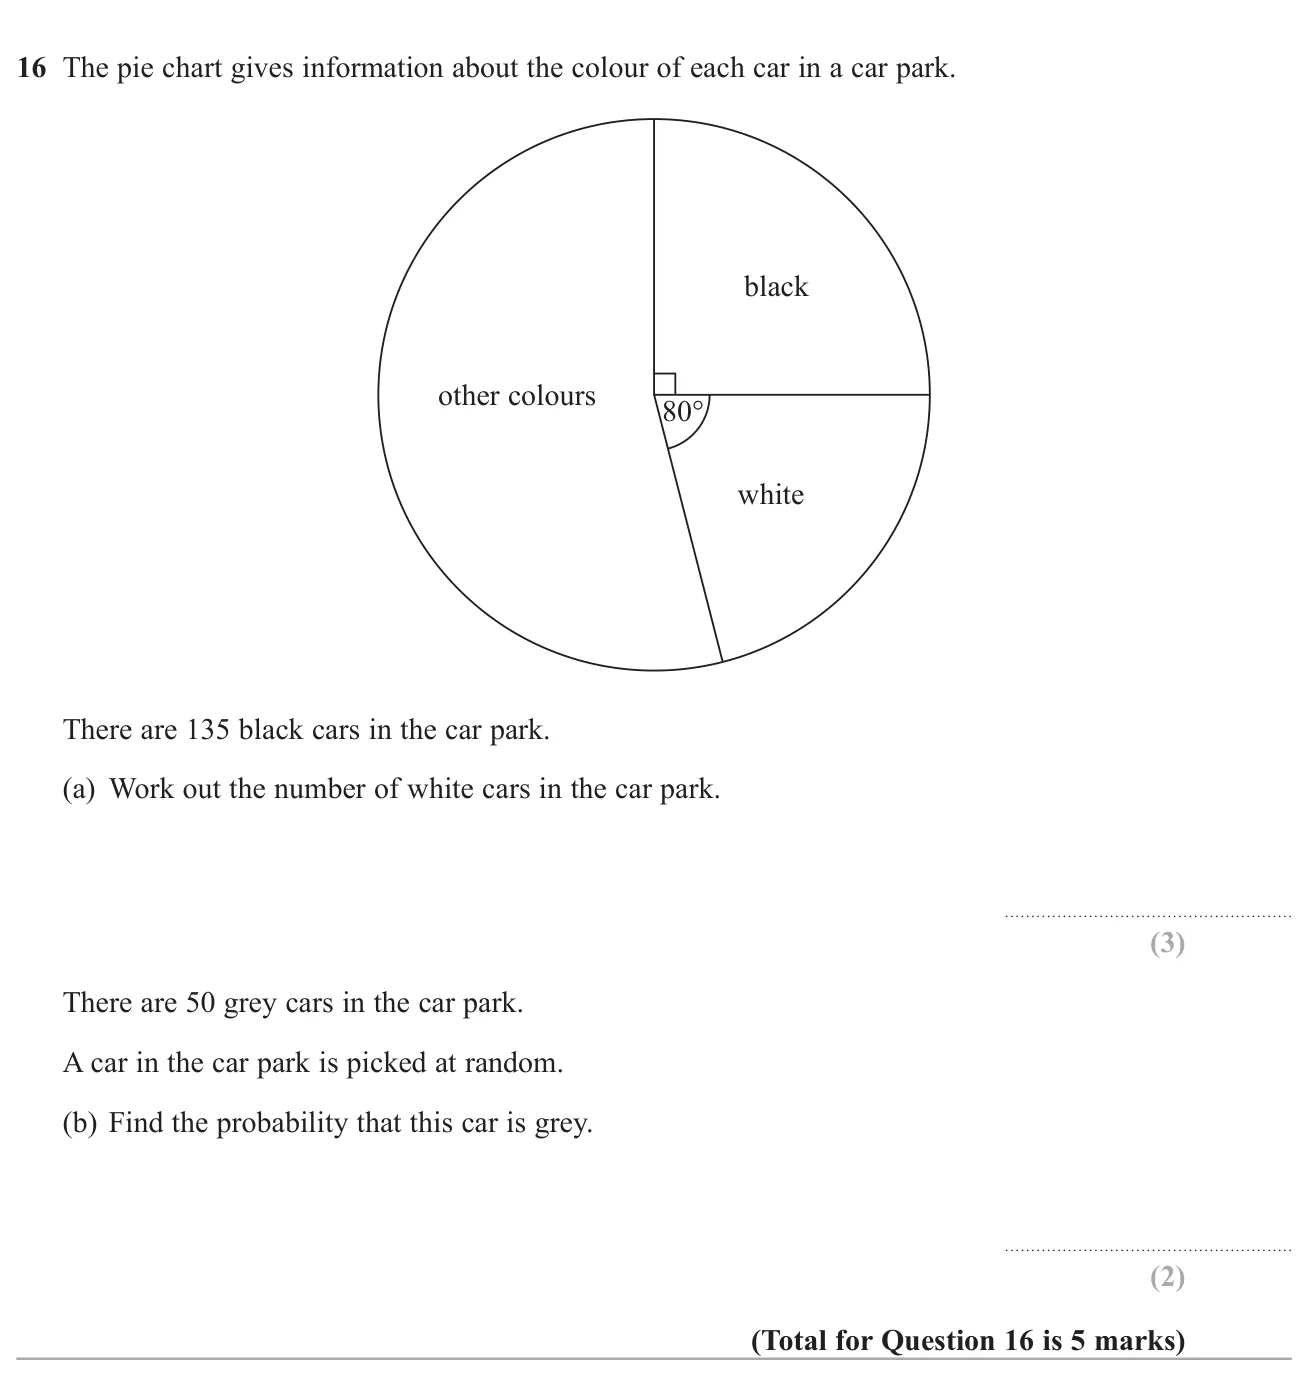
(a) 120 3 marks (b) 50 540 = 5 54 \frac{50}{540} = \frac{5}{54} 540 50 = 54 5 2 marks
Worked solution Checked against the mark scheme
(a) Black is a right angle, 90 ∘ 90^\circ 9 0 ∘ 1 ∘ 1^\circ 1 ∘ 135 ÷ 90 = 1.5 135 \div 90 = 1.5 135 ÷ 90 = 1.5
White: 80 × 1.5 = 120 80 \times 1.5 = 120 80 × 1.5 = 120
(b) Total cars: 360 × 1.5 = 540 360 \times 1.5 = 540 360 × 1.5 = 540
P ( grey ) = 50 540 = 5 54 P(\text{grey}) = \frac{50}{540} = \frac{5}{54} P ( grey ) = 540 50 = 54 5
Watch out: Not spotting that the black sector is a right angle.
© Pearson Education Ltd. November 2019 Paper 2 (Foundation, calculator), question 21.
Answer Any two of: first point plotted at 8 not 6; the polygon should not be closed (first and last points joined); the frequency axis has no label 2 marks
Worked solution Checked against the mark scheme
Check each point against the table at the class midpoints.
The point at 15 is plotted at 8, but the frequency is 6.
The first and last points are joined; a frequency polygon should not be closed.
The vertical axis also has no 'Frequency' label.
Watch out: Saying the midpoints are wrong: plotting at midpoints is correct.
© Pearson Education Ltd. June 2019 Paper 3 (Foundation, calculator), question 27.
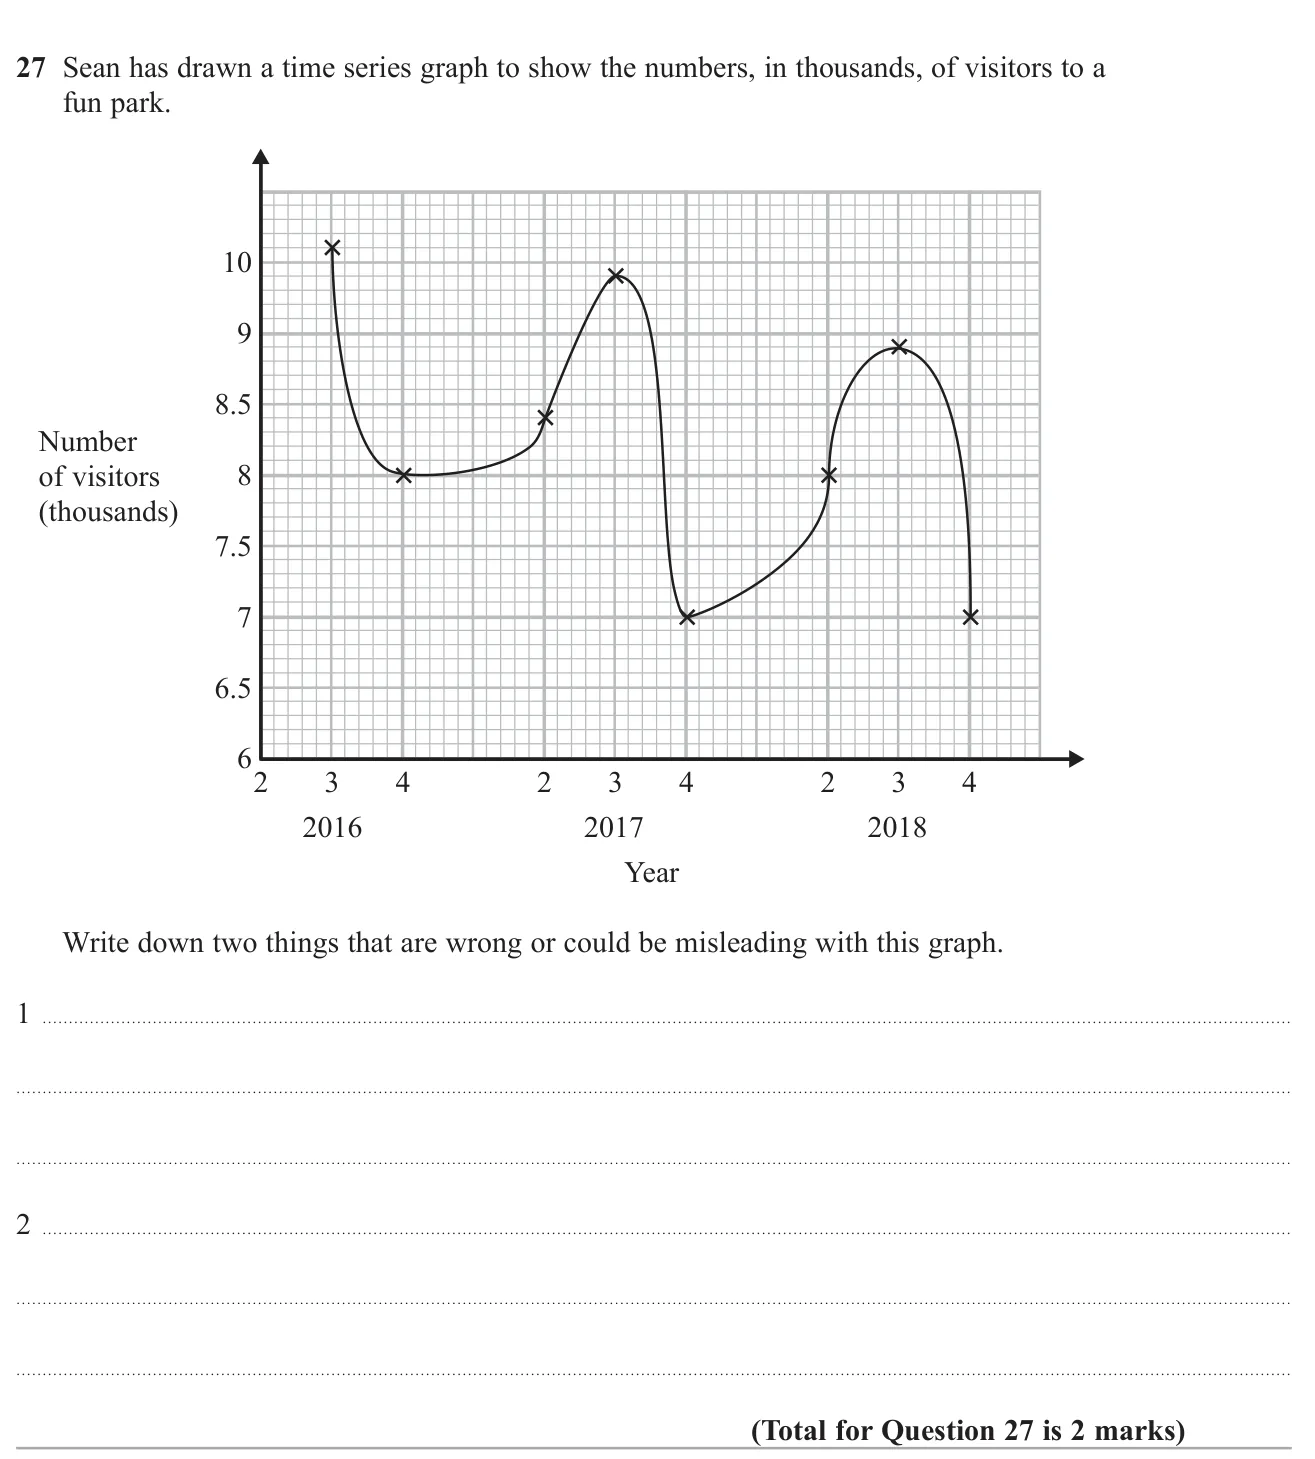
Answer Any two, e.g. points joined with curves not straight lines; the vertical axis starts at 6 not 0; quarter 1 is missing; the 2, 3, 4 labels are unclear 2 marks
Worked solution Checked against the mark scheme
Things wrong with the graph:
1. The points are joined with curves; a time series should use straight lines.
Other valid points: the first quarter of each year is missing, and it is not clear what 2, 3, 4 on the horizontal axis mean.
Watch out: Saying 'there is no title', which does not score.
© Pearson Education Ltd. June 2018 Paper 3 (Foundation, calculator), question 14.
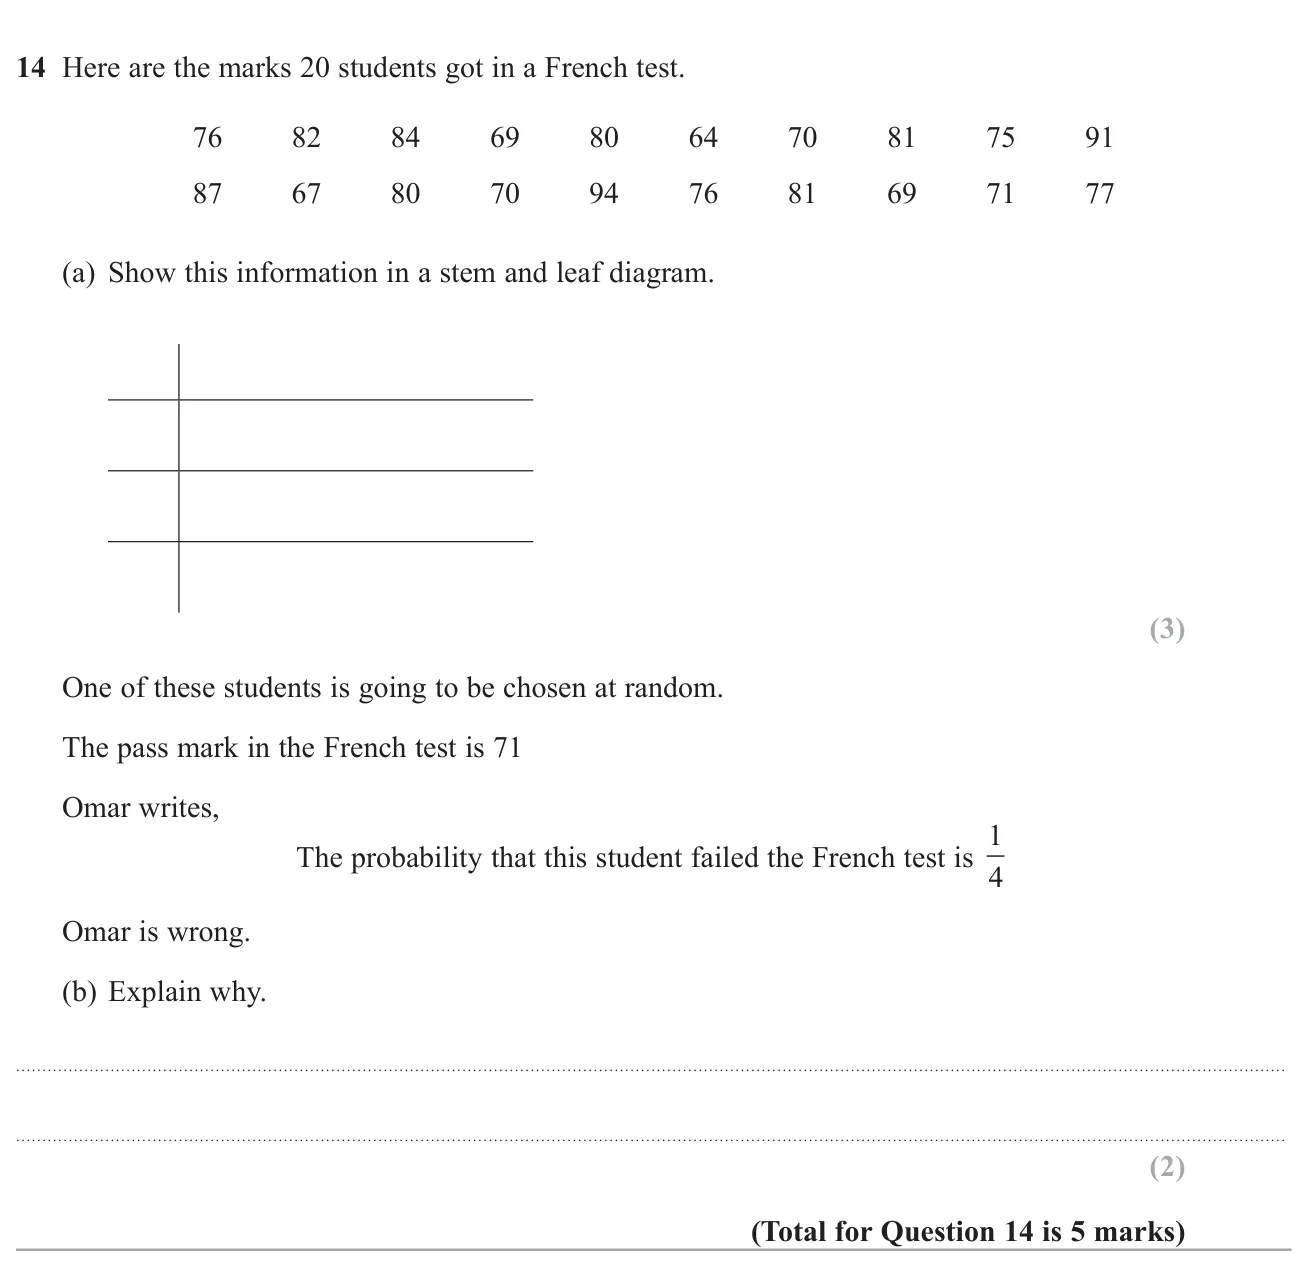
(a) Stems 6 to 9 with ordered leaves: 6 | 4 7 9 9; 7 | 0 0 1 5 6 6 7; 8 | 0 0 1 1 2 4 7; 9 | 1 4; key 6 | 4 = 64 3 marks (b) 6 of the 20 students failed, so the probability is 6 20 \frac{6}{20} 20 6 1 4 = 5 20 \frac{1}{4} = \frac{5}{20} 4 1 = 20 5 2 marks
Worked solution Checked against the mark scheme
(a) Put the tens digits as stems and the units in order as leaves:
6 | 4 7 9 9
Key: 6 | 4 means 64 marks.
(b) Marks below 71: 64, 67, 69, 69, 70, 70, so 6 students failed.
P ( fail ) = 6 20 = 3 10 P(\text{fail}) = \frac{6}{20} = \frac{3}{10} P ( fail ) = 20 6 = 10 3 1 4 = 5 20 \frac{1}{4} = \frac{5}{20} 4 1 = 20 5
Watch out: Leaving out the key, or counting 71 as a fail.
© Pearson Education Ltd. November 2018 Paper 3 (Higher, calculator), question 7.
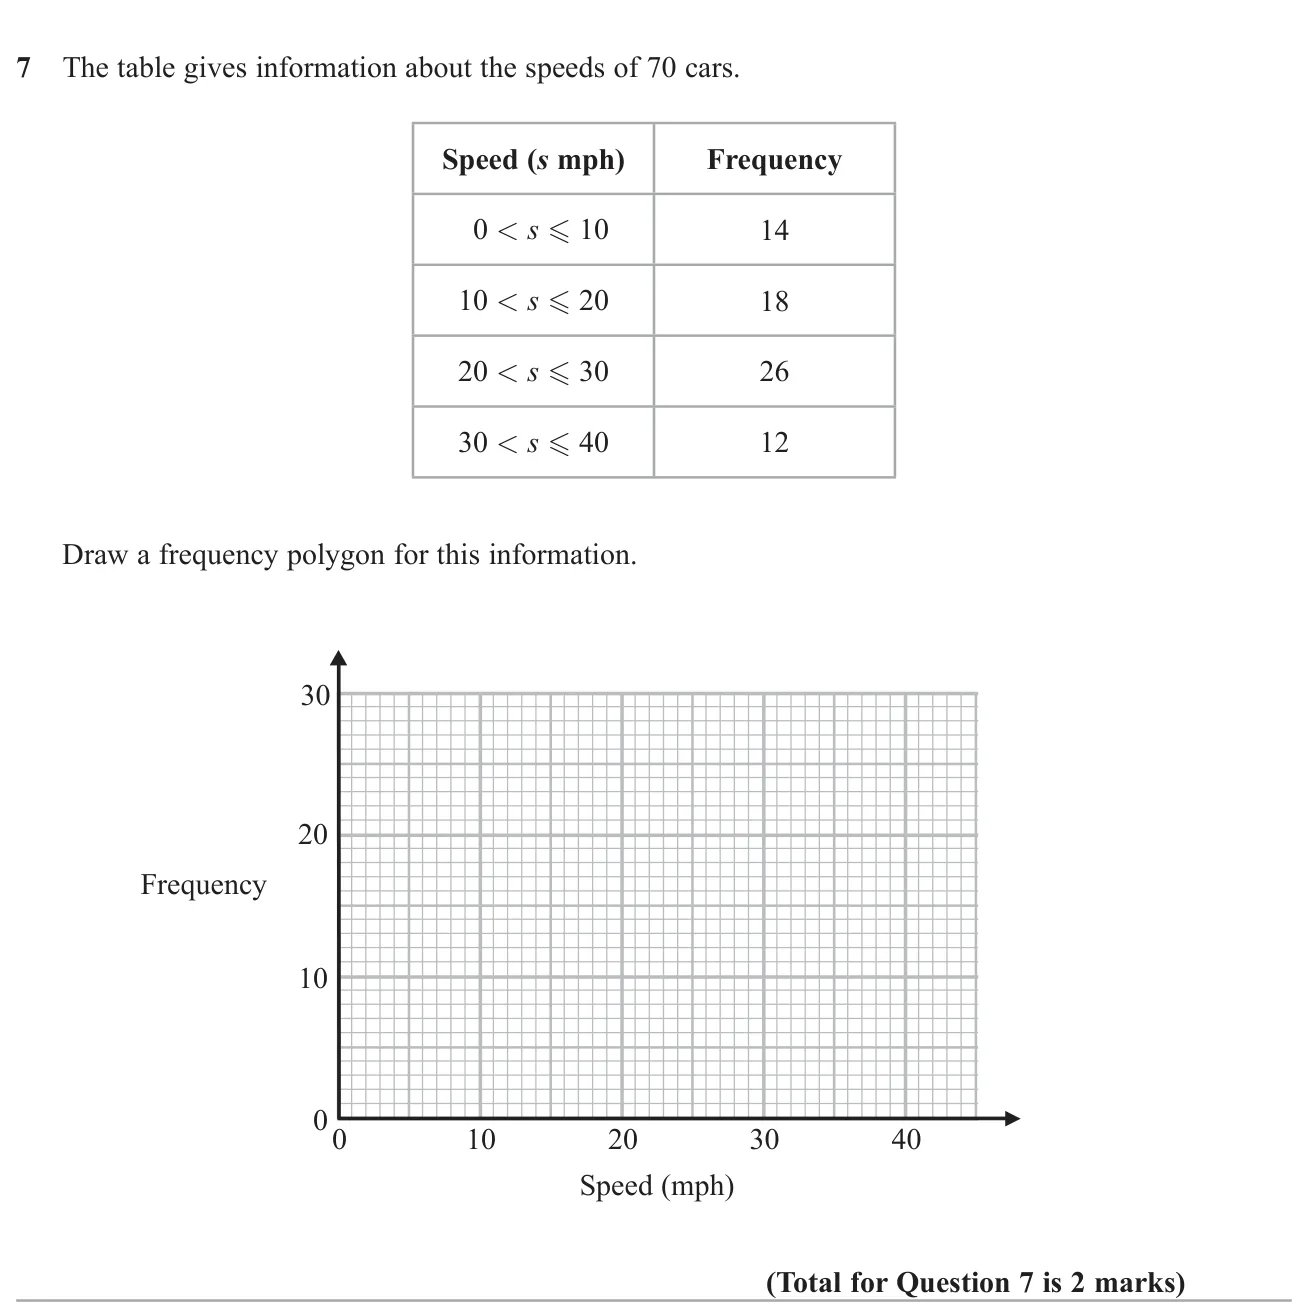
Answer Points at ( 5 , 14 ) , ( 15 , 18 ) , ( 25 , 26 ) , ( 35 , 12 ) (5, 14), (15, 18), (25, 26), (35, 12) ( 5 , 14 ) , ( 15 , 18 ) , ( 25 , 26 ) , ( 35 , 12 ) 2 marks
Worked solution Checked against the mark scheme
Plot each frequency above the middle of its class: 5, 15, 25 and 35.
Points: ( 5 , 14 ) (5, 14) ( 5 , 14 ) ( 15 , 18 ) (15, 18) ( 15 , 18 ) ( 25 , 26 ) (25, 26) ( 25 , 26 ) ( 35 , 12 ) (35, 12) ( 35 , 12 )
Join them in order with straight lines. Do not join the last point back to the first.
Watch out: Plotting at the ends of the classes (10, 20, 30, 40) instead of the midpoints.
© Pearson Education Ltd. Specimen Paper 2 (Foundation, calculator), question 23.
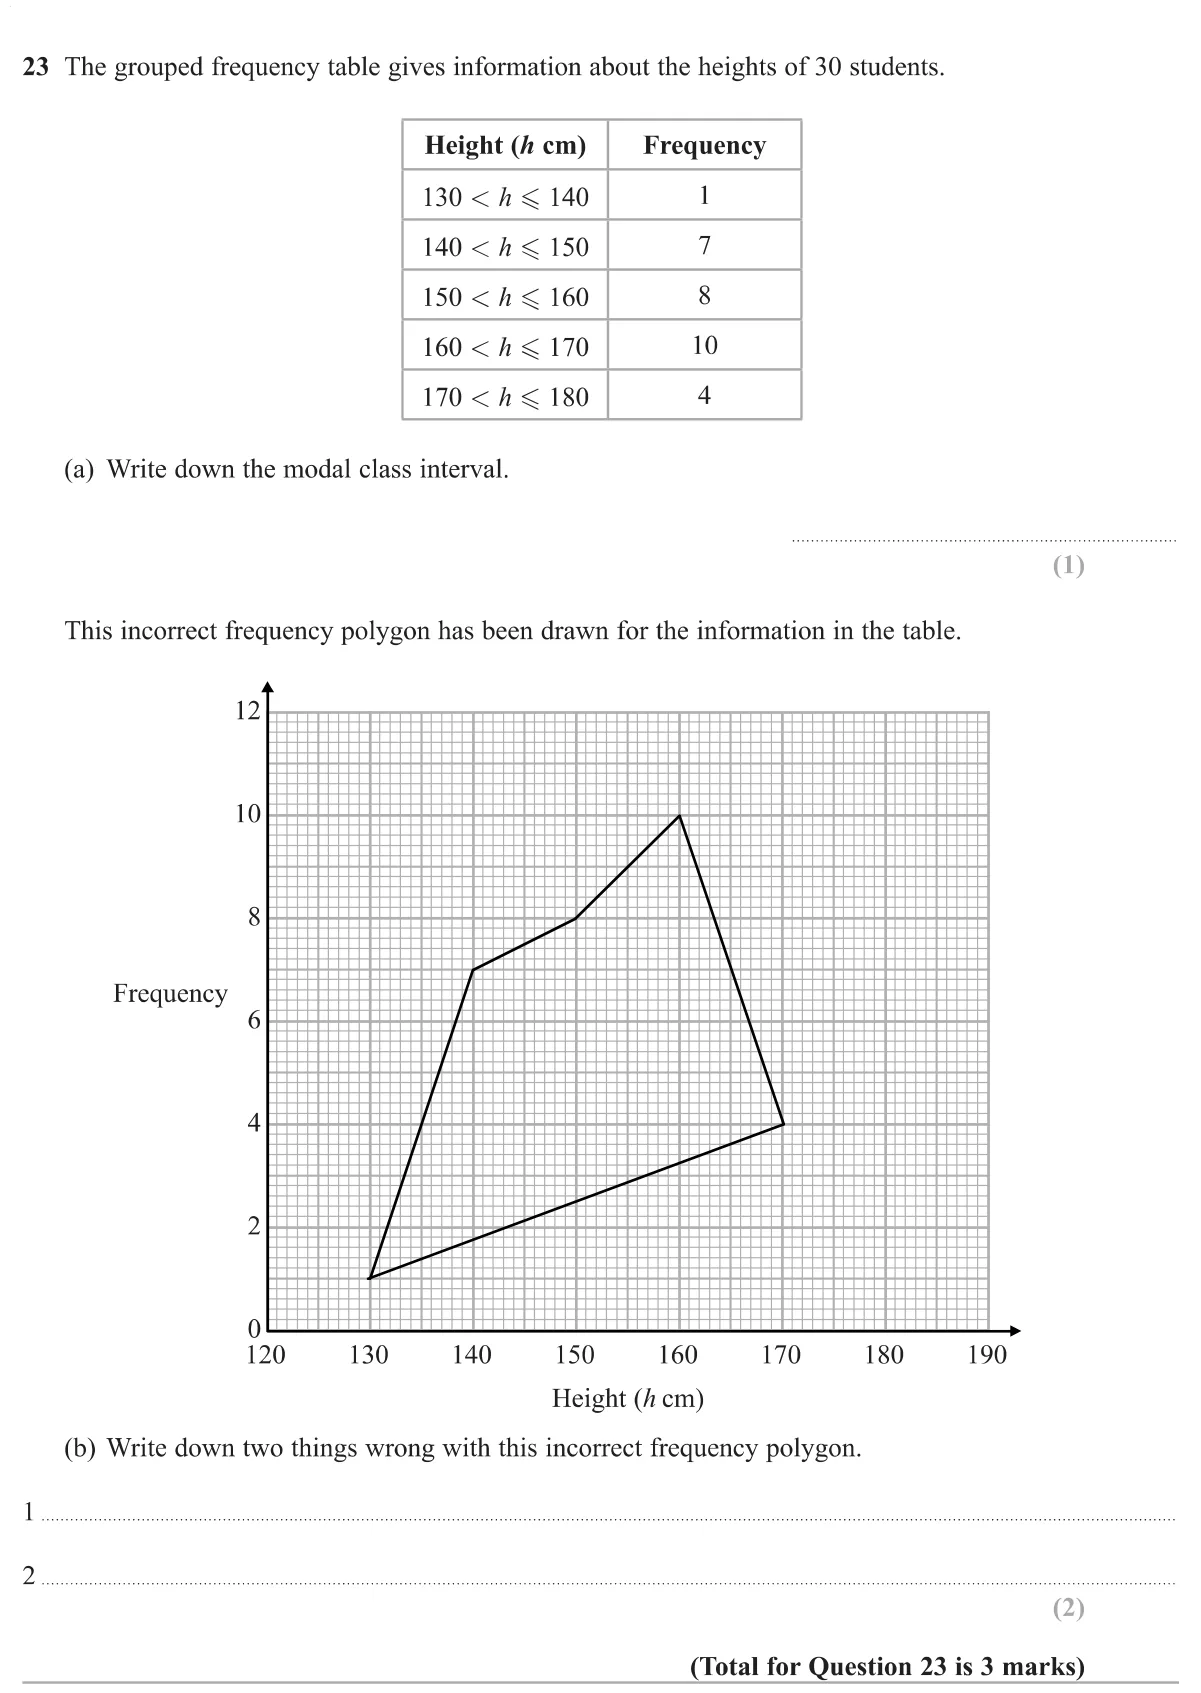
(a) 160 < h ≤ 170 160 < h \le 170 160 < h ≤ 170 1 mark (b) Points should be at the midpoints of the classes; the polygon should not be joined back to the first point 2 marks
Worked solution Checked against the mark scheme
(a) The highest frequency is 10, in the class 160 < h ≤ 170 160 < h \le 170 160 < h ≤ 170
(b) The points are plotted at the ends of the classes instead of the middles (135, 145, ...).
The last point is joined back to the first, which a frequency polygon should not do.
Watch out: In (a), giving the frequency 10 instead of the class.
© Pearson Education Ltd. Specimen Paper 2 (Higher, calculator), question 4.
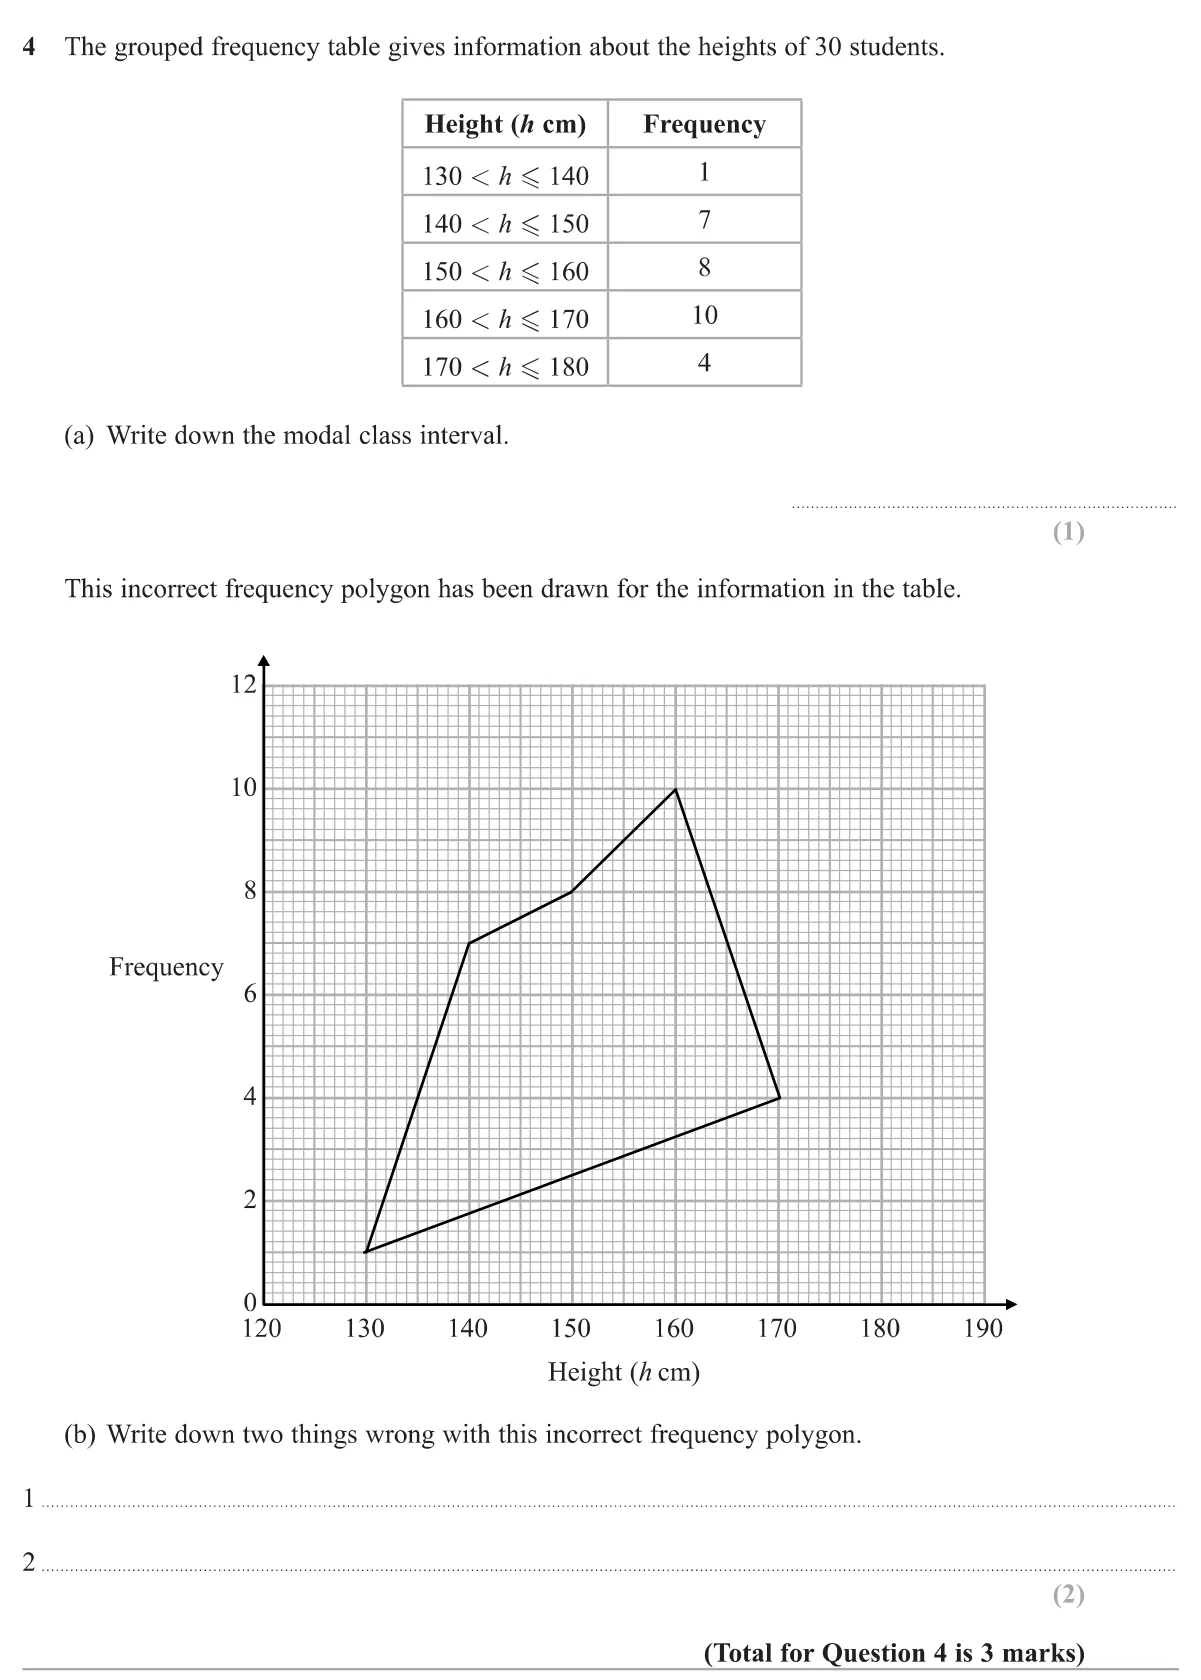
(a) 160 < h ≤ 170 160 < h \le 170 160 < h ≤ 170 1 mark (b) Points should be plotted at the midpoints of the intervals; the polygon should not be joined up (closed) from the last point back to the first 2 marks
Worked solution Checked against the mark scheme
(a) The largest frequency is 10, in the class 160 < h ≤ 170 160 < h \le 170 160 < h ≤ 170
(b) The points are plotted at the start of each class instead of at the midpoints (135, 145, …).
The last point has been joined back to the first, but a frequency polygon is not a closed shape.
Watch out: In (a), giving the frequency 10 instead of the class interval.
© Pearson Education Ltd. November 2019 Paper 1 (Foundation, non-calculator), question 18.
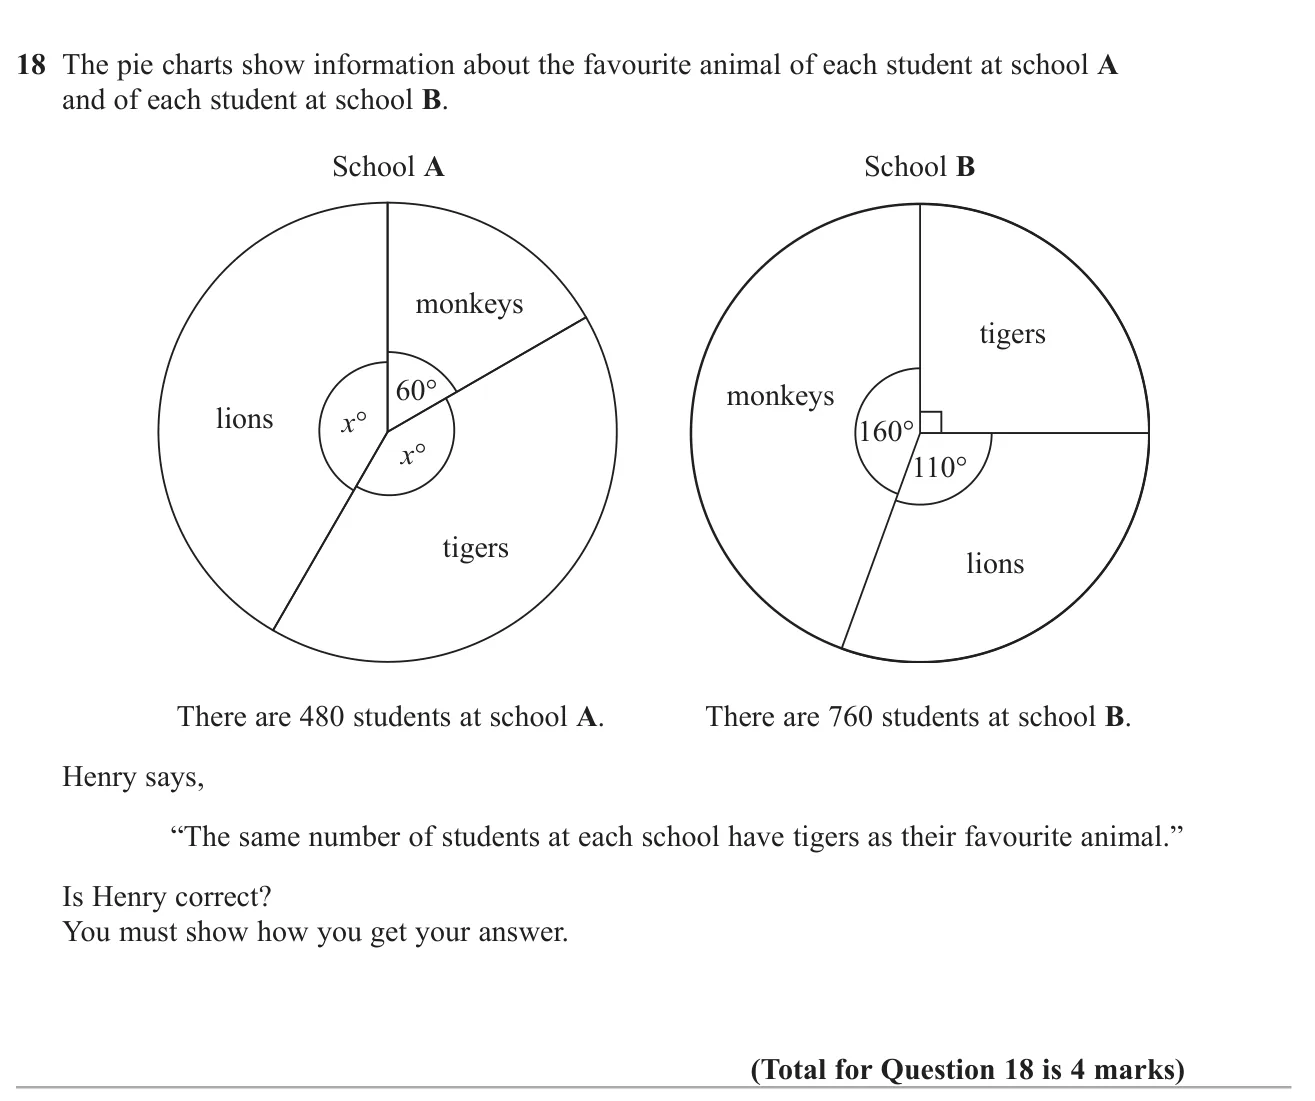
Answer No: 200 at school A but 190 at school B 4 marks
Worked solution Checked against the mark scheme
School A: x = ( 360 − 60 ) ÷ 2 = 150 ° x = (360 - 60) \div 2 = 150° x = ( 360 − 60 ) ÷ 2 = 150°
Tigers at A = 150 360 × 480 = 200 = \frac{150}{360} \times 480 = 200 = 360 150 × 480 = 200
School B: tigers angle = 360 − 160 − 110 = 90 ° = 360 - 160 - 110 = 90° = 360 − 160 − 110 = 90°
Tigers at B = 90 360 × 760 = 190 = \frac{90}{360} \times 760 = 190 = 360 90 × 760 = 190
200 ≠ 190 200 \ne 190 200 = 190 not correct.
Watch out: Comparing the angles instead of the numbers of students.
Also tested in these questions Their main topic is different, but part of each one tests this topic.
November 2024 · Paper 1 Higher · Q9 : Read quartiles and the median from a cumulative frequency graph to draw a box plot, then test a claim about the percentage who passed.June 2024 · Paper 2 Higher · Q11 : Complete a cumulative frequency table, draw the graph, estimate the interquartile range and count values above a given weight.November 2023 · Paper 2 Higher · Q15 : Complete a frequency table and histogram from each other, then estimate a median from a second histogram.November 2023 · Paper 3 Higher · Q13 : Read a cumulative frequency graph to estimate a probability, the median and the interquartile range, then compare spreads.June 2023 · Paper 2 Higher · Q9 : Plot a cumulative frequency graph from a table of ages and read off an estimate of the median.June 2023 · Paper 3 Foundation · Q9 : Find the median and range of four values from a table, then draw a bar chart.November 2022 · Paper 1 Foundation · Q7 : Find the mode of a list of letters, then mark and state probabilities of picking particular letters.November 2022 · Paper 2 Foundation · Q15 : Draw an ordered stem and leaf diagram with a key for a list of data, then find its median.June 2022 · Paper 1 Higher · Q10 : Build a cumulative frequency table and graph for daily profits, then estimate a count and the interquartile range.June 2022 · Paper 2 Foundation · Q9 : Read a value from a line graph of monthly house sales and write the ratio of two months' sales.June 2022 · Paper 2 Higher · Q10 : Explain an error about quartiles, draw a box plot from summary values, and compare two sales distributions.November 2021 · Paper 1 Higher · Q12 : Plot a cumulative frequency curve for plant heights and read off the median.November 2020 · Paper 3 Higher · Q17 : Work out class frequencies from a histogram and use midpoints to estimate the mean long-jump distance.November 2019 · Paper 1 Higher · Q10 : Draw a cumulative frequency graph, then use it to estimate the interquartile range and a probability.June 2019 · Paper 1 Higher · Q11 : Find the median and quartiles of a list of ages, then compare two groups on average and on spread.June 2019 · Paper 3 Higher · Q21 : Read frequencies from a histogram, then find the pie-chart angle for the onions between 60 g and 120 g.June 2019 · Paper 3 Foundation · Q26 : Find the class containing the median of grouped heights, then draw a frequency polygon.November 2018 · Paper 3 Foundation · Q23 : Read a grouped bar chart to find a percentage, then show an estimate of the mean from grouped data.June 2018 · Paper 2 Higher · Q17 : Read frequencies from a histogram with unequal class widths and estimate the lower quartile.June 2018 · Paper 3 Foundation · Q15 : Spot the error in an order-of-operations calculation and in a range calculation.Specimen · Paper 2 Higher · Q3 : Read six monthly sales figures from a time-series graph and decide whether their mean reaches a target of 96.Specimen · Paper 2 Foundation · Q22 : Read six values from a time-series graph and compare their mean with a target.